Discover the essentials of Data Observability Open Source tools and practices that help you ensure your data's quality and reliability. Here's a quick overview:
- Data Observability involves monitoring your data's health through metrics, logs, and traces to catch issues early.
- Core Principles include continuous data testing, anomaly detection, and end-to-end pipeline visibility.
- Open Source Tools offer flexibility, customizability, and help avoid vendor lock-in, making them ideal for adaptable and scalable data observability.
Key Open Source Tools:
- Prometheus for metrics and alerts.
- Loki for log aggregation.
- OpenTelemetry for collecting and shipping telemetry data.
- Fluentd for data collection and log shipping.
- Opstrace offers a managed observability suite.
- Vector for data processing and observability pipelines.
- SigNoz for application performance monitoring.
Benefits include cost savings, customizability, community support, and avoiding vendor lock-in. However, challenges like integration complexity and maintenance overheads need consideration.
Choosing the right tools involves assessing capabilities, scalability needs, ease of integration, and community support to ensure they meet your data observability requirements.
Core Principles of Data Observability
The main ideas behind data observability include:
- Continuous data testing - Always checking the quality of data at every step. This helps catch problems early.
- Anomaly detection - Using smart tech like machine learning to spot when data isn't acting as expected.
- End-to-end pipeline visibility - Making sure you can see and understand the whole data process, from where it starts to where it ends.
Following these ideas helps make sure everything runs smoothly and your data stays accurate.
Role of Open Source Tools
Open source tools for data observability are really helpful because they:
- Flexibility - Let you mix and match tools to suit your needs, instead of being stuck with what one company offers.
- Avoiding vendor lock-in - Keep you from being trapped into using just one company's tools, which can get expensive.
- Customizability - Allow you to tweak tools to better meet your specific needs.
Open source tools are great for keeping an eye on your data in a way that's flexible and can grow with you.
Pillars of Data Observability
Metrics
Metrics are like the vital signs for your data, telling you about its health and activity. Think of them as the answers to 'what is happening' with your data as it moves.
Here are some key metrics to keep an eye on:
- Data volume - This is about how much data you're dealing with. If you suddenly have a lot more or less, it might mean there's a problem.
- Data latency - This measures how long data takes to get from one point to another. If it's taking longer, there might be a bottleneck.
- Data distribution - This looks at how your data is spread out. Changes can show issues with where your data is coming from.
- Error rates - This is the percentage of your data that has problems. An increase means your data's quality might be dropping.
By watching these metrics, you can spot issues early and keep them from getting worse.
Logs
Logs are detailed records that tell you more about what's happening with your data. They're great for figuring out 'why' something went wrong.
Good logging practices include:
- Recording errors, warnings, and other important events
- Keeping track of when things happened, what the data looks like, and where it came from
- Following your data's path from start to finish
- Making sure old logs are stored properly but don't get in the way
Logs give you a clear picture of problems, helping you fix them faster.
Traces
Traces are all about tracking your data's journey. They're your go-to for answering 'where' questions when things go wrong.
To do tracing well, you need tools that:
- Use special IDs to keep track of data pieces
- Mark important steps as your data moves along
- Show you a map of your data's entire trip
Tracing helps you see how a problem in one spot can affect other areas, making it easier to find and fix issues quickly.
Key Features of Open Source Data Observability Tools
Customizability
Open source tools for keeping an eye on your data let you change them to fit exactly what you need. Since the software is open, you can adjust the code to track the specific things you care about, like certain data points, errors, or how your data moves. This means you're not stuck with one company's tools and can change your tools as your data needs grow.
Anomaly and Error Detection
These tools help you watch your data in real-time, so you can quickly spot when something's not right, like mistakes or when data stops flowing as it should. You set up rules to flag when data looks weird or doesn't meet your standards. Some smart tools even learn what 'normal' looks like for your data and tell you when things are off. If something's wrong, you get an alert.
Visual Data Analysis
Being able to see your data in charts or graphs makes it easier to understand what's happening. Open source tools offer ways to visually show information about your data, like where errors are or how fast data is moving. This helps you spot trends or problems without having to dig through tons of numbers.
Data Testing Automation
It's important to regularly check your data for errors, especially when it goes through complicated processes. Open source tools can automatically run checks to make sure your data is as it should be. This means less manual work and more confidence in your data's quality.
Notifications and Alerting
Getting alerts the moment something goes wrong with your data means you can fix problems fast. Open source tools let you set up notifications for when data doesn't look right or when it's moving too slowly. You can get these alerts through email, messaging apps, or other platforms, so the right people can jump in and solve the issue.
Top 7 Open Source Data Observability Tools
Open source tools for watching over your data help you keep an eye on how it's doing, find problems, and fix them. Here are 7 easy-to-use tools that many people like:
Prometheus
Prometheus is a top choice for checking on your data and getting alerts. It's good at:
- Keeping track of data over time
- Letting you ask questions about your data to make charts and dashboards
- Gathering data from different places
- Works well with lots of other tools
Loki
Loki helps you collect and look at logs (records of what's happening) and works well with Grafana for making sense of data. It's good at:
- Storing logs in a way that doesn't mix them up
- Using tags to sort and find logs
- Showing logs in Grafana so you can understand them better
OpenTelemetry

OpenTelemetry lets you collect data like metrics, logs, and traces without being locked into one tool. It can:
- Work with different types of data together
- Automatically collect data from common frameworks
- Send your data to tools for analyzing
Fluentd
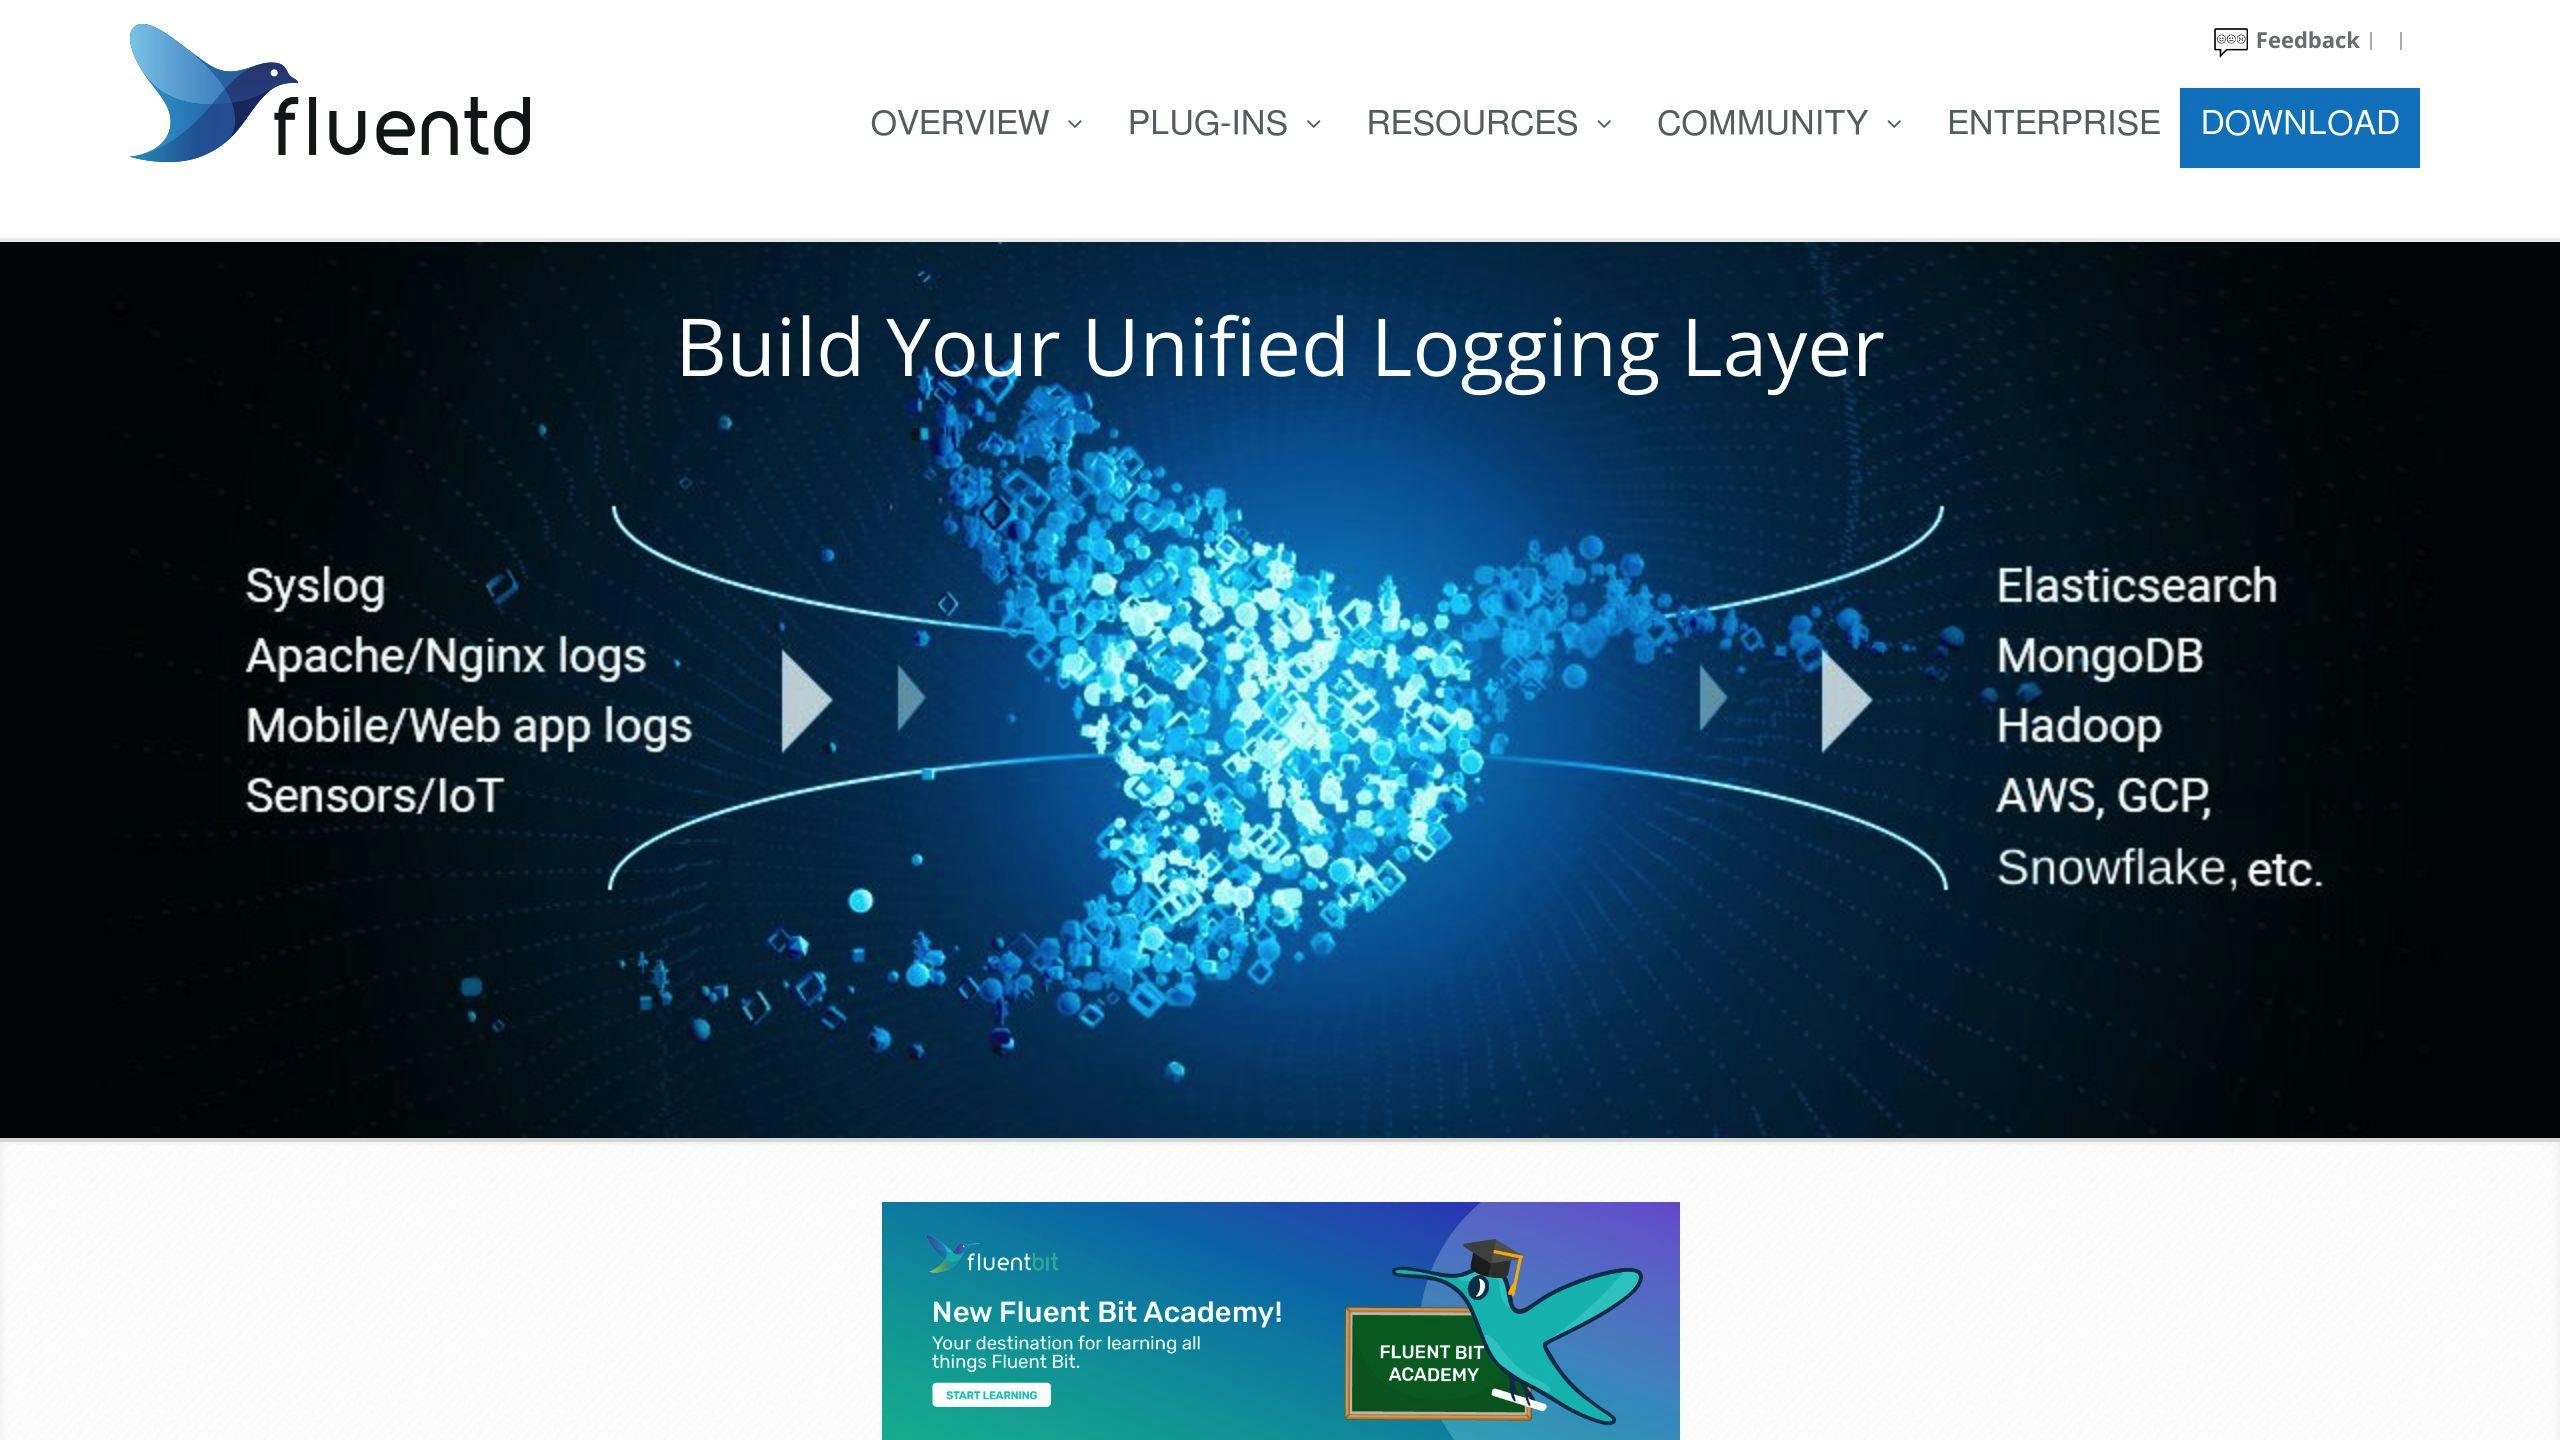
Fluentd is a tool for collecting data and logs, making it easier to manage. It offers:
- Lots of ways to collect and send out data
- A reliable setup that can handle lots of data without losing it
- A single place to handle all your logs
Opstrace
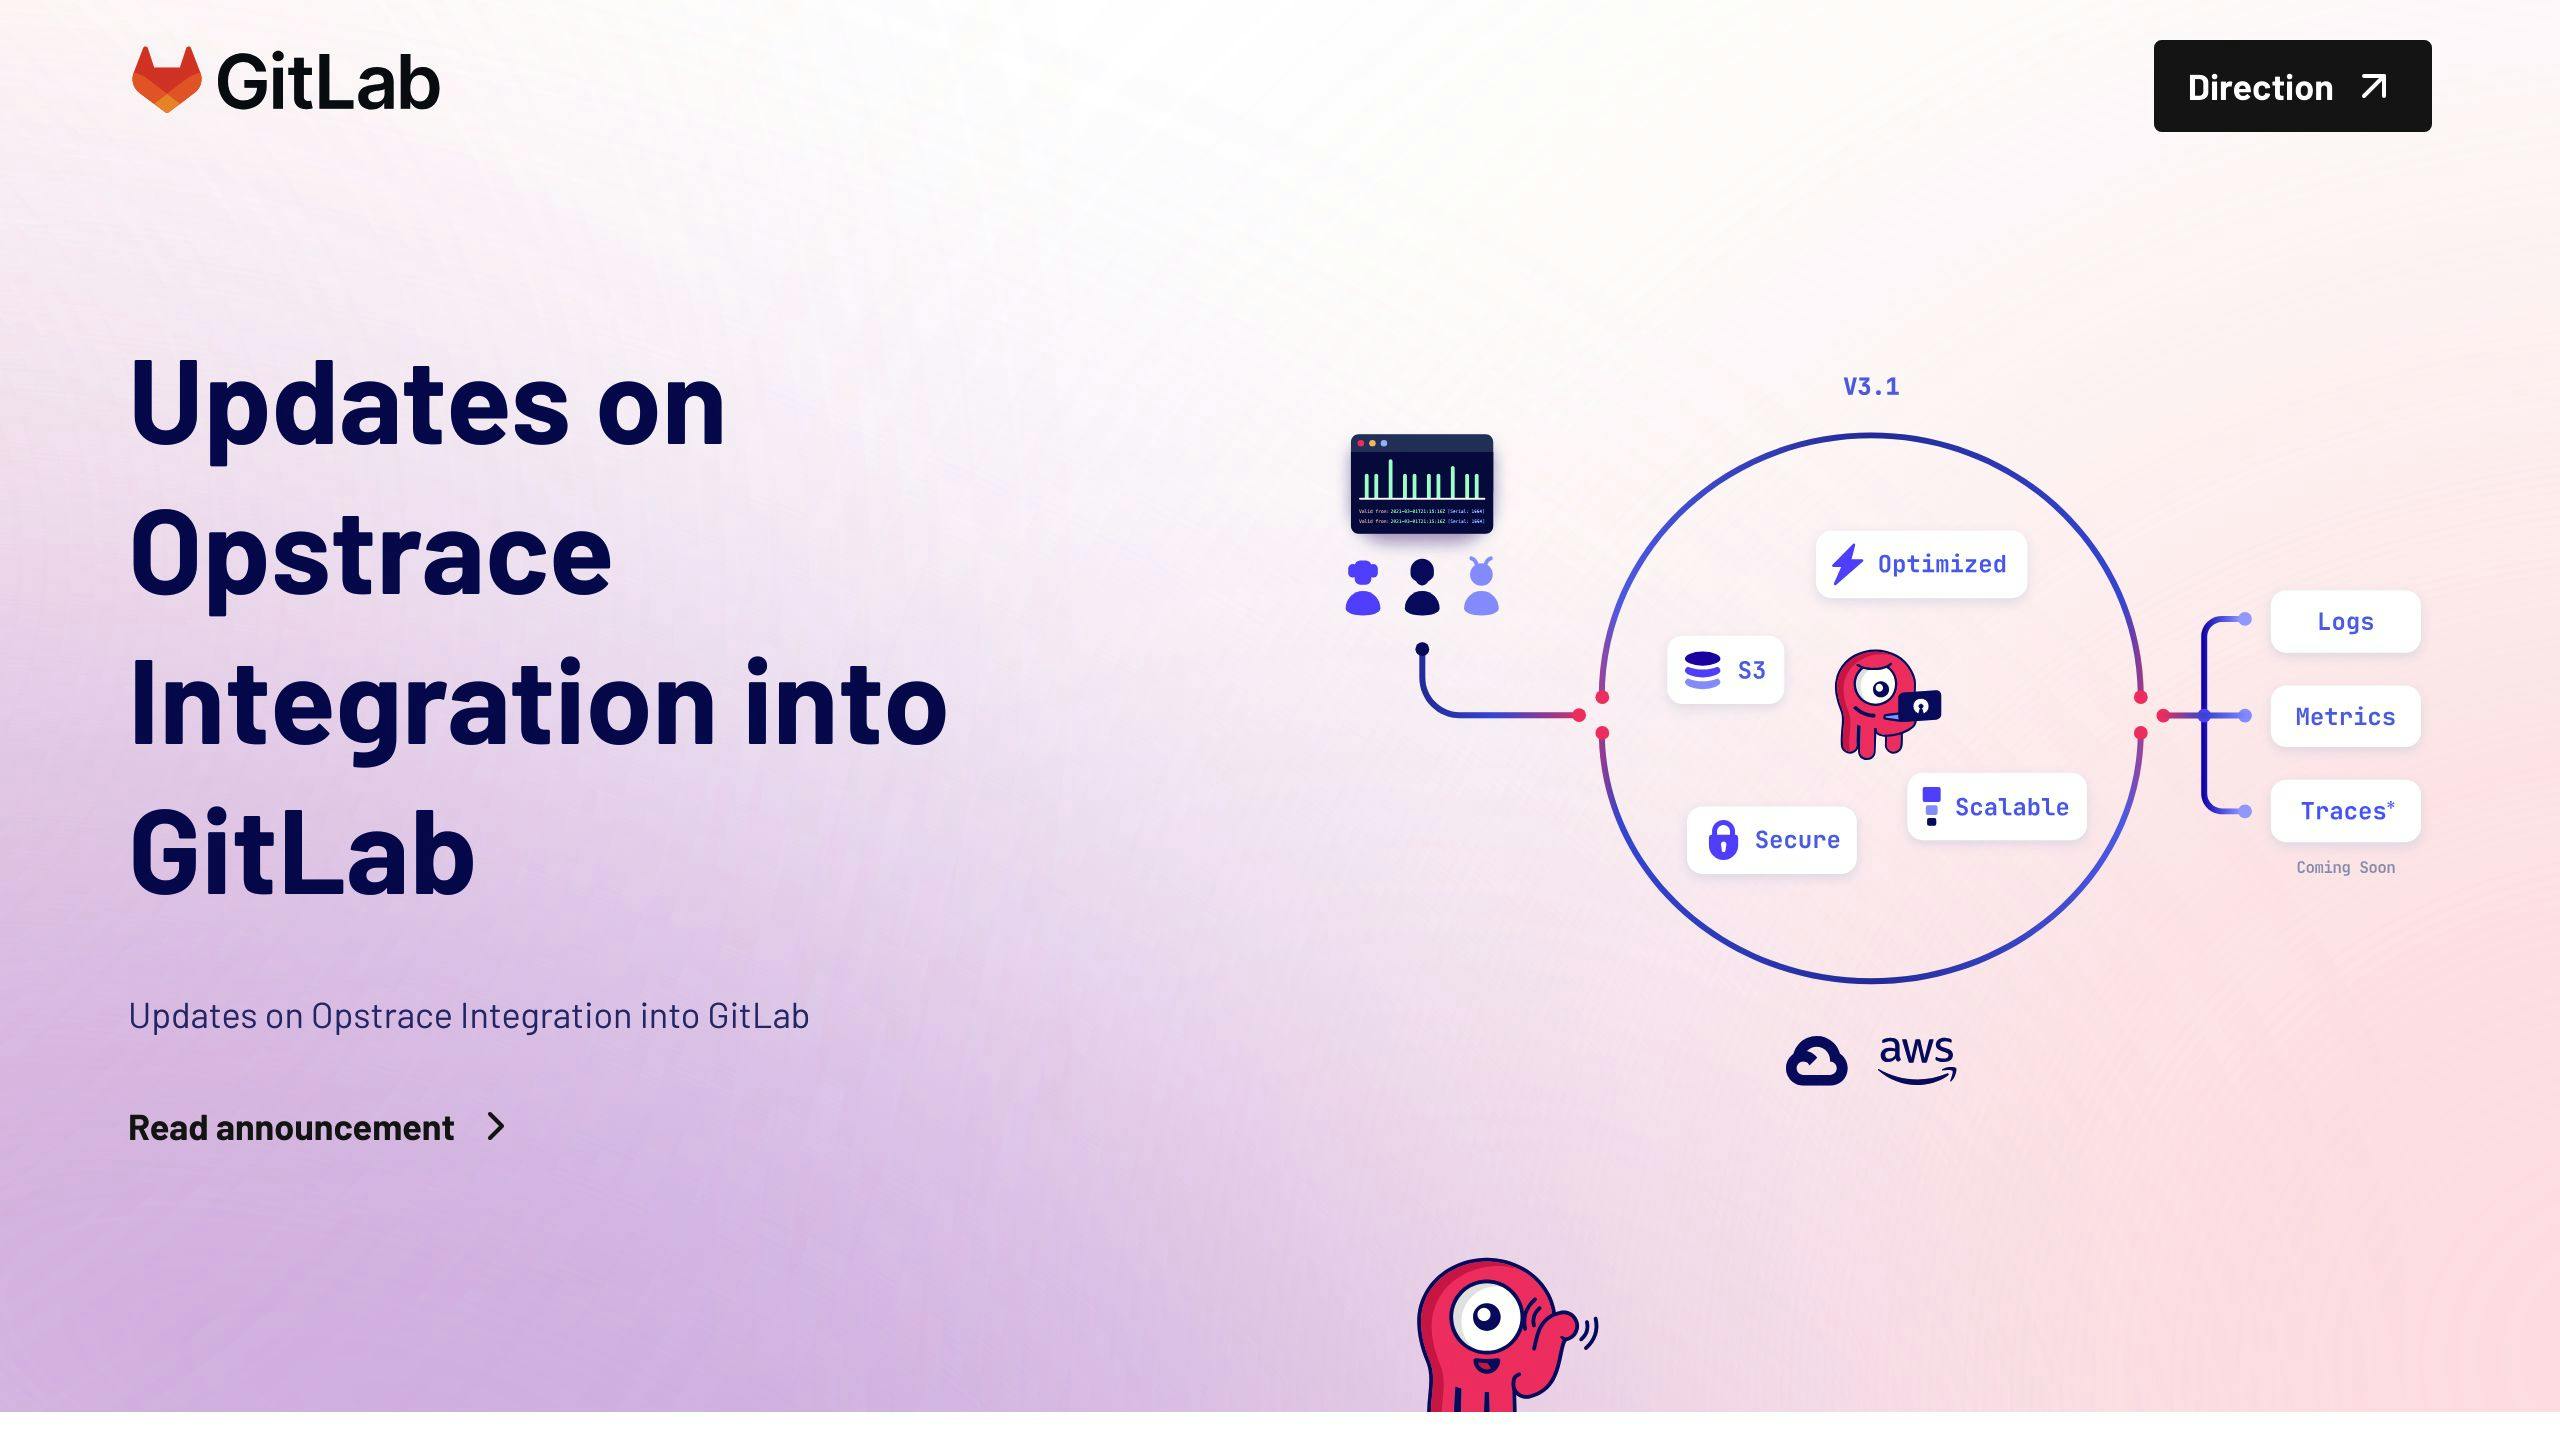
Opstrace uses popular open source tools to watch over your data, offering a safe, managed service. Its benefits include:
- Easy-to-use observability without being stuck with one provider
- Built-in security features
- Made for modern cloud setups
Vector
Vector is a powerful tool for managing your data flow, letting you search, filter, and change data. It helps with:
- Handling different types of observability data
- Changing and directing data where it needs to go
- Easy setup for managing your data
SigNoz
SigNoz is a good alternative to other tools for watching over your data, offering visuals right away. It's great for:
- Combining metrics, traces, and logs in one place
- Ready-to-use dashboards and alerts
- Works well in modern setups like Kubernetes
These tools give you a full view of your data, with the freedom to adapt as your needs change.
Benefits of Open Source Data Observability Tools
Cost Savings
Open source tools for watching over your data don't cost you every month like other programs do. They're free to use, which means you can save a lot of money that you'd otherwise spend on expensive software. Even as your needs grow, you won't have to worry about paying more just because you're using the tool more.
Customizability
One of the best things about open source tools is that you can make them work just how you need. If you need to track something special or get alerts a certain way, you can change the code to do that. This way, you're not stuck with what a company thinks you need; you can make the tool fit your project perfectly.
Community Support
When you use open source tools, there's a whole group of people out there ready to help if you run into problems. You can find answers and get help from others who have been there. Plus, if there's something new you want the tool to do, you can work with the community to make it happen.
Avoiding Vendor Lock-in
Sticking with one company for your tools can make it hard to switch later and might cost you more money. Open source tools mean you can try different ones and use whatever works best for you, without worrying about contracts or fees.
Access to Source Code
Being able to look at and change the code of your tools is a big deal. It lets you make sure they work just right with your system, check for any security issues yourself, and even fix problems without having to wait for someone else. Plus, lots of people looking at the code means it gets checked and improved all the time.
sbb-itb-9890dba
Challenges with Open Source Data Observability Tools
Using free tools to keep an eye on your data sounds great, but it's not always easy. Let's talk about some common issues people run into and how to deal with them.
Integration Complexity
Putting together a set of tools like Prometheus, Grafana, and others to watch over your data can be tricky. There's a lot of manual work involved because these tools don't automatically connect to each other or come with ready-made views of your data. You'll need to know your stuff to get everything working together, especially if you're trying to add custom features or connect to systems that aren't on the internet.
Maintenance Overheads
Even though these tools are free, you'll need someone (or a team) to keep them running smoothly. This includes updating the tools, making sure they're working well, and fixing any problems that come up. If you don't have people who can do this, you might end up paying for outside help, which can add up.
Vendor Support Lacking
With free tools, there's no promise of help when you need it. You can find some advice and instructions online, but there's no one you can call for guaranteed help. If something goes wrong, you might be on your own to figure it out.
Scaling Complexities
These tools can work great when you're just starting or if you don't have a ton of data. But as your data grows, you might run into problems. Making sure your system can handle more data without crashing or slowing down can get complicated. You might need to do some serious tech work to keep everything running smoothly.
In short, free tools for data observability can save you money and give you flexibility, but they also come with their own set of challenges. It's important to know what you're getting into and make sure you have the right skills on your team to handle these tools.
Choosing the Right Open Source Tools
Capabilities Assessment
When picking tools to help you keep an eye on your data, start by looking at what your setup already does. Ask yourself:
- Metrics - What kinds of data issues do you need to track?
- Logs - What details about events or errors should be recorded?
- Tracing - Which data paths are crucial to monitor closely?
- Anomaly detection - What unusual data patterns should raise flags?
- Visualizations - What kinds of charts or graphs would help teams the most?
Making a list of these needs will help you choose the right tools.
Scalability Needs
Think about how much data you're dealing with now and how much you'll have in the future. Consider:
- How many events per second need logging?
- How many data points per second for metrics?
- How many requests need tracing?
Look for tools that can grow with you, especially those that work well in a Kubernetes environment since they can scale up easily.
Ease of Integration
Check how well new tools will fit with what you already use for logging, monitoring, and data analysis. Aim for tools that:
- Easily connect with your current setup
- Have libraries for your main data sources
- Offer extra connectors if you need them
This will make combining new and old tools smoother.
Customizability vs Complexity
Open source tools can be tweaked, but think about if you have the time to keep up with changes. Sometimes, it's better to use the basic features first and add more as you need them.
Community Support Strength
Look into the community around each tool by checking:
- Activity on GitHub
- Questions and answers on StackOverflow
- How fast you get replies on forums
- How many people are contributing
Tools with active, helpful communities are usually better choices because you can get help and advice more easily.
Following these steps will help you find the best open source tools for watching over your data. It's all about matching what the tools can do with what you need, without making things too complicated.
Implementing Open Source Data Observability Tools
Phased Rollout
Start by trying out open source data observability tools on a small part of your system. This helps you:
- See how well the tools work before using them everywhere.
- Find any problems with how they fit into your current setup.
- Figure out any changes you need to make to get the most out of the tools.
- Learn how to manage and use the tools effectively.
After you're happy with the results in a small test, you can gradually use the tools in more areas, using what you learned to make things go smoother.
Configuration Management
Keeping track of settings for many tools can be tough. Using tools like Kubernetes operators or programs like Ansible, Terraform, or Pulumi can help you automatically set up and manage these settings.
Things to keep an eye on include:
- How much computer power and memory the tools can use
- Where to store data like metrics, logs, and traces
- How to safely let the tools access what they need
- How to connect to your data
- Settings and options that need tweaking
Visualization and Alerting
Using Grafana, you can make dashboards that show important info from your data, like how fast things are happening or when errors pop up. Setting up these dashboards and alerts early on can help you keep an eye on things that matter.
Some things you might want to track and get alerts about include:
- How quickly data moves through your system
- How many requests your API is handling and how many fail
- Unexpected changes in how much data you're getting
- Serious errors in your applications
Resource Optimization
With Kubernetes, you can adjust how many resources your tools use based on how busy they are. This includes making sure there's enough computer power and memory for everything to run smoothly.
Keep tweaking these settings to find a good balance between cost and how well things run. Be ready to add more resources if you start handling more data.
Maintenance Procedures
Make clear plans for:
- Updating tools and fixing security issues
- Testing changes in a safe environment before going live
- What to do if something breaks
- Plans for handling too much data or not enough resources
Write down these steps in a guide for your team, with information on who to call if there are problems.
The Future of Open Source Data Observability
Open source tools for keeping an eye on your data are getting smarter and more suited for modern, cloud-based setups. Here's what's coming up.
Automated Anomaly Detection
Soon, these tools will get better at finding odd things in your data on their own, thanks to machine learning. This means they can spot problems without you having to set up specific rules.
Key benefits include:
- Fewer false alarms from setting limits too strictly
- Less work in adjusting those limits
- Quicker spotting of issues that are hard to see without machine learning
Some leading projects in this area are Vector, Opstrace, and SigNoz.
Kubernetes-Native Observability
New tools designed just for Kubernetes will make it easier to track your data. They'll use what they know about Kubernetes to automatically watch over your app's components.
Benefits of this approach include:
- Automatic finding of what to monitor
- A better grasp of how Kubernetes works
- Close working relationship with Kubernetes' own tools
Projects leading the way here include Opstrace, SigNoz, and Kubernetes Metric Server.
Reduced Tool Fragmentation
Efforts like OpenTelemetry are making it easier for different monitoring tools to work together. This means you can mix and match the best tools without them clashing.
Key improvements from OpenTelemetry include:
- A single way to gather data from apps
- Common formats for data
- Shared details and context
- Easier to link information across different tools
This move towards unity means less hassle in getting different tools to work together.
Related Questions
What are the 4 pillars of data observability?
The 4 main parts that make up data observability are:
- Metrics - Numbers and stats about your data, like how much there is, how it's spread out, and how fast it moves.
- Metadata - Details that tell you more about your data, like its structure.
- Lineage - Information on where your data comes from and how it changes over time.
- Logs - Notes about what happens to your data as it goes through processes.
Knowing these parts helps you keep a close eye on your data and fix problems before they get big.
What is data observability?
Data observability lets you see and understand everything about your data's journey. It helps make sure your data is correct and can be trusted by watching over it closely.
What is the difference between DataOps and data observability?
DataOps is about getting your data from place to place quickly and smoothly. Data observability is making sure that the data you move is in good shape the whole way. So, DataOps is about speed, and observability is about quality.
What are the basic concepts of observability?
Observability means keeping track of all the important info about how your apps and systems are doing by looking at data from logs, metrics, and traces. This helps you understand what's going on and fix things before they cause problems.