Anomaly detection helps identify unusual patterns in data, signaling potential system issues, security breaches, or fraud. The ELK Stack (Elasticsearch, Logstash, Kibana) simplifies this process by offering tools to collect, analyze, and visualize data efficiently. Here's a quick breakdown of its capabilities:
- Elasticsearch: Indexes and analyzes data; uses machine learning for anomaly detection.
- Logstash: Processes and transforms raw data for deeper analysis.
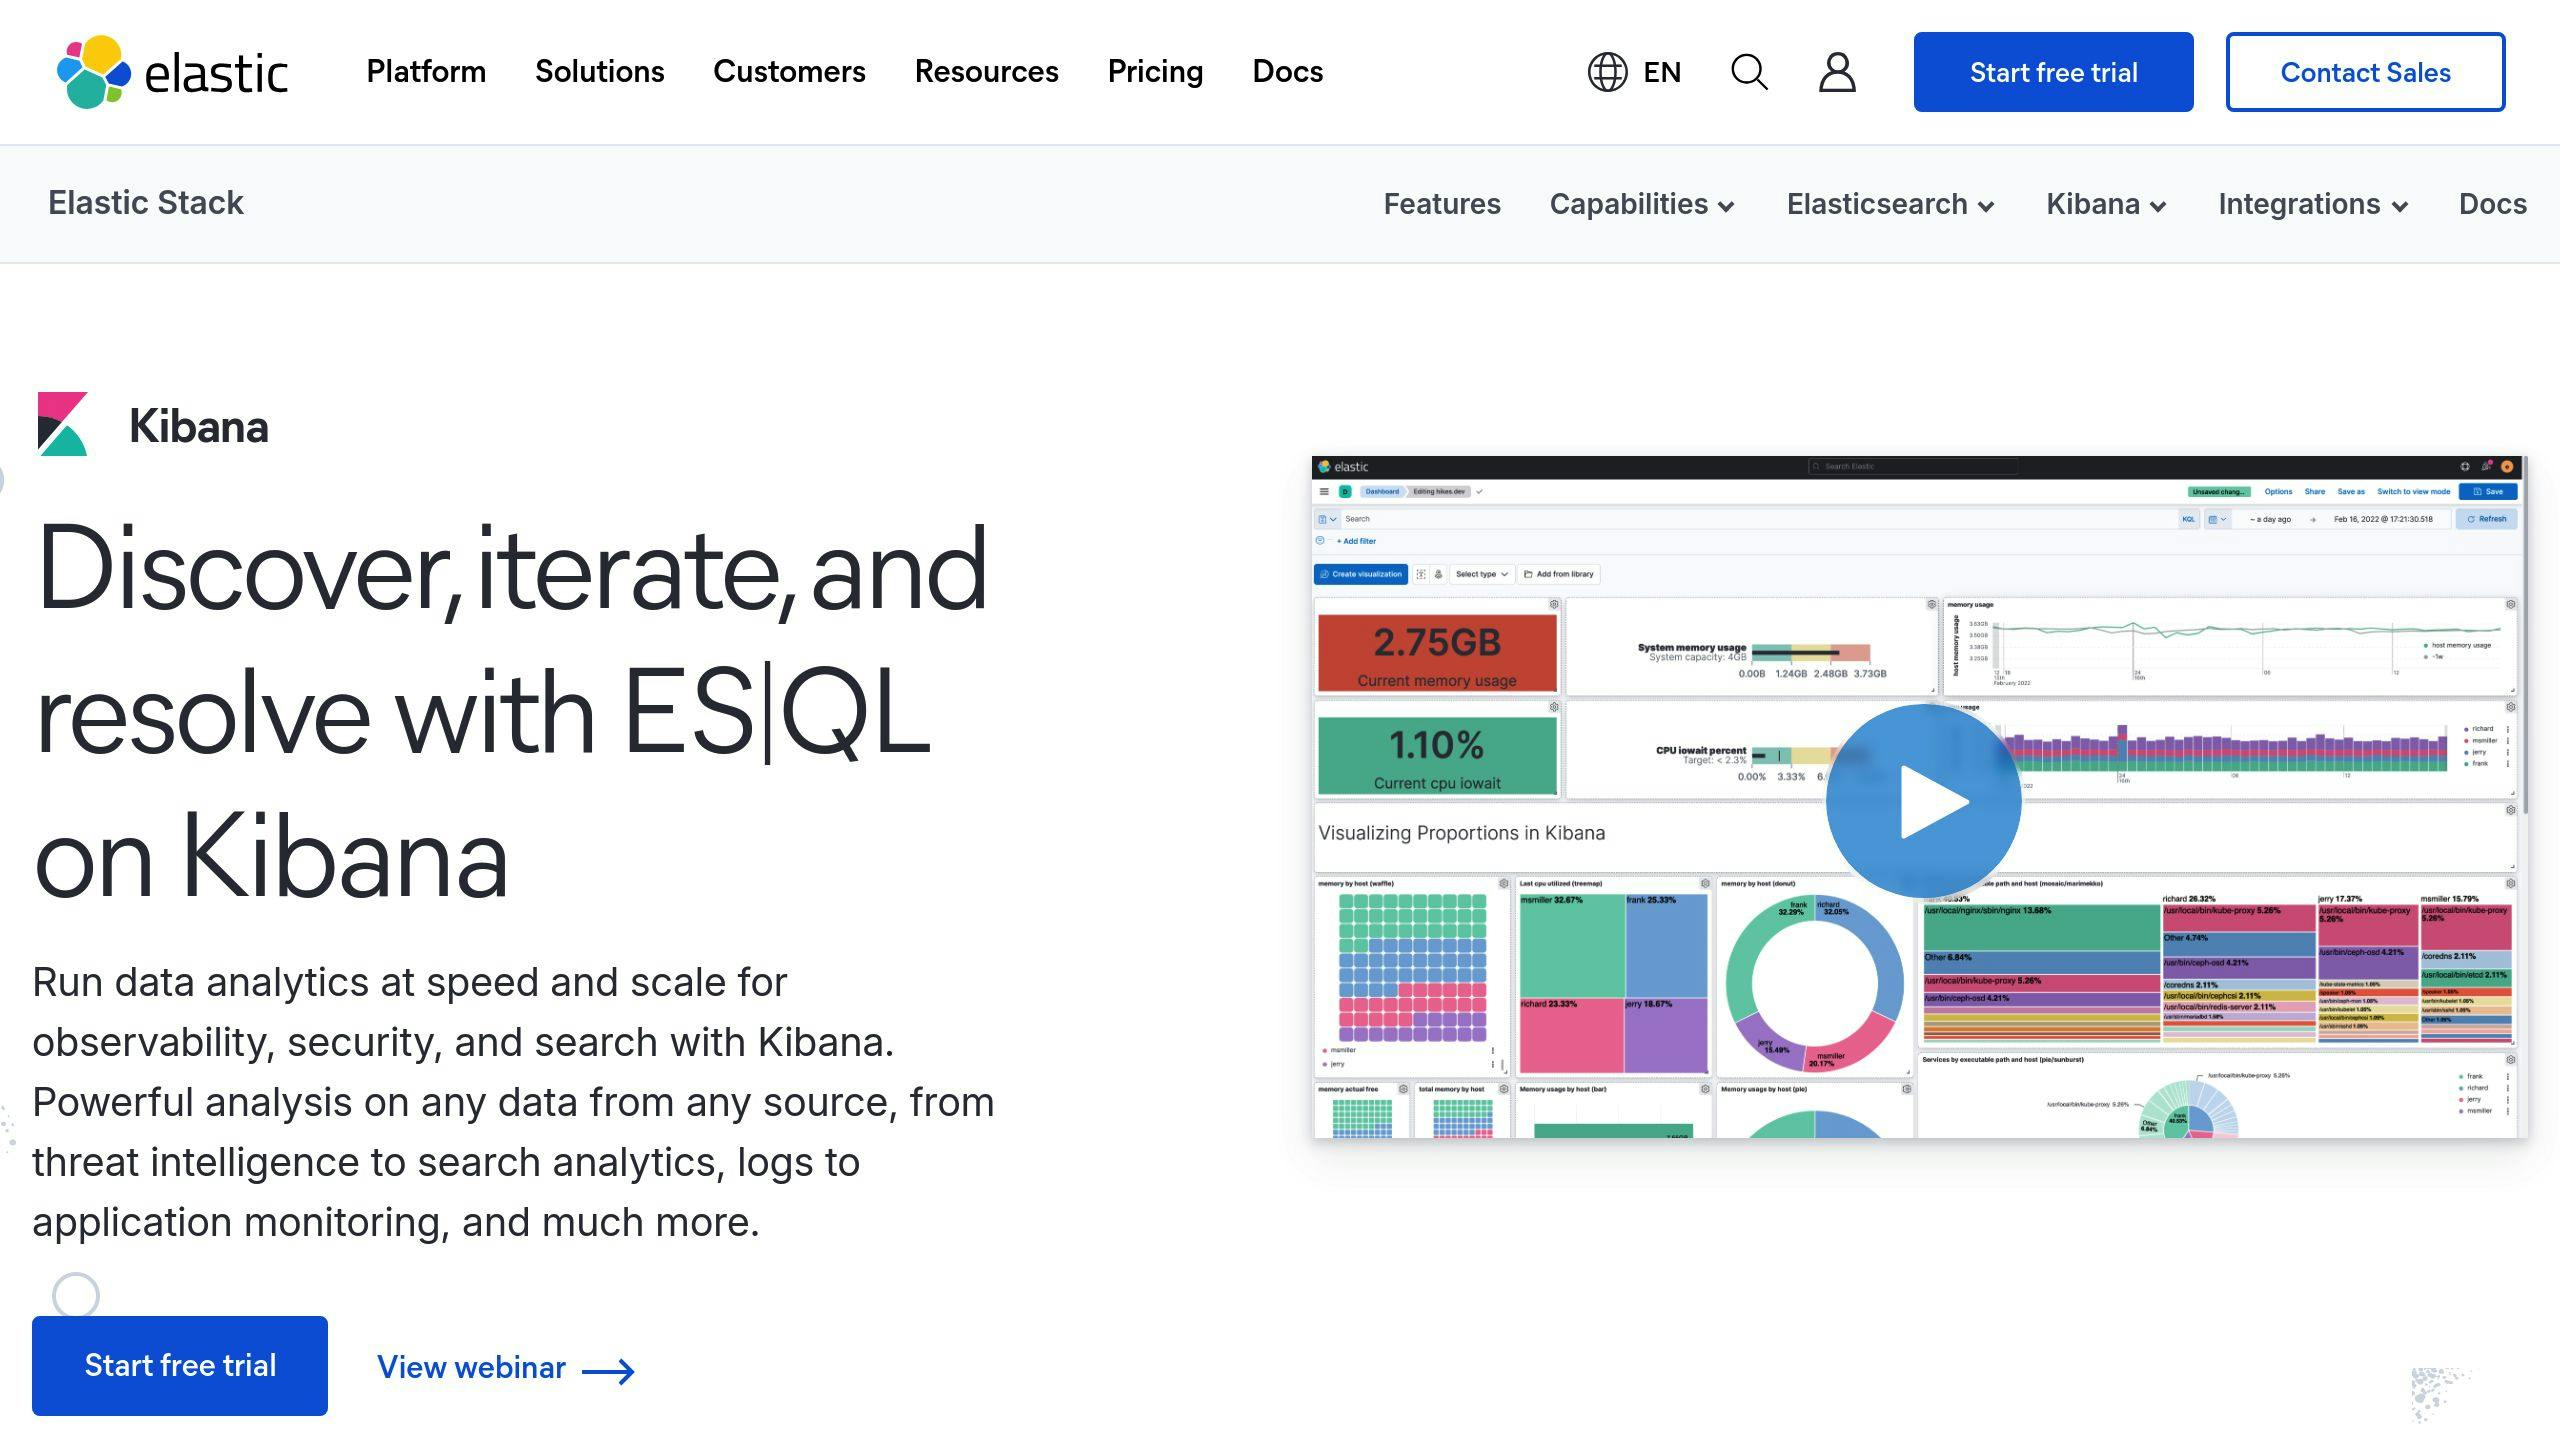
- Kibana: Visualizes anomalies and provides tools like dashboards and anomaly explorers.
Key features include machine learning algorithms like Random Cut Forest (RCF) for time-series data, one-click anomaly detection, and customizable rules to reduce false positives. This makes the ELK Stack a strong choice for real-time monitoring and proactive issue resolution.
Quick Setup Overview:
- Configure Elasticsearch for anomaly detection jobs.
- Use Logstash to process and prepare data.
- Visualize and manage anomalies in Kibana.
For effective monitoring:
- Tune parameters like bucket span and look-back windows.
- Set up alerts based on severity levels.
- Use custom rules and calendars to improve precision.
The ELK Stack is a practical solution for detecting anomalies in complex systems, and integrating complementary tools like Eyer.ai can further enhance its capabilities.
Using Elastic Anomaly detection and log categorization for root cause analysis
Setting Up the ELK Stack for Anomaly Detection

Configuring Elasticsearch

Start by setting up Elasticsearch to handle your data. Create an index pattern that aligns with your data structure, ensuring smooth anomaly detection using its machine learning tools.
Here’s an example of setting up an anomaly detection job:
PUT _ml/anomaly_detectors/cpu_usage_monitoring
{
  "analysis_config": {
    "bucket_span": "15m",    // Time intervals for analysis
    "detectors": [
      {
        "function": "mean",
        "field_name": "cpu_usage",
        "detector_description": "CPU usage analysis"
      }
    ]
  },
  "data_description": {
    "time_field": "@timestamp"
  }
}
Using Logstash for Data Processing

Logstash works as a pipeline to convert raw data into a format that Elasticsearch can use effectively. Here's a breakdown of its processing stages:
| Processing Stage | Purpose | Configuration Example |
|---|---|---|
| Input | Collects data from sources | File, beats, or TCP inputs |
| Filter | Transforms and organizes data | Grok patterns for parsing logs |
| Output | Sends data to Elasticsearch | Elasticsearch output with index templates |
Once Logstash processes the data, it sends it to Elasticsearch for indexing and anomaly detection.
Setting Up Kibana for Visualization

After Elasticsearch is ready, Kibana becomes your go-to tool for managing and visualizing the data. Use Kibana's Machine Learning page to create and manage anomaly detection jobs. Tools like Anomaly Explorer offer a broad view of anomalies, while the Single Metric Viewer lets you dive into specific metrics.
You can also build dashboards that combine various visualizations to monitor anomalies in one place. This approach helps you quickly spot trends and resolve issues efficiently [1][2].
sbb-itb-9890dba
Tools and Methods for Anomaly Detection in ELK
Using Machine Learning in ELK
The ELK Stack incorporates machine learning to analyze time series data and automatically model normal behavior patterns. This allows it to spot unusual trends without needing manual thresholds. By studying historical data, the system establishes a baseline and flags deviations that might signal issues.
"Anomaly detection runs in and scales with Elasticsearch, and includes an intuitive UI on the Kibana Machine Learning page for creating anomaly detection jobs and understanding results." [1]
For multi-dimensional data, the ELK Stack uses Random Cut Forest (RCF), making it a solid choice for monitoring complex systems. Once machine learning is set up, you can create tailored anomaly detection jobs to meet your specific needs.
Setting Up Anomaly Detection Jobs
You can create anomaly detection jobs either through Kibana's interface or the Elasticsearch API. Here's an example configuration for monitoring unusual CPU usage patterns over 10-minute intervals:
PUT _ml/anomaly_detectors/system_metrics
{
  "analysis_config": {
    "bucket_span": "10m",
    "detectors": [
      {
        "function": "high_mean",
        "field_name": "system.cpu.total.pct",
        "detector_description": "Unusual CPU usage patterns"
      }
    ]
  },
  "data_description": {
    "time_field": "@timestamp"
  }
}
Here’s a breakdown of the key components in an anomaly detection job:
| Component | Purpose | Example Configuration |
|---|---|---|
| Bucket Span | Time interval for analysis | 10m, 1h, or 1d |
| Detector Function | Type of analysis to perform | mean, sum, count, high_mean |
| Field Name | Metric to analyze | cpu.usage, memory.free |
| Time Field | Timestamp field for time series | @timestamp |
Once the basic job is configured, you can fine-tune it further using custom rules and calendars.
Customizing Rules and Calendars
Custom rules let you refine the conditions for anomaly detection, while calendars allow you to exclude predictable events, like scheduled maintenance, to reduce false positives. Together, these tools enhance the accuracy of your monitoring setup.
Kibana offers tools like Anomaly Explorer and Single Metric Viewer to validate anomalies and adjust detection settings. These visual tools make it easier to interpret results and improve detection precision [1][2].
Best Practices for Monitoring with the ELK Stack
Analyzing Time Series Data
Effective time series analysis is essential for gaining insights using the ELK Stack. To enhance accuracy, ensure these key parameters are properly configured:
| Parameter | Description | Recommended Setting |
|---|---|---|
| Bucket Span | Time window for analysis | Match your data collection interval |
| Look-back Window | Historical data period | At least 20x the bucket span |
| Model Memory Limit | Resources allocated | Adjust based on data cardinality |
Finding Root Causes and Reducing False Positives
Kibana's Anomaly Explorer and Single Metric Viewer are powerful tools for digging into root causes. To minimize false positives and improve precision, use features like custom calendars, detector rules, and annotations. These tools add context to detected anomalies, making it easier to investigate and resolve issues efficiently.
Setting Up Alerts and Automation
Set up alerts that align with severity levels to ensure the right response for each anomaly. Use automated actions for critical issues and manual reviews for less urgent ones. The ELK Stack's alerting features integrate well with existing automation tools, creating a seamless response system.
| Severity Level | Alert Type | Response Action |
|---|---|---|
| Critical | Immediate notification | Trigger automated remediation |
| High | Priority alert | Manual investigation required |
| Medium | Digest summary | Regular review and analysis |
| Low | Logging only | Periodic pattern analysis |
Elasticsearch's Random Cut Forest (RCF) algorithm is particularly useful for monitoring complex, multi-dimensional data streams [3]. Combining alerts with automation ensures more proactive monitoring and lays the groundwork for advanced anomaly detection processes.
Conclusion and Next Steps
Key Takeaways
The ELK Stack, enhanced with Random Cut Forest (RCF) and machine learning, provides powerful tools for detecting anomalies in multi-dimensional data. Its mix of programmatic APIs and user-friendly tools makes it easier to set up and manage detection tasks, making complex data analysis more accessible.
Trends and Challenges in Anomaly Detection
Anomaly detection is shifting toward real-time monitoring, which is critical for keeping systems running smoothly. However, organizations must address several challenges:
| Challenge | Suggested Approach |
|---|---|
| Managing Large Data Sets | Use distributed architectures |
| Reducing False Positives | Refine machine learning models |
| Real-Time Monitoring | Optimize ELK Stack settings |
"Anomaly detection plays a pivotal role in uncovering unusual patterns within data that could signify critical issues like fraud, network intrusions, or system failures." - GeekyAnts Blog [2]
While the ELK Stack is a strong contender in this space, pairing it with additional tools can further improve detection accuracy and efficiency.
Exploring Eyer.ai as a Complementary Tool

Eyer.ai is a no-code platform designed for automated anomaly detection. It stands out with its proactive alerting and root cause analysis features. Its API-driven setup is ideal for teams looking for quick deployment without heavy customization. For those already using the ELK Stack, Eyer.ai can act as a valuable addition, especially when speed and simplicity are top priorities.
Related posts
- Unveiling the Power of Anomaly Detection in the ELK Stack: A Comprehensive Guide
- Mastering Anomaly Detection with the ELK Stack: Techniques and Best Practices
- Enhancing Your ELK Stack with Anomaly Detection: Strategies for Success
- The Role of Anomaly Detection in the ELK Stack: Transforming Data Insights


