Azure's automated performance monitoring helps you keep your systems running smoothly. Here's what you need to know:
- Quick setup: Enable Azure Monitor in the portal
- Key benefits: Early issue detection, real-time alerts, better resource management
- Essential tools: Azure Monitor, Application Insights, Container Insights, VM Insights
- Custom dashboards: Create personalized views of your metrics
- Proactive monitoring: Use AI to predict issues before they occur
| Feature | Description |
|---|---|
| Data collection | Gather metrics and logs from Azure resources |
| Alerts | Set up notifications for unusual activity or errors |
| Auto-scaling | Adjust resources based on demand |
| Integration | Connect with Azure Automation, Logic Apps, and Security Center |
To get started:
- Set up Azure Monitor
- Choose metrics to track
- Create alerts
- Build custom dashboards
- Configure proactive monitoring
This guide covers setup, troubleshooting, and advanced techniques to help you master Azure performance monitoring.
Related video from YouTube
What You Need to Start
To begin automated performance monitoring in Azure, you'll need these basics:
Azure Account Requirements
You must have an Azure account. If you don't, sign up for a free one on the Azure website. This gives you access to the Azure portal for setting up monitoring.
Basic Azure Knowledge
It helps to know some Azure basics. Here's what you should be familiar with:
| Azure Concept | Why It's Important |
|---|---|
| Virtual machines | Core computing resources |
| Storage | Data management and access |
| Networking | Connects your Azure resources |
Understanding these will help you set up your monitoring effectively.
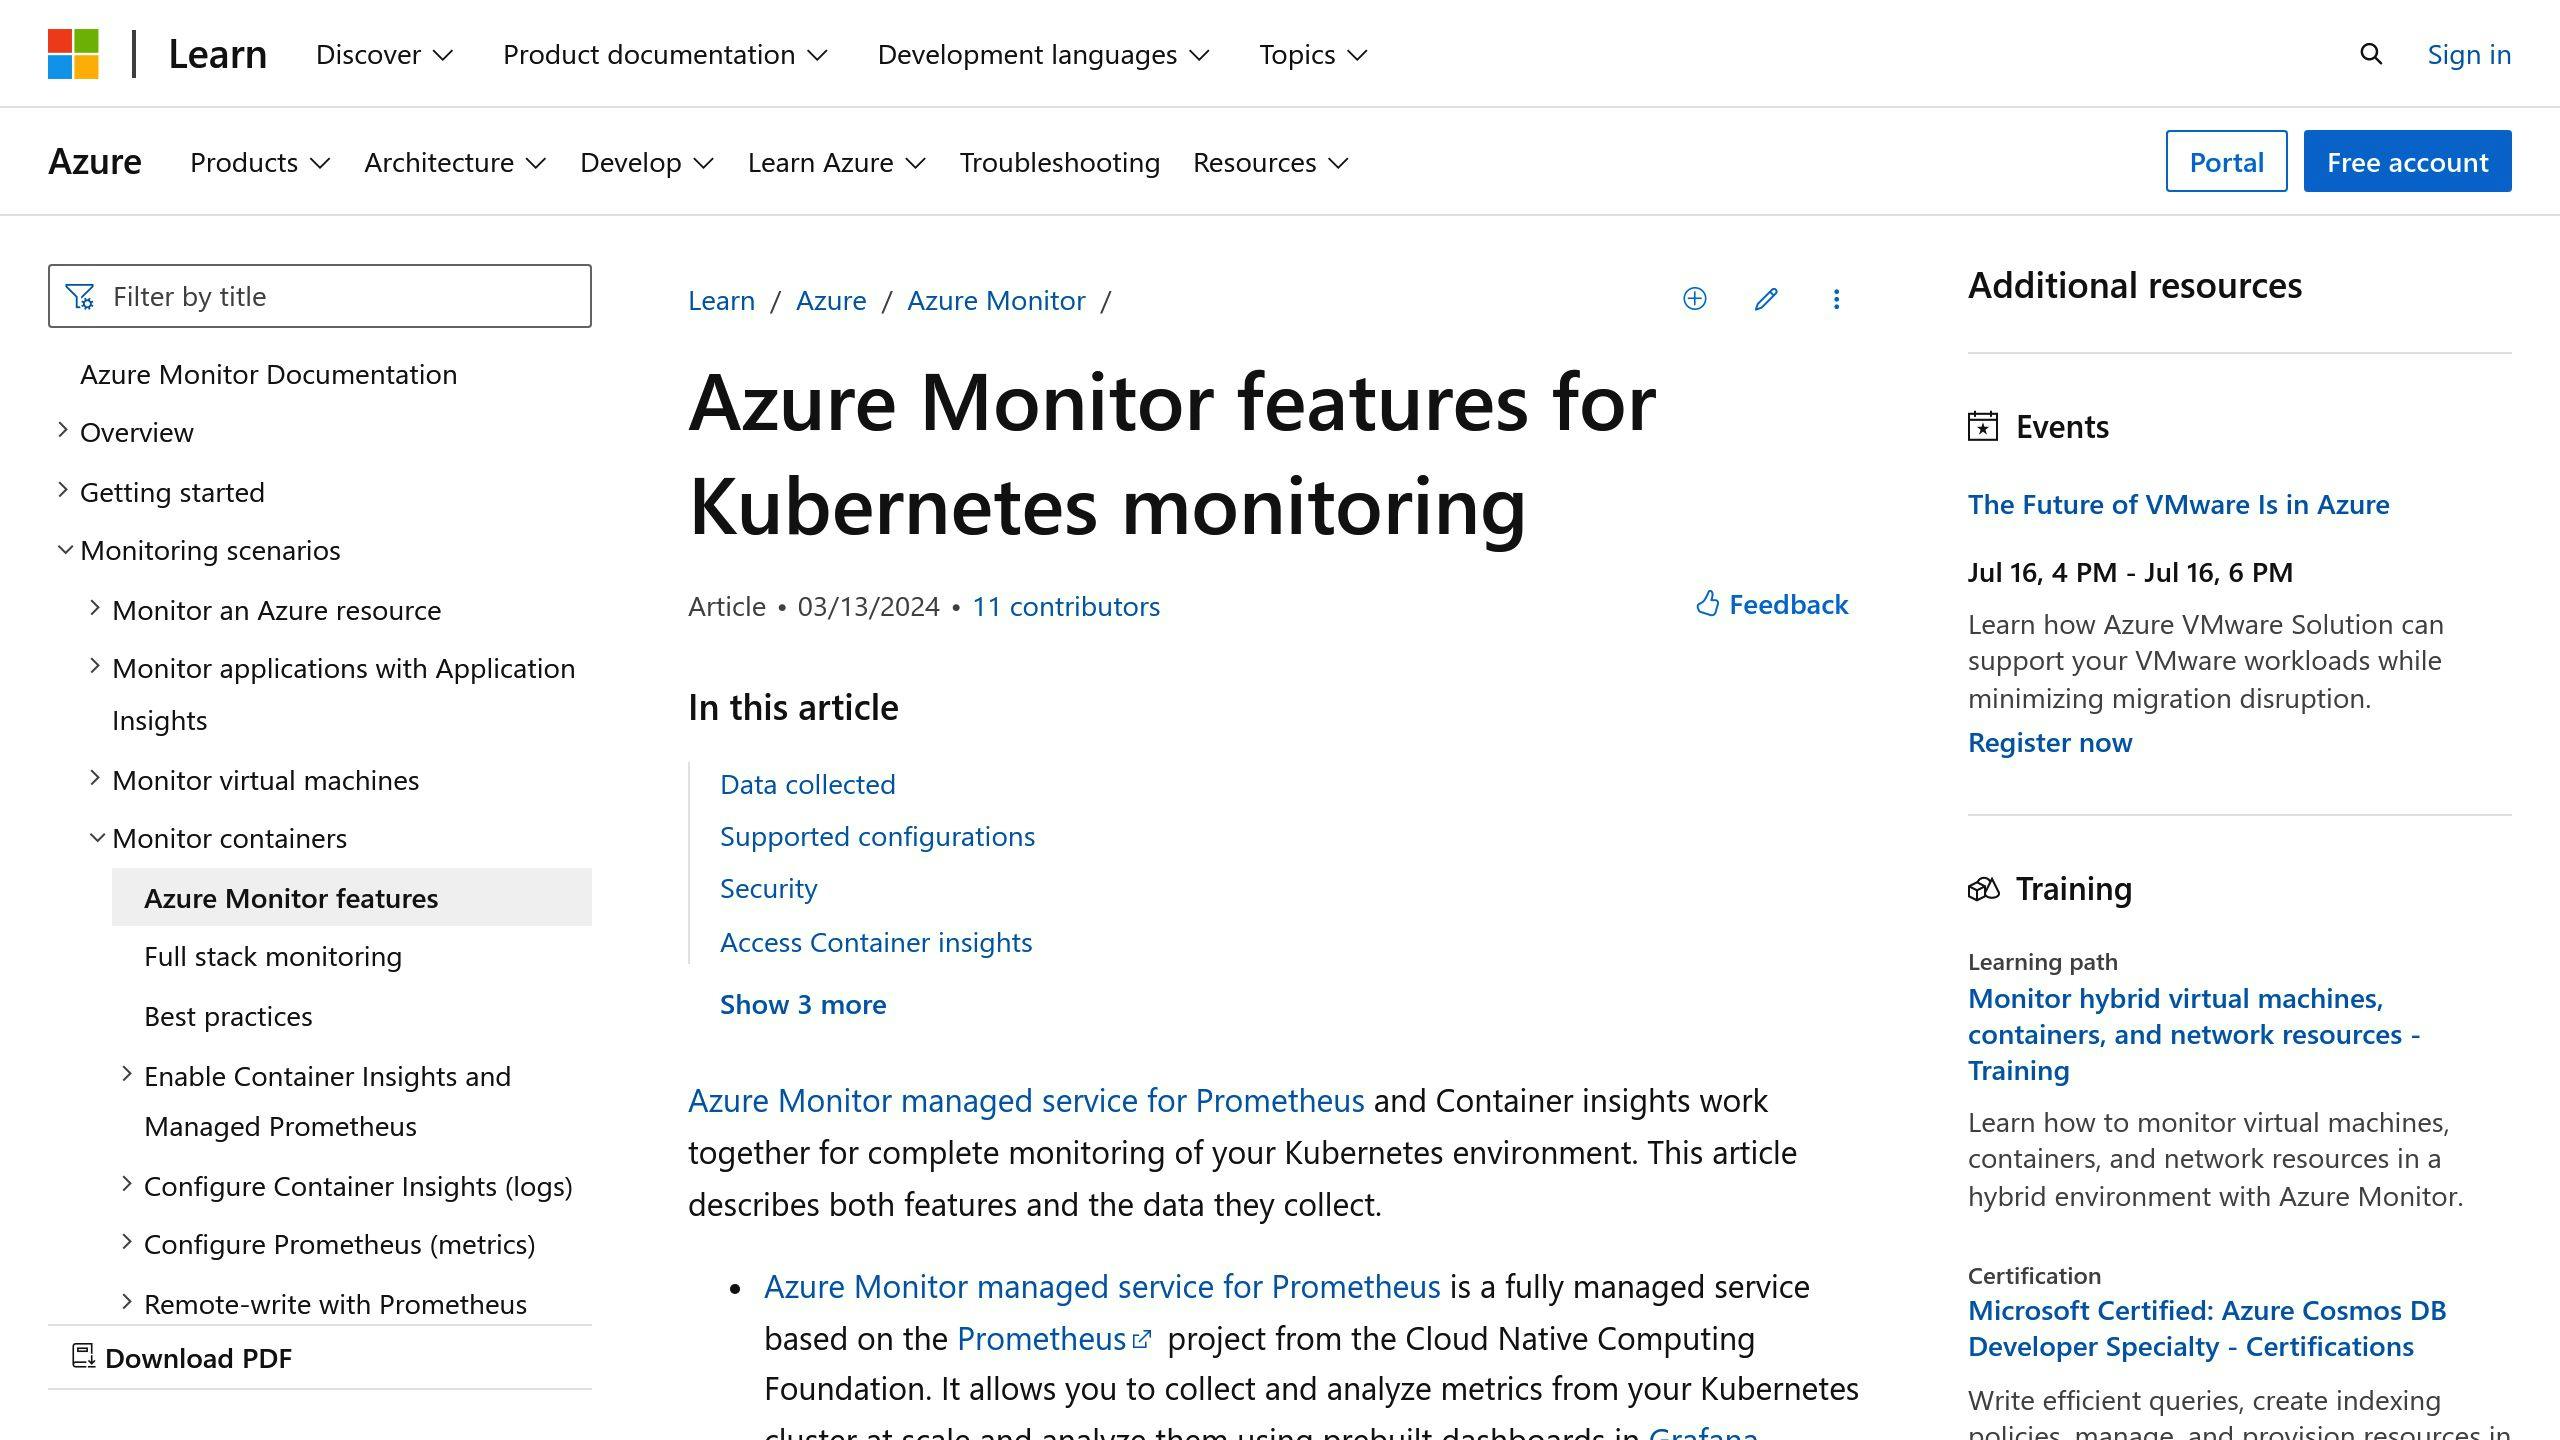
Understanding Azure Monitor

Azure Monitor is key for automated performance monitoring. It:
- Collects data from your Azure resources
- Analyzes this data
- Provides insights on performance and health
To use automated monitoring well, you need to know how to:
- Set up Azure Monitor
- Configure it for your needs
Setting Up Azure Monitor
Turning On Azure Monitor
To start using Azure Monitor:
- Log in to the Azure portal
- Go to Monitor
- Click Overview
- Select Enable Azure Monitor
Setting Up Data Collection
To gather information from your Azure resources:
- In the Azure portal, go to Monitor
- Click Metrics
- Pick the resources you want to track
- Choose which metrics to collect
- For logs, click Logs and follow similar steps
You can also make rules about what data to collect and where to send it.
Creating Workspaces
Workspaces help organize your monitoring data. To make one:
- In the Azure portal, go to Monitor
- Click Workspaces
- Select Create a workspace
- Name your workspace and choose its location
- Pick which resources to link to your workspace
| Workspace Benefits | Description |
|---|---|
| Data organization | Keeps monitoring information tidy |
| Easy analysis | Makes it simpler to look at your data |
| Better visualization | Helps you see patterns and trends |
Setting Up Automated Monitoring
Picking Metrics and Logs
To set up automated monitoring, choose which metrics and logs to collect from your Azure resources. Here's a quick guide:
| Type | Description | Examples |
|---|---|---|
| Metrics | Numbers that show how your resources are doing | CPU usage, response times |
| Logs | Detailed information about events | Errors, security incidents |
Pick the metrics and logs that matter most for your resources and goals. For a virtual machine, you might want to track:
- CPU usage
- Memory usage
- Disk usage
- System events
- Security events
- Application errors
Creating Automated Alerts
After choosing your metrics and logs, set up alerts to tell you when something's wrong. Here's how:
- Go to the Azure portal
- Click Monitor
- Select Alerts
- Click New alert rule
- Choose what to monitor
- Set when the alert should happen
- Pick how you want to be told (like email or notification)
Using Dynamic Thresholds
Dynamic thresholds change based on how your resources usually work. This means you don't have to set fixed numbers yourself. To use them:
- Go to the Azure portal
- Click Monitor
- Select Metrics
- Pick the metric you want to watch
- Click New alert rule
- Choose the dynamic threshold option
Azure Monitor will then set the threshold based on your resource's past data.
Using Azure Monitor Insights
Azure Monitor Insights helps you keep an eye on how well your Azure resources are working. Let's look at three main types: Application Insights, Container Insights, and VM Insights.
Application Insights Basics

Application Insights watches over your web apps. It tells you:
| What it tracks | Why it's useful |
|---|---|
| How many people use your app | Helps you plan for busy times |
| How fast your app responds | Shows if your app is too slow |
| If your app has errors | Helps you fix problems quickly |
To start using Application Insights:
- Make an Application Insights resource in Azure
- Turn it on for your Azure App Service
- Look at your app's info in the Azure portal
Container Insights Overview
Container Insights keeps track of apps that run in containers. It helps you:
| Feature | Benefit |
|---|---|
| Watch container health | Spot problems early |
| Collect container logs | Find out why things went wrong |
| See how containers are doing | Make your apps work better |
To use Container Insights:
- Go to the Azure portal
- Pick your container resource
- Click "Insights" on the left side
VM Insights Setup

VM Insights watches your Azure virtual machines. It helps you:
| What it does | How it helps |
|---|---|
| Checks VM health | Keeps your VMs running well |
| Gathers VM logs | Helps you solve problems |
| Shows VM performance | Lets you see how your VMs are working |
To set up VM Insights:
- Open the Azure portal
- Choose your virtual machine
- Click "Insights" on the left
- Follow the steps to turn on VM Insights
Making Custom Dashboards
Custom dashboards in Azure Monitor help you keep an eye on your Azure resources. A good dashboard lets you spot problems quickly and see how well things are working.
Dashboard Design Tips
When making your dashboard:
| Tip | Why it's helpful |
|---|---|
| Group similar tiles | Makes it easier to understand your data |
| Use clear titles | Helps you find what you need quickly |
| Pick the right size | Keeps your dashboard neat and easy to read |
Adding Key Performance Indicators
Key Performance Indicators (KPIs) show how well your Azure resources are doing. When adding KPIs:
- Pick metrics that matter to your business
- Use both metrics and logs to get a full picture
Automating Dashboard Updates
Keep your dashboard up-to-date without extra work:
1. Save your dashboard as code
This lets you track changes over time.
2. Set up automatic updates
Use Azure Monitor to update your dashboard on a schedule.
sbb-itb-9890dba
Setting Up Proactive Monitoring
This section explains how to set up monitoring that spots issues before they become big problems.
Creating Predictive Alerts
Predictive alerts use smart computer programs to find patterns in your data. They can warn you about possible problems. Here's how to set them up:
- Go to Azure Monitor
- Click Alerts
- Choose New alert rule
- Pick Predictive alert
- Select the data you want to check
- Set up when you want to be warned and how
These alerts help you fix issues before they cause trouble.
Using AI to Spot Unusual Patterns
AI can find odd patterns in your data that might mean something's wrong. To use this:
- Go to Azure Monitor
- Click Anomaly detection
- Pick the data you want to check
- Choose how sensitive you want the checks to be
- Set up how you want to be told about odd patterns
This helps you find and fix strange things quickly.
Setting Up Auto-Scaling
Auto-scaling changes how much of Azure's computer power your services use based on how busy they are. Here's how to set it up:
- Go to Azure Monitor
- Click Auto-scaling
- Pick the service you want to auto-scale
- Set rules for when to use more or less computer power
| Auto-scaling Benefits | Description |
|---|---|
| Save money | Use less when it's not busy |
| Handle busy times | Use more when lots of people are using your service |
| Always work well | Keep your services running smoothly |
Auto-scaling helps your Azure services work well all the time, even when they're very busy.
Connecting with Other Azure Tools
Using Azure Automation

Azure Automation helps you do tasks automatically in Azure. When you use it with Azure Monitor, you can:
- Set up tasks that happen when Azure Monitor finds a problem
- Fix issues without needing to do it yourself
To use Azure Automation with Azure Monitor:
- Make an Azure Automation account
- Link it to Azure Monitor
- Set up Azure Monitor to tell Azure Automation about problems
- Make a plan (called a runbook) in Azure Automation to fix the problem
This helps your system work better on its own.
Working with Azure Logic Apps
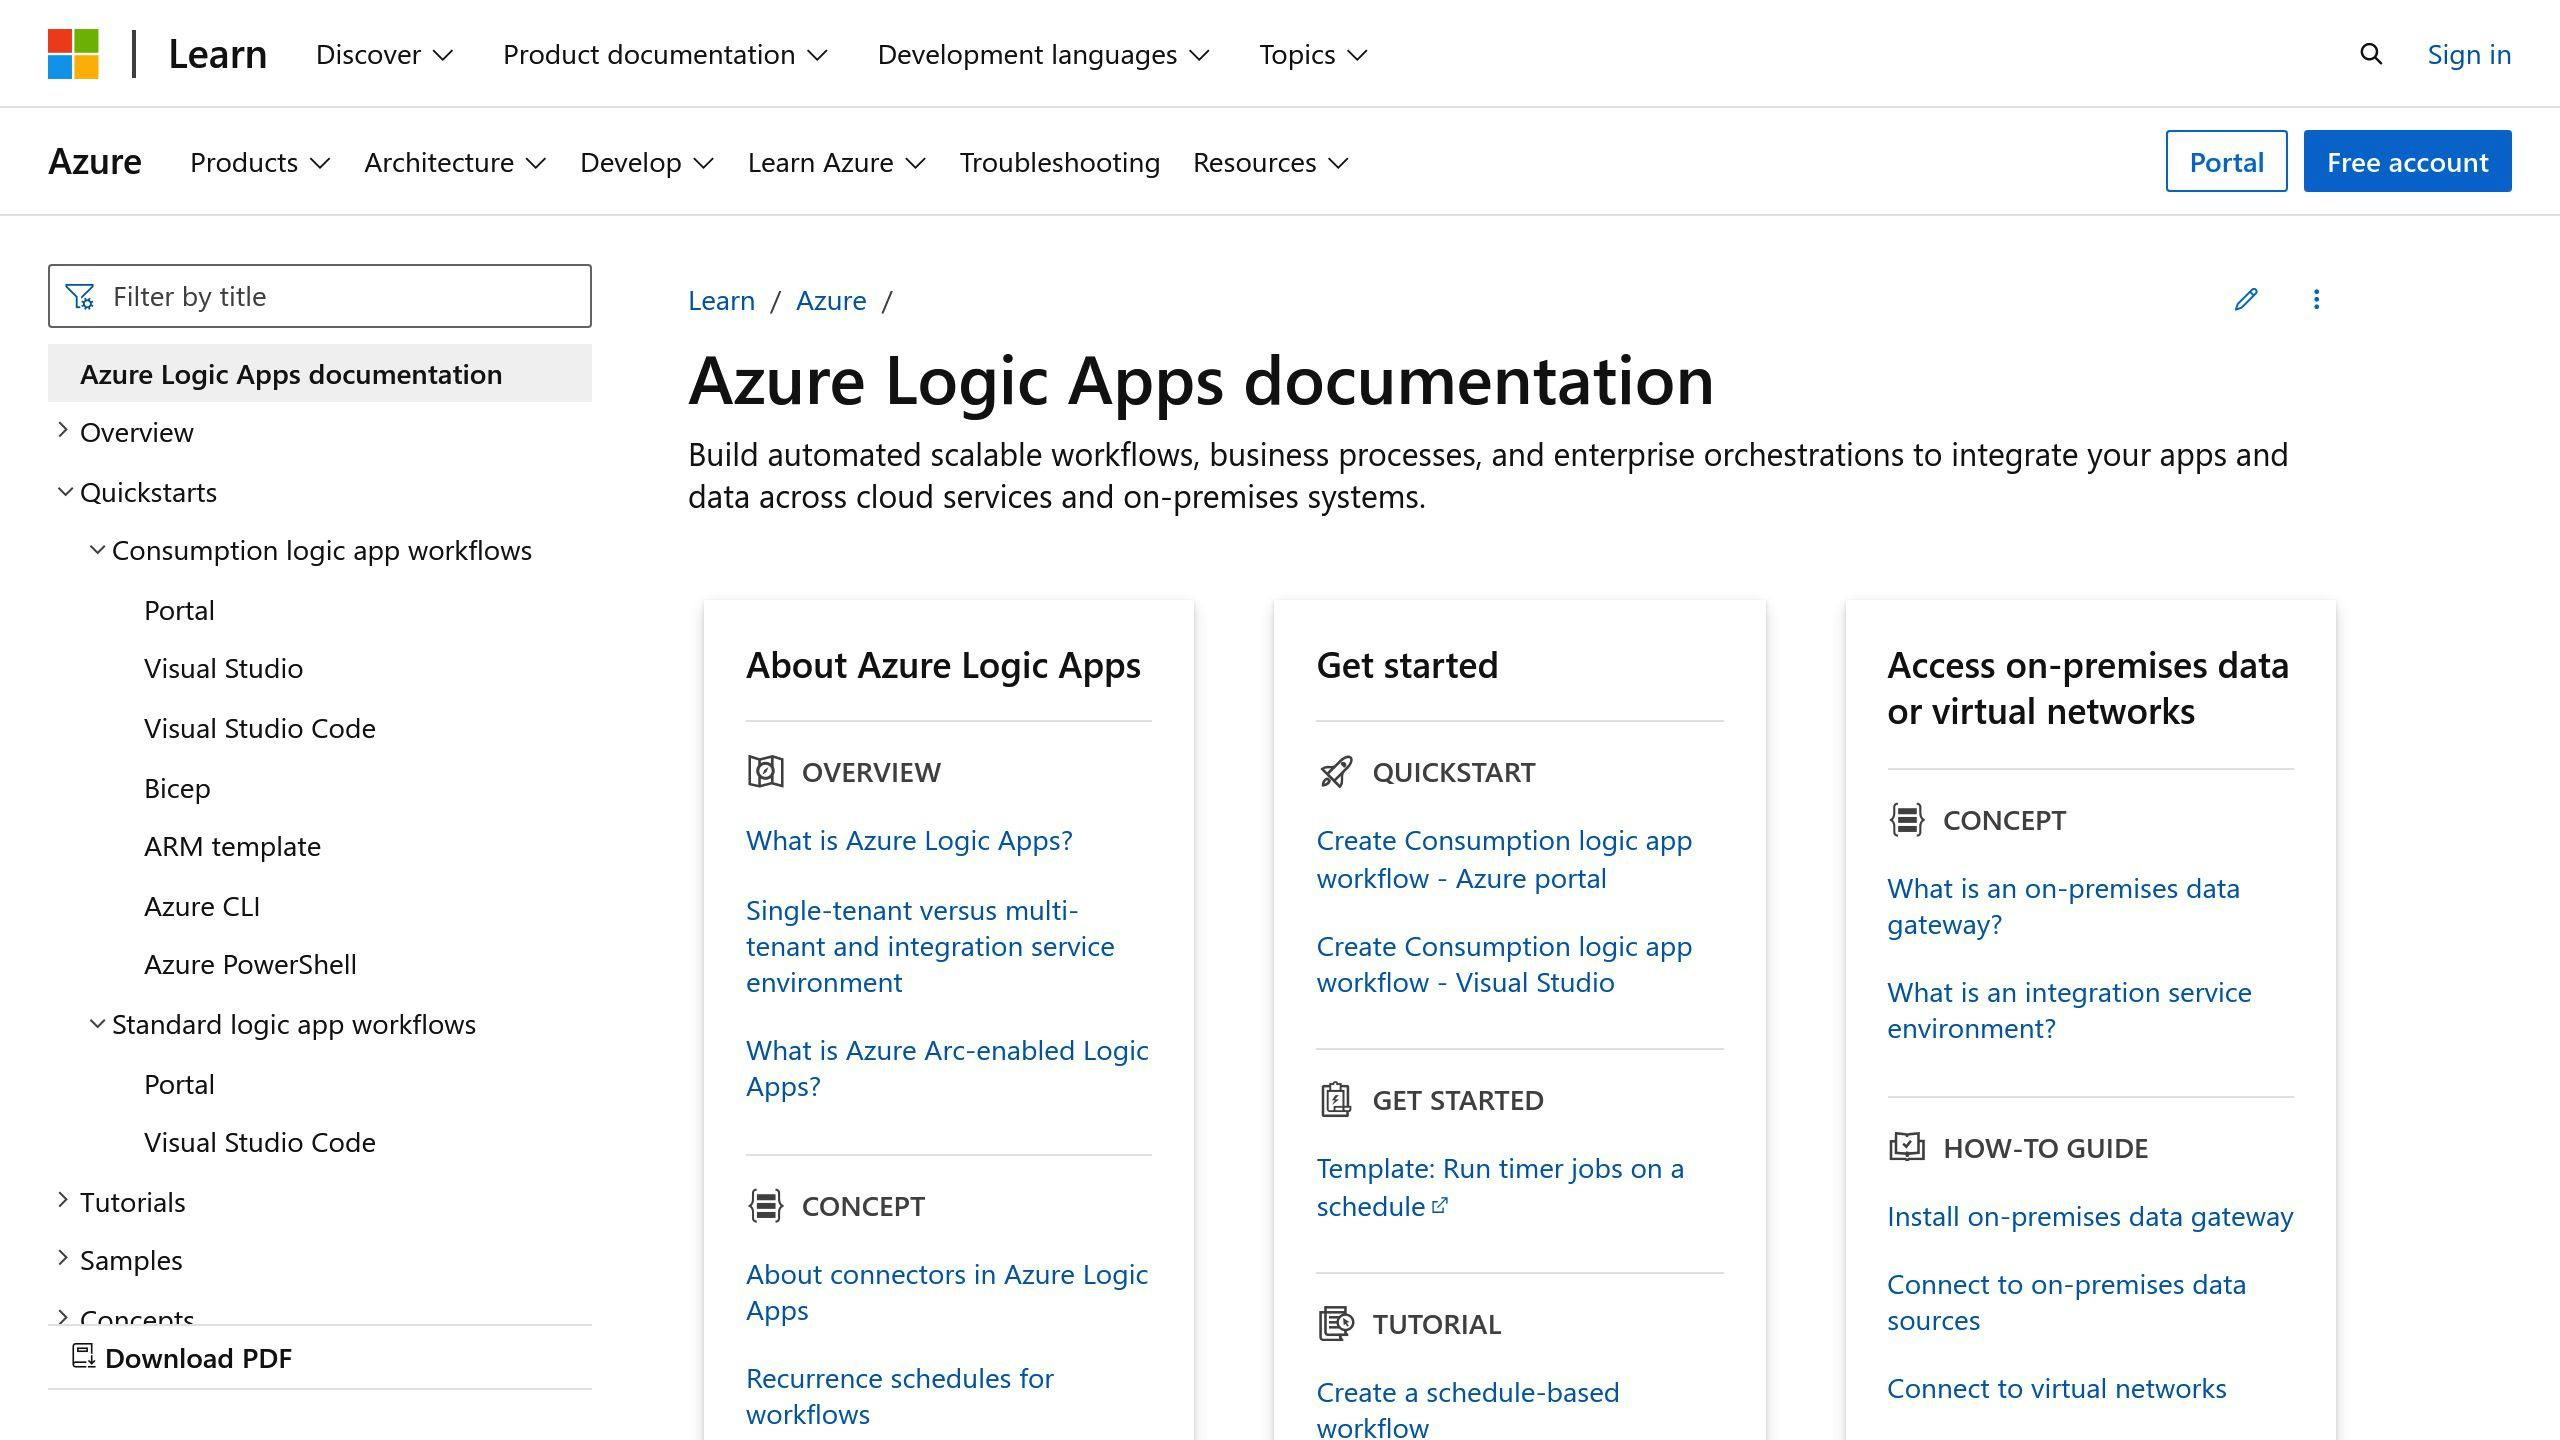
Azure Logic Apps lets you make your own plans for what should happen in Azure. When you use it with Azure Monitor, you can:
- Make your own steps for what to do when there's a problem
- Send messages or start other tasks when something happens
To use Azure Logic Apps with Azure Monitor:
- Make an Azure Logic Apps account
- Link it to Azure Monitor
- Set up Azure Monitor to tell Azure Logic Apps about problems
- Make a plan in Azure Logic Apps for what to do
This helps you make your own ways to fix problems.
Linking to Azure Security Center

Azure Security Center helps keep your Azure setup safe. When you use it with Azure Monitor, you can:
- Watch for safety problems along with other issues
- Get help fixing safety problems
To use Azure Security Center with Azure Monitor:
- Turn on Azure Security Center
- Link it to Azure Monitor
- Set up Azure Monitor to tell Azure Security Center about safety problems
- Use Azure Security Center to fix safety issues
This helps you keep your Azure setup safe along with watching how it's working.
| Tool | What it does | How it helps |
|---|---|---|
| Azure Automation | Does tasks for you | Fixes problems without you doing it |
| Azure Logic Apps | Makes custom plans | Lets you choose what happens when there's a problem |
| Azure Security Center | Keeps things safe | Helps fix safety issues |
Tips for Better Automated Monitoring
Improving Alert Settings
To get the most out of automated monitoring, set up your alerts well:
- Set the right alert levels
- Make clear rules for when alerts happen
- Leave out alerts you don't need
This helps you focus on the alerts that matter most.
To set good alert levels:
- Find out what's normal for your resources
- Use this to set your alert levels
- This helps you tell the difference between normal changes and real problems
Reducing Alert Overload
Getting too many alerts can be a problem. Here's how to fix it:
| Method | How it helps |
|---|---|
| Group similar alerts | Fewer messages to check |
| Stop repeat alerts for known issues | Less noise from things you already know about |
| Mark alerts as critical or not critical | Deal with big problems first |
Monitoring Across Different Environments
You can watch your resources in different places, like:
- Where you test new things
- Where you try out your work
- Where your real work happens
This helps you find problems early and make sure everything works well.
To do this:
- Make different workspaces in Azure Monitor for each place
- This lets you watch each place on its own
- You can also compare how things work in different places
Fixing Common Problems
When setting up automated performance monitoring in Azure, you might run into some issues. Here's how to fix them:
Data Collection Issues
If you can't get data from your Azure resources:
| Check This | Do This |
|---|---|
| Azure Monitor setup | Make sure it's turned on for your resources |
| Data collection agent | Check if it's installed and working |
| Azure Monitor logs | Look for errors about data collection |
Alert Setup Problems
If your alerts aren't working right:
| Problem Area | What to Do |
|---|---|
| Alert settings | Make sure they're set up correctly |
| Alert rules | Check if they're defined and working |
| Alert notifications | See if they're being sent |
Handling False Alerts
False alerts can be annoying. Here's how to cut them down:
| Method | How It Helps |
|---|---|
| Check alerts carefully | Fewer false alarms |
| Use smart computer checks | Find and remove fake alerts |
| Update alert settings often | Keep alerts accurate |
Advanced Monitoring Methods
Creating Custom Metrics
Custom metrics in Azure Monitor help you track specific things about your app or service. Here's what you need to know:
| Feature | Description |
|---|---|
| Purpose | Track unique performance measures |
| How to create | Use Azure Monitor SDK or REST API |
| Benefits | Get detailed insights, make better choices |
Example: You can make a custom metric to count orders per minute or check how fast your API responds.
Using Log Analytics
Log Analytics in Azure Monitor helps you look at log data from your apps and services. Here's what it does:
| Function | Description |
|---|---|
| Collect data | From Azure, on-site systems, and other services |
| Analyze | Find issues and spot patterns |
| Create alerts | Set up warnings based on log data |
To use Log Analytics well:
- Write custom queries to find specific patterns
- Set up alerts for important log events
Working with Azure Monitor API
The Azure Monitor API lets you connect with Azure Monitor through code. Here's what you can do:
| Task | Description |
|---|---|
| Get data | Pull monitoring info from Azure |
| Make custom metrics | Create your own tracking measures |
| Set up alerts | Program warnings for specific events |
Example uses:
- Build a custom dashboard with live data
- Connect Azure Monitor to other tools you use
Wrap-Up
Key Points Summary
This guide covered the main parts of setting up automated performance monitoring in Azure. We talked about:
| Topic | What We Covered |
|---|---|
| Benefits | Why automated monitoring helps |
| Setup | How to start using Azure Monitor |
| Dashboards | Making custom views of your data |
| Advanced methods | Using more complex monitoring tools |
By following these steps, you can make sure your Azure resources work well.
Keeping Your Monitoring Up-to-Date
To get the most from your automated monitoring:
- Check your setup often
- Make sure it fits what your business needs now
- Look for gaps in what you're watching
- Follow the rules your company and others set
- Change your monitoring based on new information
| Action | Why It Helps |
|---|---|
| Regular reviews | Keeps monitoring current |
| Check for gaps | Makes sure you're watching everything important |
| Update rules | Helps catch new types of problems |
By doing these things, you can:
- Find problems before they get big
- Make your Azure resources work better
FAQs
How do I monitor my Azure VM performance?
To keep an eye on how well your Azure VM is working, follow these steps:
- Open the Azure portal
- Click on Virtual Machines
- Pick the VM you want to check
- In the Monitoring area, click Insights
- Click the Performance tab
On this page, you'll see how your VM is doing. You can check things like:
| What to look at | What it tells you |
|---|---|
| CPU usage | How hard your VM is working |
| Memory usage | How much computer memory it's using |
| Disk usage | How much storage space it's using |
| Network usage | How much data is moving in and out |
You can also set up alerts to tell you if something's not right with your VM.
For a deeper look, use Azure Monitor. It helps you:
- Gather more info about your VM
- See patterns in how it's working
- Spot anything unusual
This way, you can fix problems and make your VM work better.