In today's fast-paced tech environment, Data Observability plays a crucial role in enhancing DevOps operations. It provides real-time insights into data health, movement, and reliability, allowing teams to preemptively address issues rather than reactively dealing with them. This guide dives into practical use cases of data observability within DevOps, illustrating its importance through case studies that cover enhancing application performance, streamlining deployment processes, and optimizing resource utilization. Here's a quick overview:
- Real-time Monitoring: Tracks data movement and health continuously.
- Early Problem Detection: Identifies and alerts on issues before they escalate.
- Improved Decision-Making: Offers detailed insights for smarter, data-driven decisions.
- Enhanced Collaboration: Brings teams together with shared data insights.
- Resource Optimization: Helps in efficient use of resources, saving time and money.
Whether you're looking to boost application performance, smooth out deployment processes, or make the most of your resources, data observability is key to achieving these objectives efficiently and effectively.
What is Data Observability?
Think of data observability as a super smart system that keeps an eye on the data your company uses all the time. It checks if the data is good, where it's coming from, if it's getting where it needs to go on time, and if there are any mistakes along the way. This helps teams make sure the data is reliable and can be used to make important decisions.
These smart systems, or data observability platforms, look at:
- Data quality - Is the data correct and complete?
- Data lineage - Where did the data come from and where is it going?
- Data latency - Are there any delays in using the data?
- Error rates - How often do data mistakes happen?
This info helps teams keep data in tip-top shape so it can do its job right.
Why is it Important in DevOps?
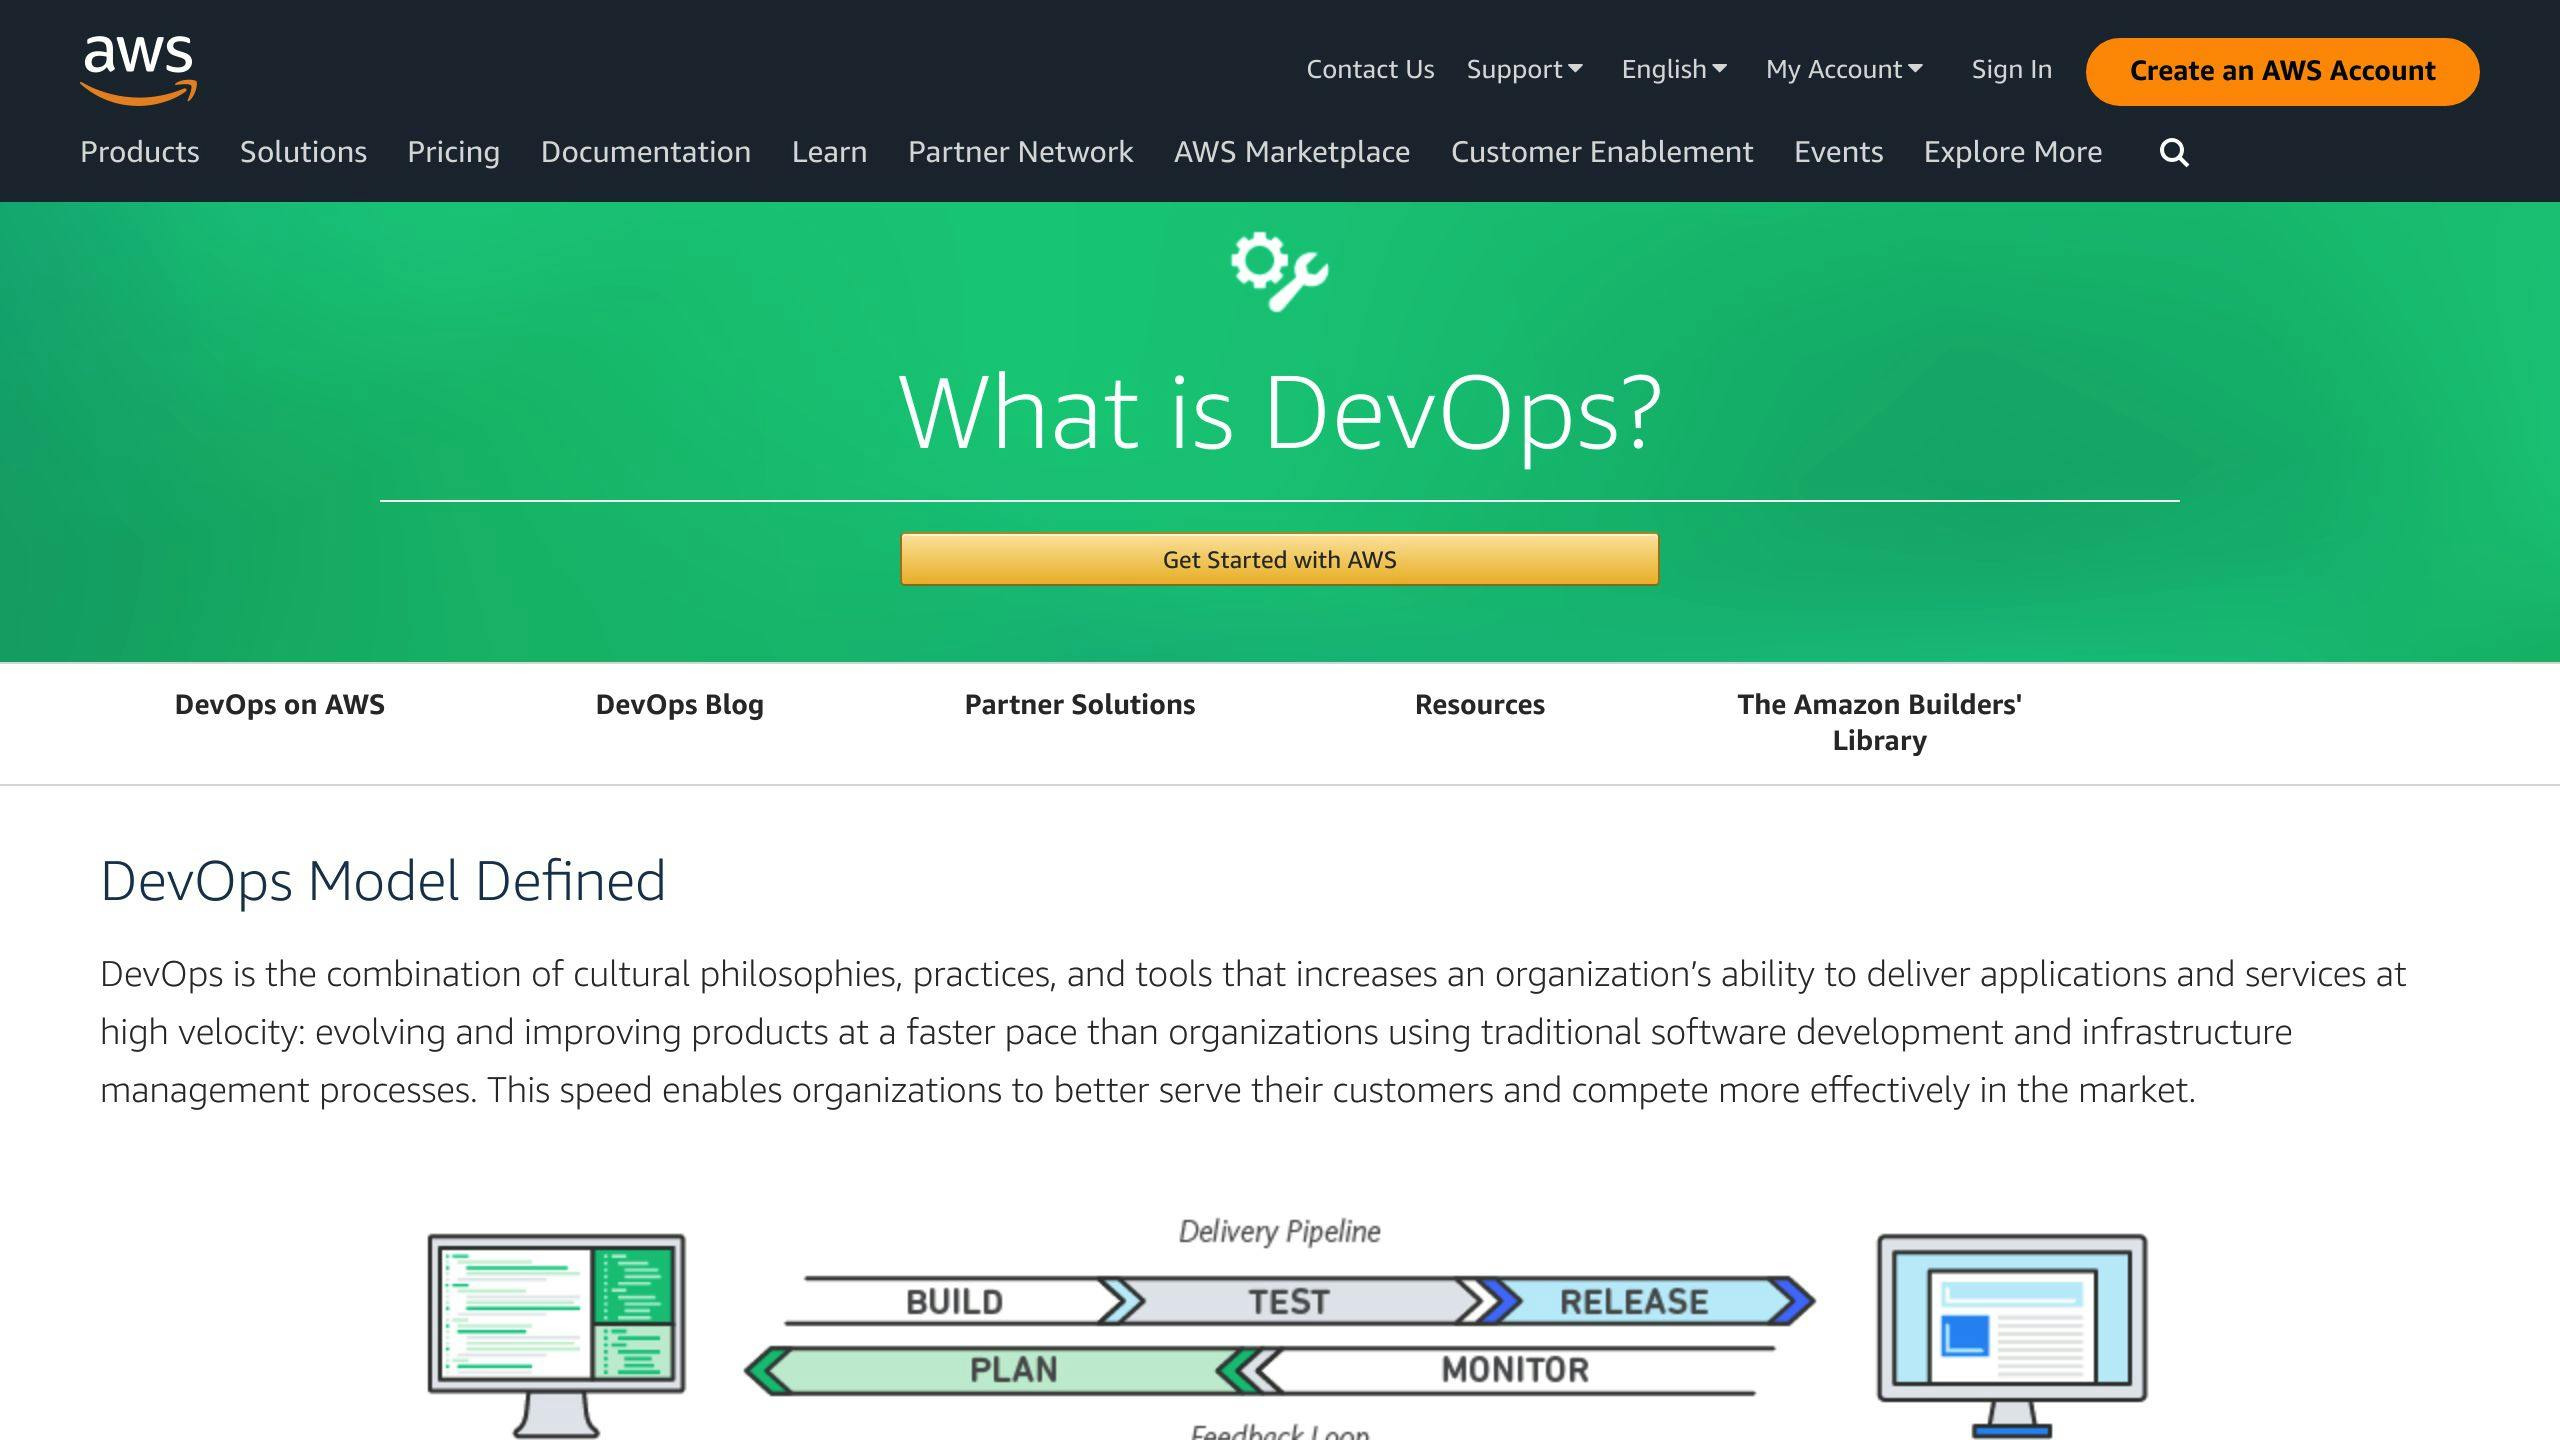
Data observability fits right into what DevOps teams do best - working together, automating stuff, keeping a close eye on things, and always trying to do better. It lets them see exactly what's happening with their systems so they can:
- Catch problems early: Spot weird data stuff before it causes bigger issues.
- Fix things fast: Use detailed info to quickly figure out what went wrong.
- Keep getting better: Find ways to make data cleaner and faster, matching what the business needs.
- Work together better: When everyone can see what's going on with the data, it's easier to make smart decisions together.
- Stay safe: Knowing more about the data helps predict and avoid risks.
In short, being able to watch over data helps DevOps teams move from just dealing with problems as they come up to stopping them before they start. This means they can work more smoothly, waste less time, and come up with cooler ideas.
Case Study 1: Enhancing Application Performance
Context
Many companies run into trouble with their applications not performing well or crashing often. This can lead to:
- Slow loading times, making users unhappy
- Frequent crashes or errors that interrupt business
- Trouble figuring out quickly why problems are happening
- Not being able to see the full picture of the application's health
Without a good way to watch and understand application data, teams can only react to problems instead of preventing them.
Implementation
To solve these issues, teams started using data observability tools. They did things like:
- Adding special tracking to their apps to keep an eye on important info like how fast pages load, how often errors happen, and overall system health
- Collecting and organizing log data from every part of their system in one place
- Making it possible to see how data moves through their whole setup
- Using smart monitoring for instant alerts, spotting unusual patterns, and getting smart suggestions
With these tools, teams got a complete view of how their applications work, from the user interface to databases and everything in between.
Outcomes
With better monitoring and the ability to see problems before they happen, teams saw big improvements:
- 60% quicker at finding and fixing performance problems
- 72% fewer issues that affected users
- 99.95% uptime for applications, even when lots of people were using them
- 30% smarter decisions on how to make their applications run better based on real data
By focusing on data, companies turned their unreliable applications into ones that work smoothly and are ready for anything. Data observability gives the detailed watchfulness needed for important online services today.
Case Study 2: Streamlining Deployment Processes
Context
A lot of companies have trouble with deployment - that's the process of getting new code live and working. The issues they face include:
- Deployments taking too long, sometimes hours or even days
- Not being able to see if new code changes are working well
- Hard time figuring out why deployments fail
- No way to check if everything's performing okay before making it live
These problems mean that getting new features out can be slow, and when things go wrong, it can upset customers because of downtime.
Implementation
To fix these issues, some smart teams started using tools like Grafana, which is a data observability platform. They did things like:
- Adding special monitoring to their software to keep an eye on code health
- Gathering all kinds of data (like logs and metrics) in one place
- Setting up checks to make sure everything's running smoothly before going live
- Linking all the data to see how new changes affect things
- Getting alerts when something's not right, to fix issues before they affect users
This gave developers a clear view of how their code changes were doing from start to finish, helping them make better decisions.
Outcomes
By focusing on data and making their deployment process smarter, teams saw great improvements:
- Deployments got 4 times faster because of better automation and catching problems early
- 68% fewer deployments failed because they could spot and fix issues sooner
- Less downtime between problems with their services
- Quicker fixes when things went wrong, reducing the impact on customers
- Better ways of working based on what the data showed them about where they could improve
By keeping a close eye on their deployments with the right tools, teams were able to get good code out faster and with fewer problems. They shifted from just dealing with issues as they came up to preventing them in the first place, all thanks to detailed data.
sbb-itb-4a5db88
Case Study 3: Optimizing Resource Utilization
Context
Lots of companies use more cloud services (like storage and computing power) than they actually need. This can lead to problems like:
- Spending too much money on things they don't use
- Finding it hard to figure out the exact amount of resources they need
- Not really knowing how much they're using or spending
- Poor planning that leads to not using resources wisely
Spending too much on unused services can take away money from other important projects and negatively affect profits.
Implementation
To deal with these issues, teams started using data observability tools to help them see:
- Detailed tracking of how much they're using and spending
- Smart alerts for when usage suddenly goes up or down
- Automatic suggestions on how to adjust resources to match what's actually needed
- Future planning tools to guess how much capacity they'll need later
- Spotting wasted resources to find and cut out what's not needed
By keeping a close eye on how resources are used, teams could make smart changes like:
- Adjusting resources to match what's really needed
- Changing capacity based on early warnings
- Cutting out waste by getting rid of unused resources
- Planning better to use resources more efficiently
Outcomes
Being able to see and understand how resources were used led to big savings:
- 42% less spending by using resources better
- 65% less extra capacity laying around
- 90% better matching of what's needed versus what's used
- Time saved in planning and managing how much to spend on cloud services
Using data observability tools made it easier to use resources wisely, saving money and making planning a lot simpler.
Key Takeaways
Data observability is super helpful for DevOps teams looking to do their best work. Let's break down the main points:
- Data observability lets teams see everything about how their apps are doing, from the user's screen to the data storage. This means they can watch things like how fast the app responds, if there are any errors, and much more as it happens.
- With clear info from data observability tools, teams can fix problems fast, make their systems better, and decide on changes based on solid facts. This approach helps them move from just fixing issues as they come up to getting ahead of them.
- Data observability helps everyone on the team get on the same page because they all look at the same info. This makes it easier for them to work together when something needs fixing.
- Catching weird stuff early with data observability means fewer big problems for customers and quicker fixes. Apps stay strong, and the team can think more about new ideas.
- Understanding how data moves and its quality helps teams plan better and use their resources smartly. This stops them from spending too much and makes sure they have just what they need.
- As things get more complicated, it's easy to miss risks. Data observability shines a light on hidden issues so teams can sort them out.
In today's world, where everyone wants to be the best, data observability helps DevOps teams keep their operations smooth and supports the business's goals. It's a key part of doing things better all the time.
Related Questions
What are the use cases of data observability?
Data observability helps teams keep an eye on their data systems to handle important tasks like:
- Planning how much computer and storage space is needed
- Keeping track of how well systems are running
- Making sure data is correct and catching any changes
- Managing how much resources are used to save money
- Taking care of how data is stored and used over time
These platforms make it easier for teams to spot and fix problems before they cause bigger issues.
What is observability in DevOps?
Observability in DevOps means using tools to watch and understand what's happening inside apps and systems. It helps teams:
- See how well things are working and what's going on
- Find and figure out problems
- Help with fixing and making things better
- Improve how systems are built and work over time
It's a big part of DevOps because it gives teams the info they need to keep making things better.
What are the 5 pillars of data observability?
The five main things to watch in data observability are:
- Data freshness: How new or up-to-date the data is
- Data volume: How much data is moving through
- Data schema: If the structure of the data changes
- Data quality: Making sure the data is correct and useful
- Data distribution: Understanding the spread of data values
By keeping an eye on these, teams can make sure their data is in good shape.
What are the 4 pillars of observability?
The four main things to watch for overall system health are:
- Metrics: Numbers that tell us how things are doing, like how fast a page loads
- Logs: Records of what the system or app has been doing
- Traces: Following a piece of data or request to see where it goes
- Metadata: Information about the data, like where it came from
Looking at these helps teams understand how their systems are doing and find ways to make them better.