Looking for Datadog alternatives? Here's a quick rundown of 5 top options:
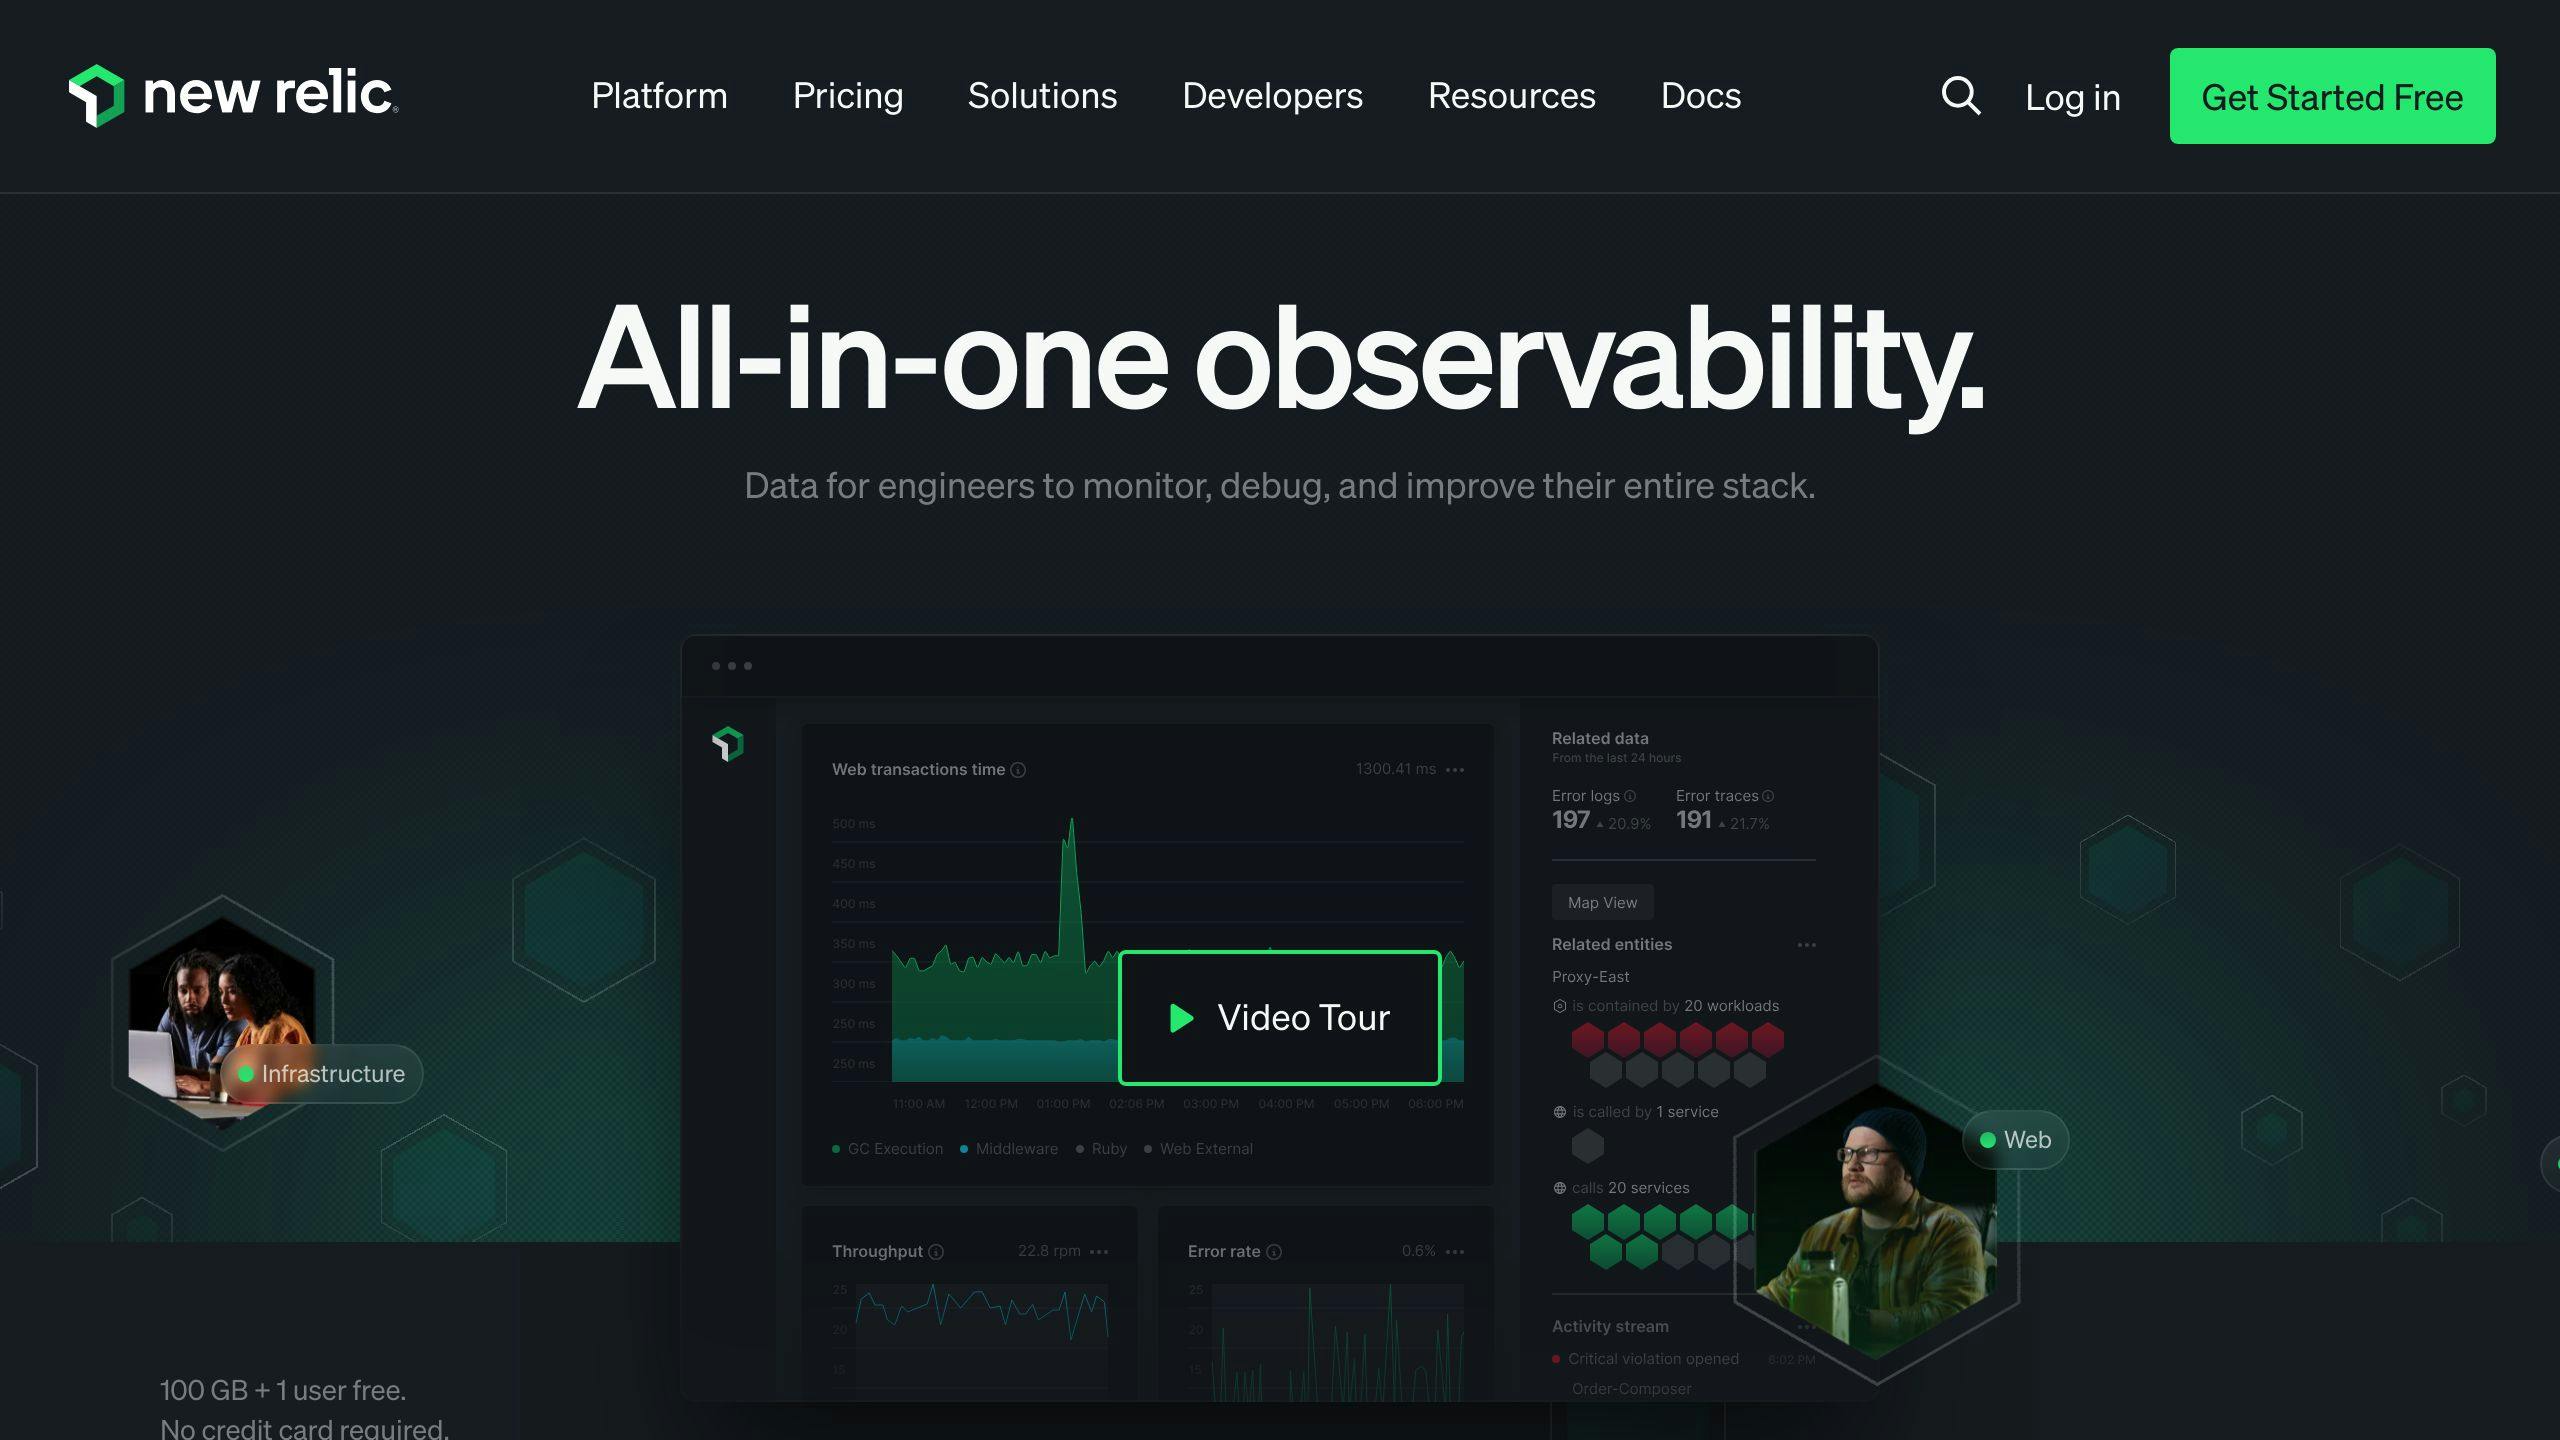
- New Relic: User-friendly with 100GB free data monthly
- Dynatrace: AI-powered insights with Davis engine
- Splunk: Powerful enterprise-level security features
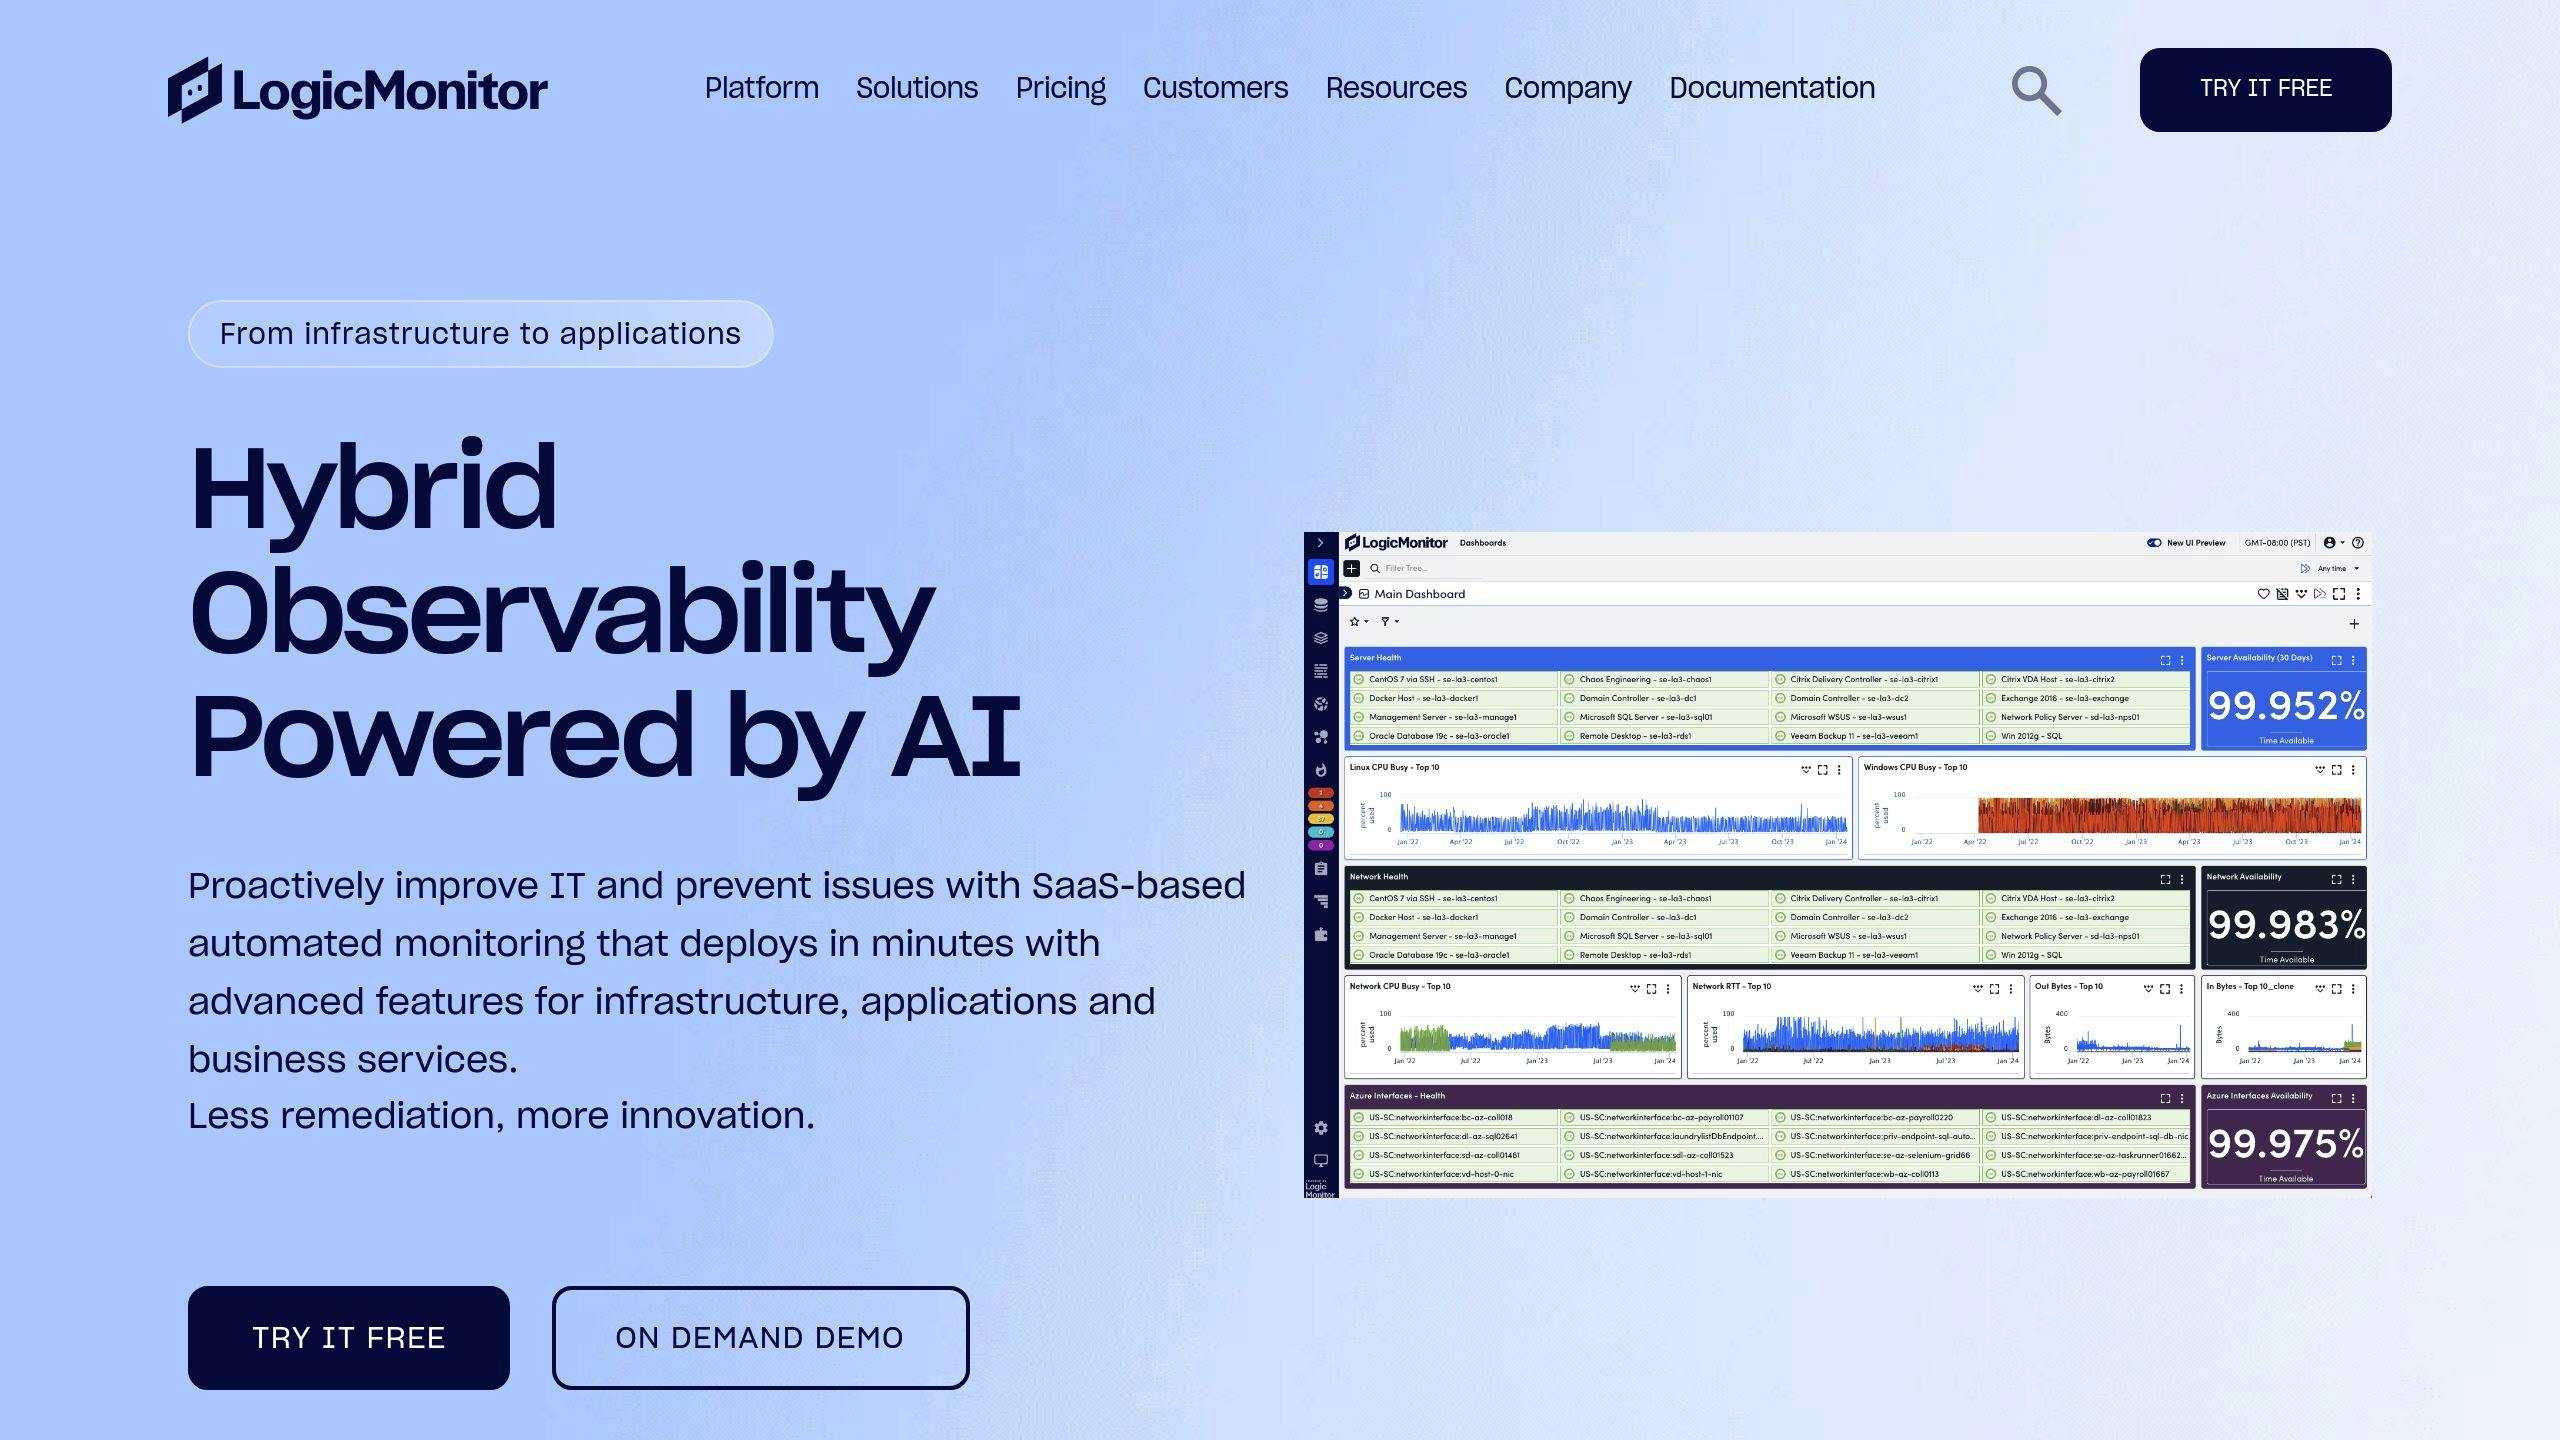
- LogicMonitor: Unified observability with agentless monitoring
- AppDynamics: Detailed code-level diagnostics
Quick Comparison:
| Tool | Best For | Key Feature | Starting Price |
|---|---|---|---|
| New Relic | Easy use | 100GB free data | $0.30/GB after free |
| Dynatrace | AI insights | Davis AI engine | $69/month (8GB/host) |
| Splunk | Enterprise security | Used by top companies | Contact for quote |
| LogicMonitor | Unified monitoring | Agentless approach | Contact for quote |
| AppDynamics | Code diagnostics | Business impact analysis | $60/month per CPU |
Choose based on your needs, team skills, budget, and scalability requirements.
Related video from YouTube
1. New Relic

New Relic offers end-to-end visibility into complex software environments. It's a strong Datadog alternative with:
- Application Performance Monitoring (APM)
- Infrastructure monitoring
- Real User Monitoring (RUM)
- Log management
- AI-powered incident response
New Relic's pricing model stands out:
- 100 GB of free data ingest per month
- No overage penalties for log ingestion
- No peak usage billing for data
This can lead to more predictable costs for growing businesses.
"Every company is thinking about how to scale their business with AI." - Arnie Lopez, New Relic Chief Customer Officer
New Relic now supports over 60 AI monitoring integrations.
| Feature | Benefit |
|---|---|
| 30+ observability tools in one | Simplifies tooling, reduces costs |
| 750+ integrations | Works with most popular tools |
| Unlimited containers-per-host | Included on every plan |
| 30-day log retention | No additional costs |
Pricing starts at $49/month for Core users, with one free Full Platform user (additional at $99/month).
Note: Some users find New Relic's pricing confusing for microservices architectures. Try their free demo first.
2. Dynatrace

Dynatrace offers AI-powered software intelligence monitoring. It focuses on automating cloud complexities with:
- Fully automated full-stack monitoring
- AI-driven analytics for anomaly detection
- Real-time insights into application performance and user experience
Dynatrace's AI engine, Davis®, continuously scans for issues and provides root cause analysis.
Three patented technologies:
- Smartscape: Dynamic topology mapping
- OneAgent: Metric collection
- PurePath: Distributed tracing and code-level analysis
Real-world impact:
| Metric | Improvement |
|---|---|
| Mean Time to Repair (MTTR) | Decreased by over 50% |
| Development time for web portal code | Cut by nearly 50% |
| Cost savings | Tens of thousands through tool consolidation |
"With Dynatrace, we have synthetic checks and real-user monitoring of all our websites... It's all integrated into one place." - Barry P., Medica Health Plans
Pricing starts at $74 per 8GB per host for Full-stack option.
Potential drawbacks:
- Complex UI with steep learning curve
- Limited out-of-the-box incident management
- Can take time to analyze processes in some cases
Use Dynatrace's onboarding courses to navigate the platform's complexities.
sbb-itb-9890dba
3. Splunk

Splunk offers powerful big data analysis for IT operations, security, and business intelligence. It handles both structured and unstructured data from various sources.
Two main versions:
| Feature | Splunk Enterprise | Splunk Cloud |
|---|---|---|
| Deployment | On-premises | SaaS (cloud-hosted) |
| Customization | Deeper | Streamlined, automated |
| Scalability | Tied to infrastructure | Automatic scaling |
| Cost Structure | Upfront costs + licensing | Subscription-based |
Splunk's IT Service Intelligence (ITSI) offers AI-driven incident prediction and resolution, showing:
- 60% reduction in unplanned downtime
- 95% decrease in alert noise
"It's about spotting flawed processes, then using Splunk to provide a list of affected customers so we can fix problems using RPA." - Paul Emmett, TalkTalk
Pricing for a team of 200:
- Splunk Cloud: $17,700 to $35,800
- Splunk Enterprise: $30,900 to $45,700
Note: Splunk can be more expensive than Datadog and has a steeper learning curve.
4. LogicMonitor

LogicMonitor offers AI-powered observability for complex hybrid IT environments. Key features:
| Feature | Description |
|---|---|
| Agentless Monitoring | Uses scalable collectors |
| AI-Driven Insights | Machine learning for anomaly detection |
| Extensive Integrations | Over 2000 pre-configured |
| Customizable Dashboards | Drag-and-drop functionality |
| Capacity Forecasting | Predictive analytics for planning |
LM Intelligence acts as an early warning system with dynamic thresholding and anomaly detection.
"Being on the bleeding edge of technology requires shifting from reactive responses to proactive insights." - Christina Kosmowski, LogicMonitor CEO
Key points:
- Available as SaaS, on-premises, or hybrid
- Data retention: 1 year (Pro), 2 years (Enterprise)
- Pricing starts at $20 per month per user
- More pre-configured integrations than Datadog
- Complex interface for new users
Well-suited for large enterprise IT teams and MSPs dealing with complex hybrid environments.
5. AppDynamics

AppDynamics offers real-time application performance management (APM) with:
| Feature | Description |
|---|---|
| Full-Stack Monitoring | Apps, infrastructure, user experience |
| AI-Powered Insights | Machine learning for anomaly detection |
| Code-Level Diagnostics | Pinpoint issues to specific code lines |
| Business Impact Analysis | Correlate performance with business outcomes |
| Serverless Monitoring | Serverless Agent for AWS Lambda |
"The days when applications and infrastructure were managed in isolation are now coming to an end." - Matt Chotin, AppDynamics
Key points:
- Pricing: $6 to $95 per CPU core per month
- Available as SaaS or on-premises
- Includes access to AppDynamics University
- More complex setup than some tools
- Strong support for specialized tech like mainframes and SAP
Well-suited for large enterprises with complex applications needing detailed performance insights.
Wrap-up
Choose based on your specific needs:
- New Relic for ease of use and free tier
- Dynatrace for AI-powered insights
- Splunk for enterprise security
- LogicMonitor for unified observability
- AppDynamics for code-level diagnostics
Consider your team's expertise, budget, and scalability needs. Calculate potential costs based on expected usage.
Remember, open-source solutions like SigNoz can offer flexibility and potentially lower costs.


