Looking for Datadog alternatives? Here's a quick rundown:
- SigNoz: Open-source, cost-effective for small to medium businesses
- New Relic: Comprehensive toolset for DevOps teams
- Dynatrace: AI-powered insights for large enterprises
- Prometheus: Free, ideal for cloud-native environments
- LogicMonitor: AIOps features for mid-size to large businesses
- AppDynamics: Business metrics correlation for enterprise applications
- Splunk: Powerful log analysis for security-focused enterprises
Related video from YouTube
Quick Comparison
| Tool | Best For | Key Advantage | Pricing |
|---|---|---|---|
| SigNoz | Small to medium businesses | Free, open-source | Free, $11/month hosted |
| New Relic | DevOps teams | Comprehensive toolset | Free tier, $0.30/GB after 100GB |
| Dynatrace | Large enterprises | AI-powered insights | Starts at $69/month for 8GB |
| Prometheus | Cloud-native environments | Kubernetes integration | Free |
| LogicMonitor | Mid-size to large businesses | AIOps features | Custom pricing |
| AppDynamics | Enterprise applications | Business metrics correlation | Starts at $60/month per CPU core |
| Splunk | Security-focused enterprises | Powerful log analysis | Based on data volume |
Consider your needs, budget, and technical expertise when choosing. Test before committing to ensure the solution fits your team's requirements.
1. SigNoz
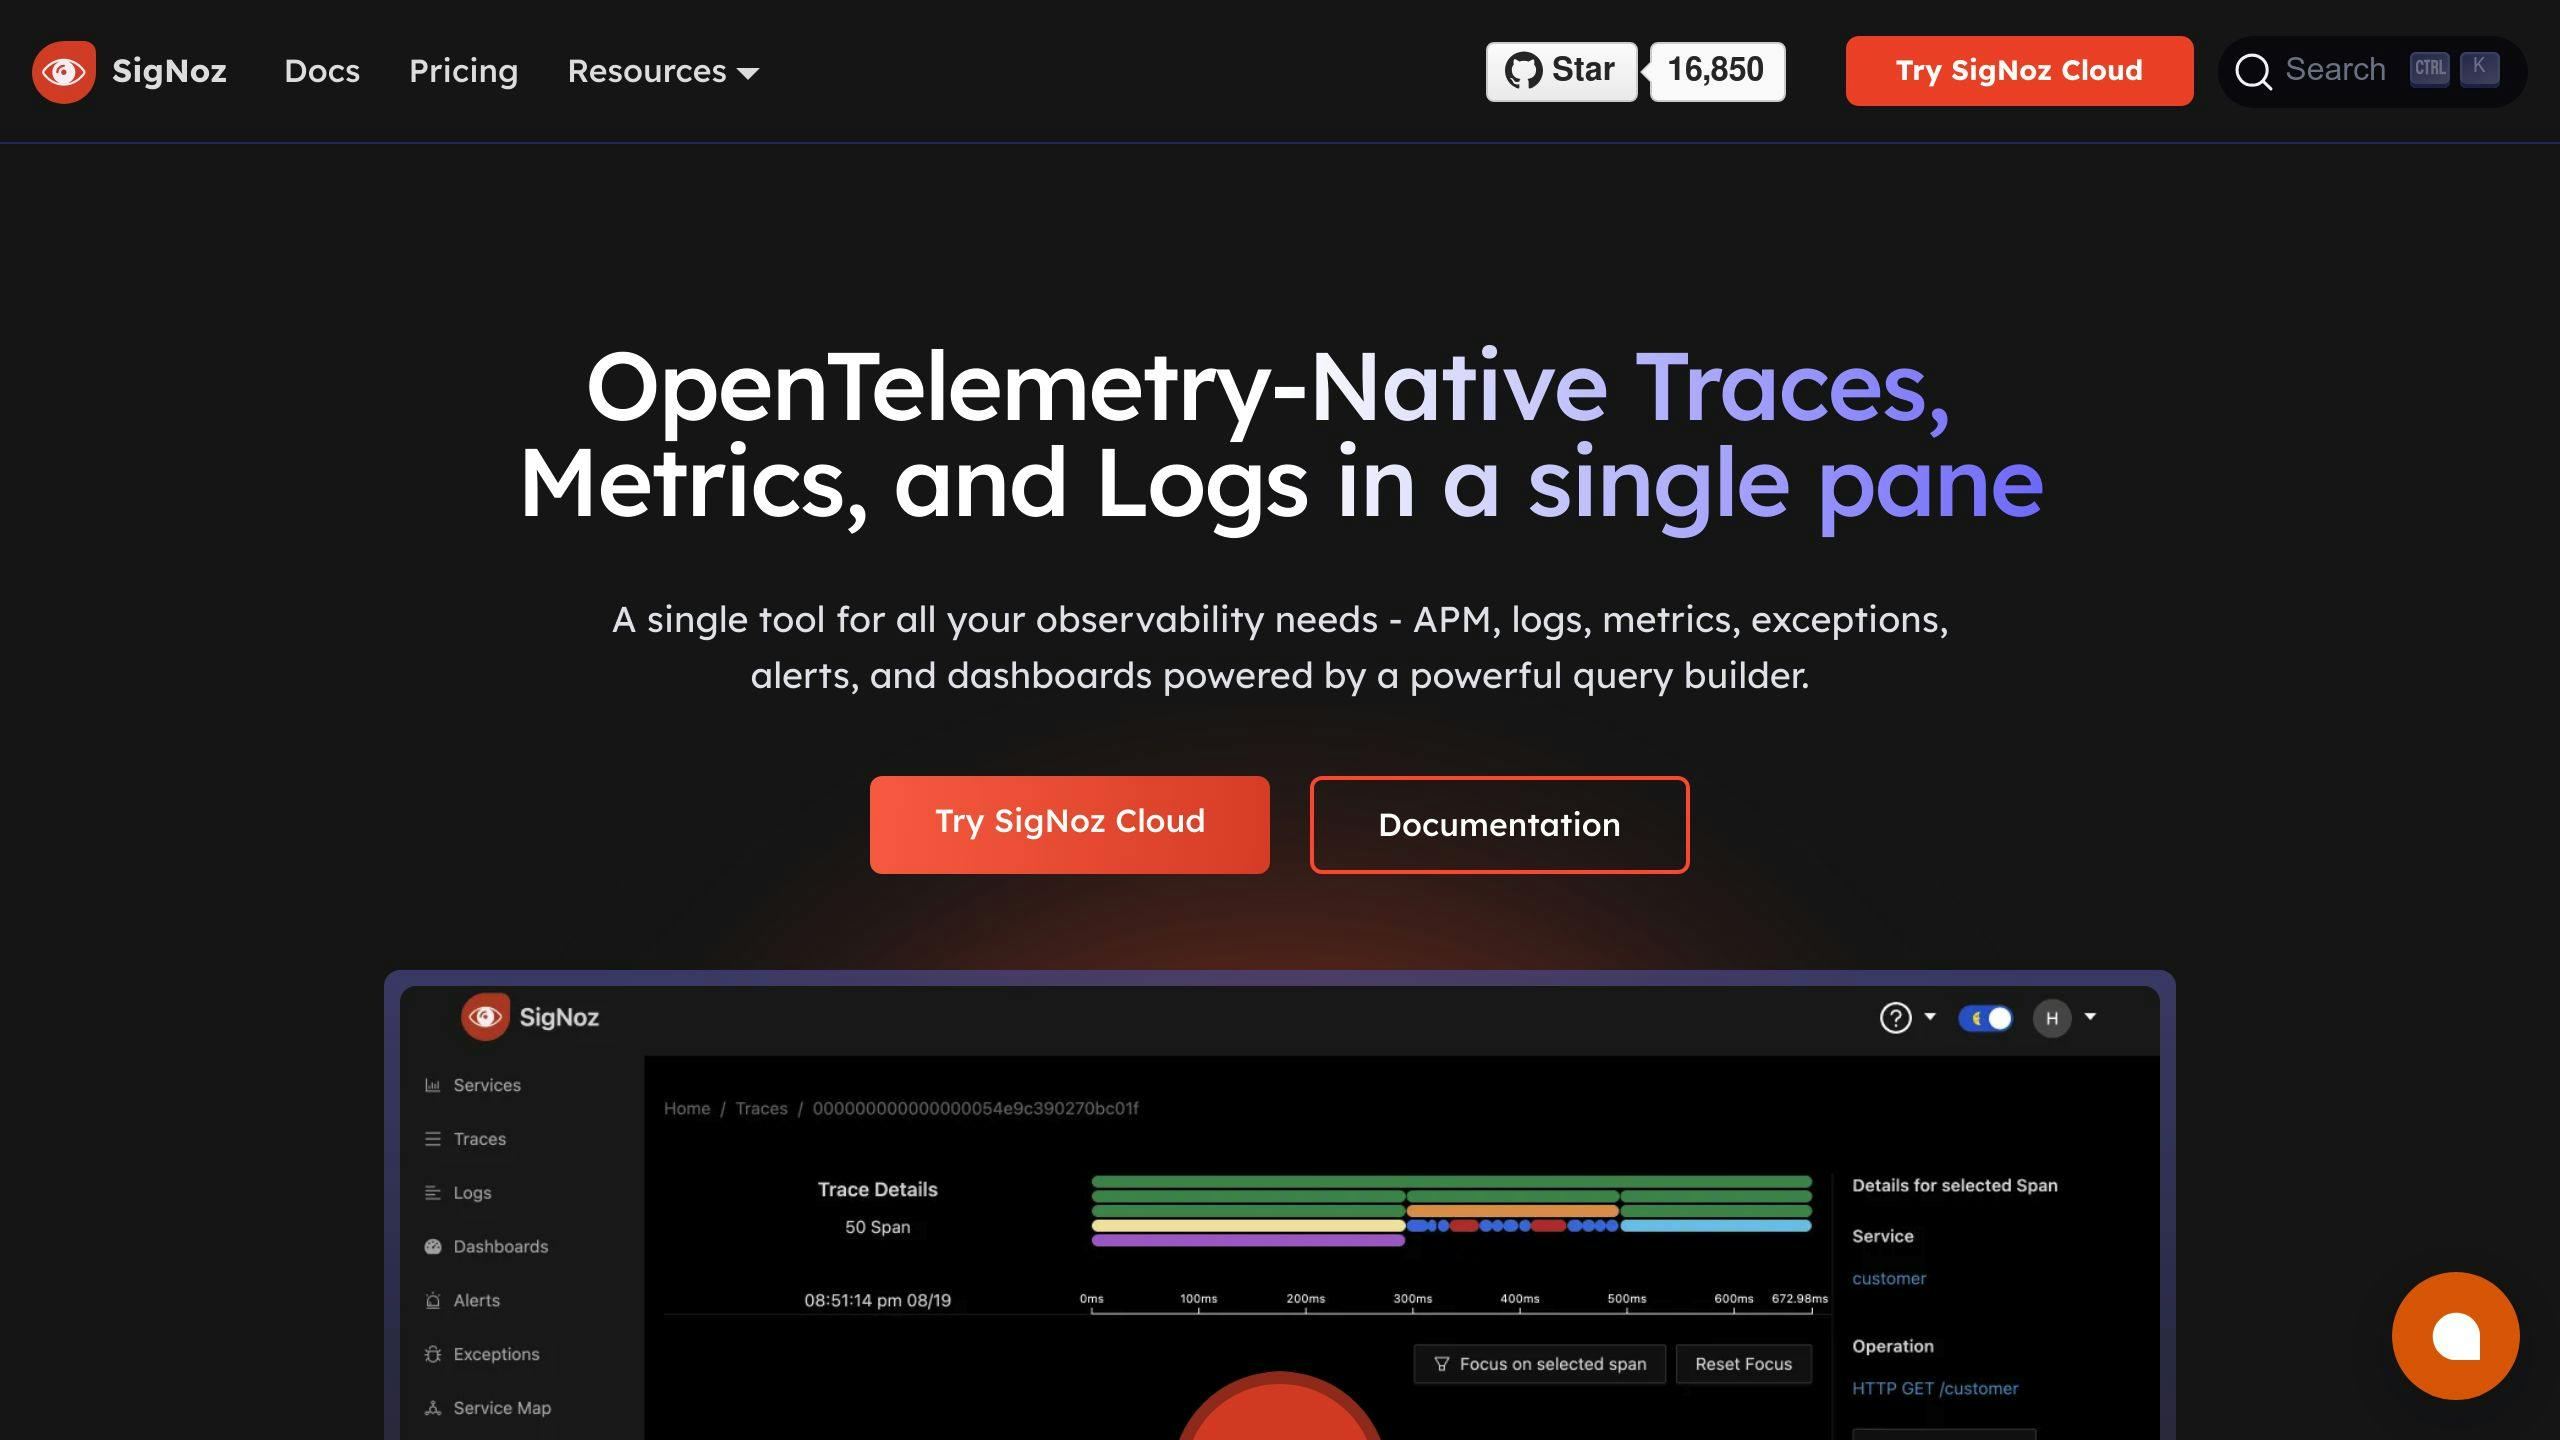
SigNoz is an open-source observability platform that's gaining traction as a cost-effective Datadog alternative. It offers a unified dashboard for metrics, traces, and logs.
Features:
- OpenTelemetry-native for easy data collection
- AI-powered assistance for querying and insights
- Root cause analysis to speed up problem-solving
Cost Savings:
| Team Size | SigNoz Cost | Datadog Cost | Value for Money |
|---|---|---|---|
| 25 engineers | $1,078 | $10,421 | 9.7x more |
| 100 engineers | $4,903 | $30,213 | 6.2x more |
| 200 engineers | $9,412 | $68,743 | 7.3x more |
SigNoz uses a consumption-based model, mainly charging for data ingested. This can be more predictable than Datadog's complex pricing structure.
Best For: Teams of all sizes looking for a flexible, cost-effective solution. Especially good for startups, budget-conscious companies, and teams using microservices or hybrid architectures.
Drawbacks: As a newer player, SigNoz might face scalability challenges for very large enterprises. It also lacks some advanced features found in more established tools.
2. New Relic
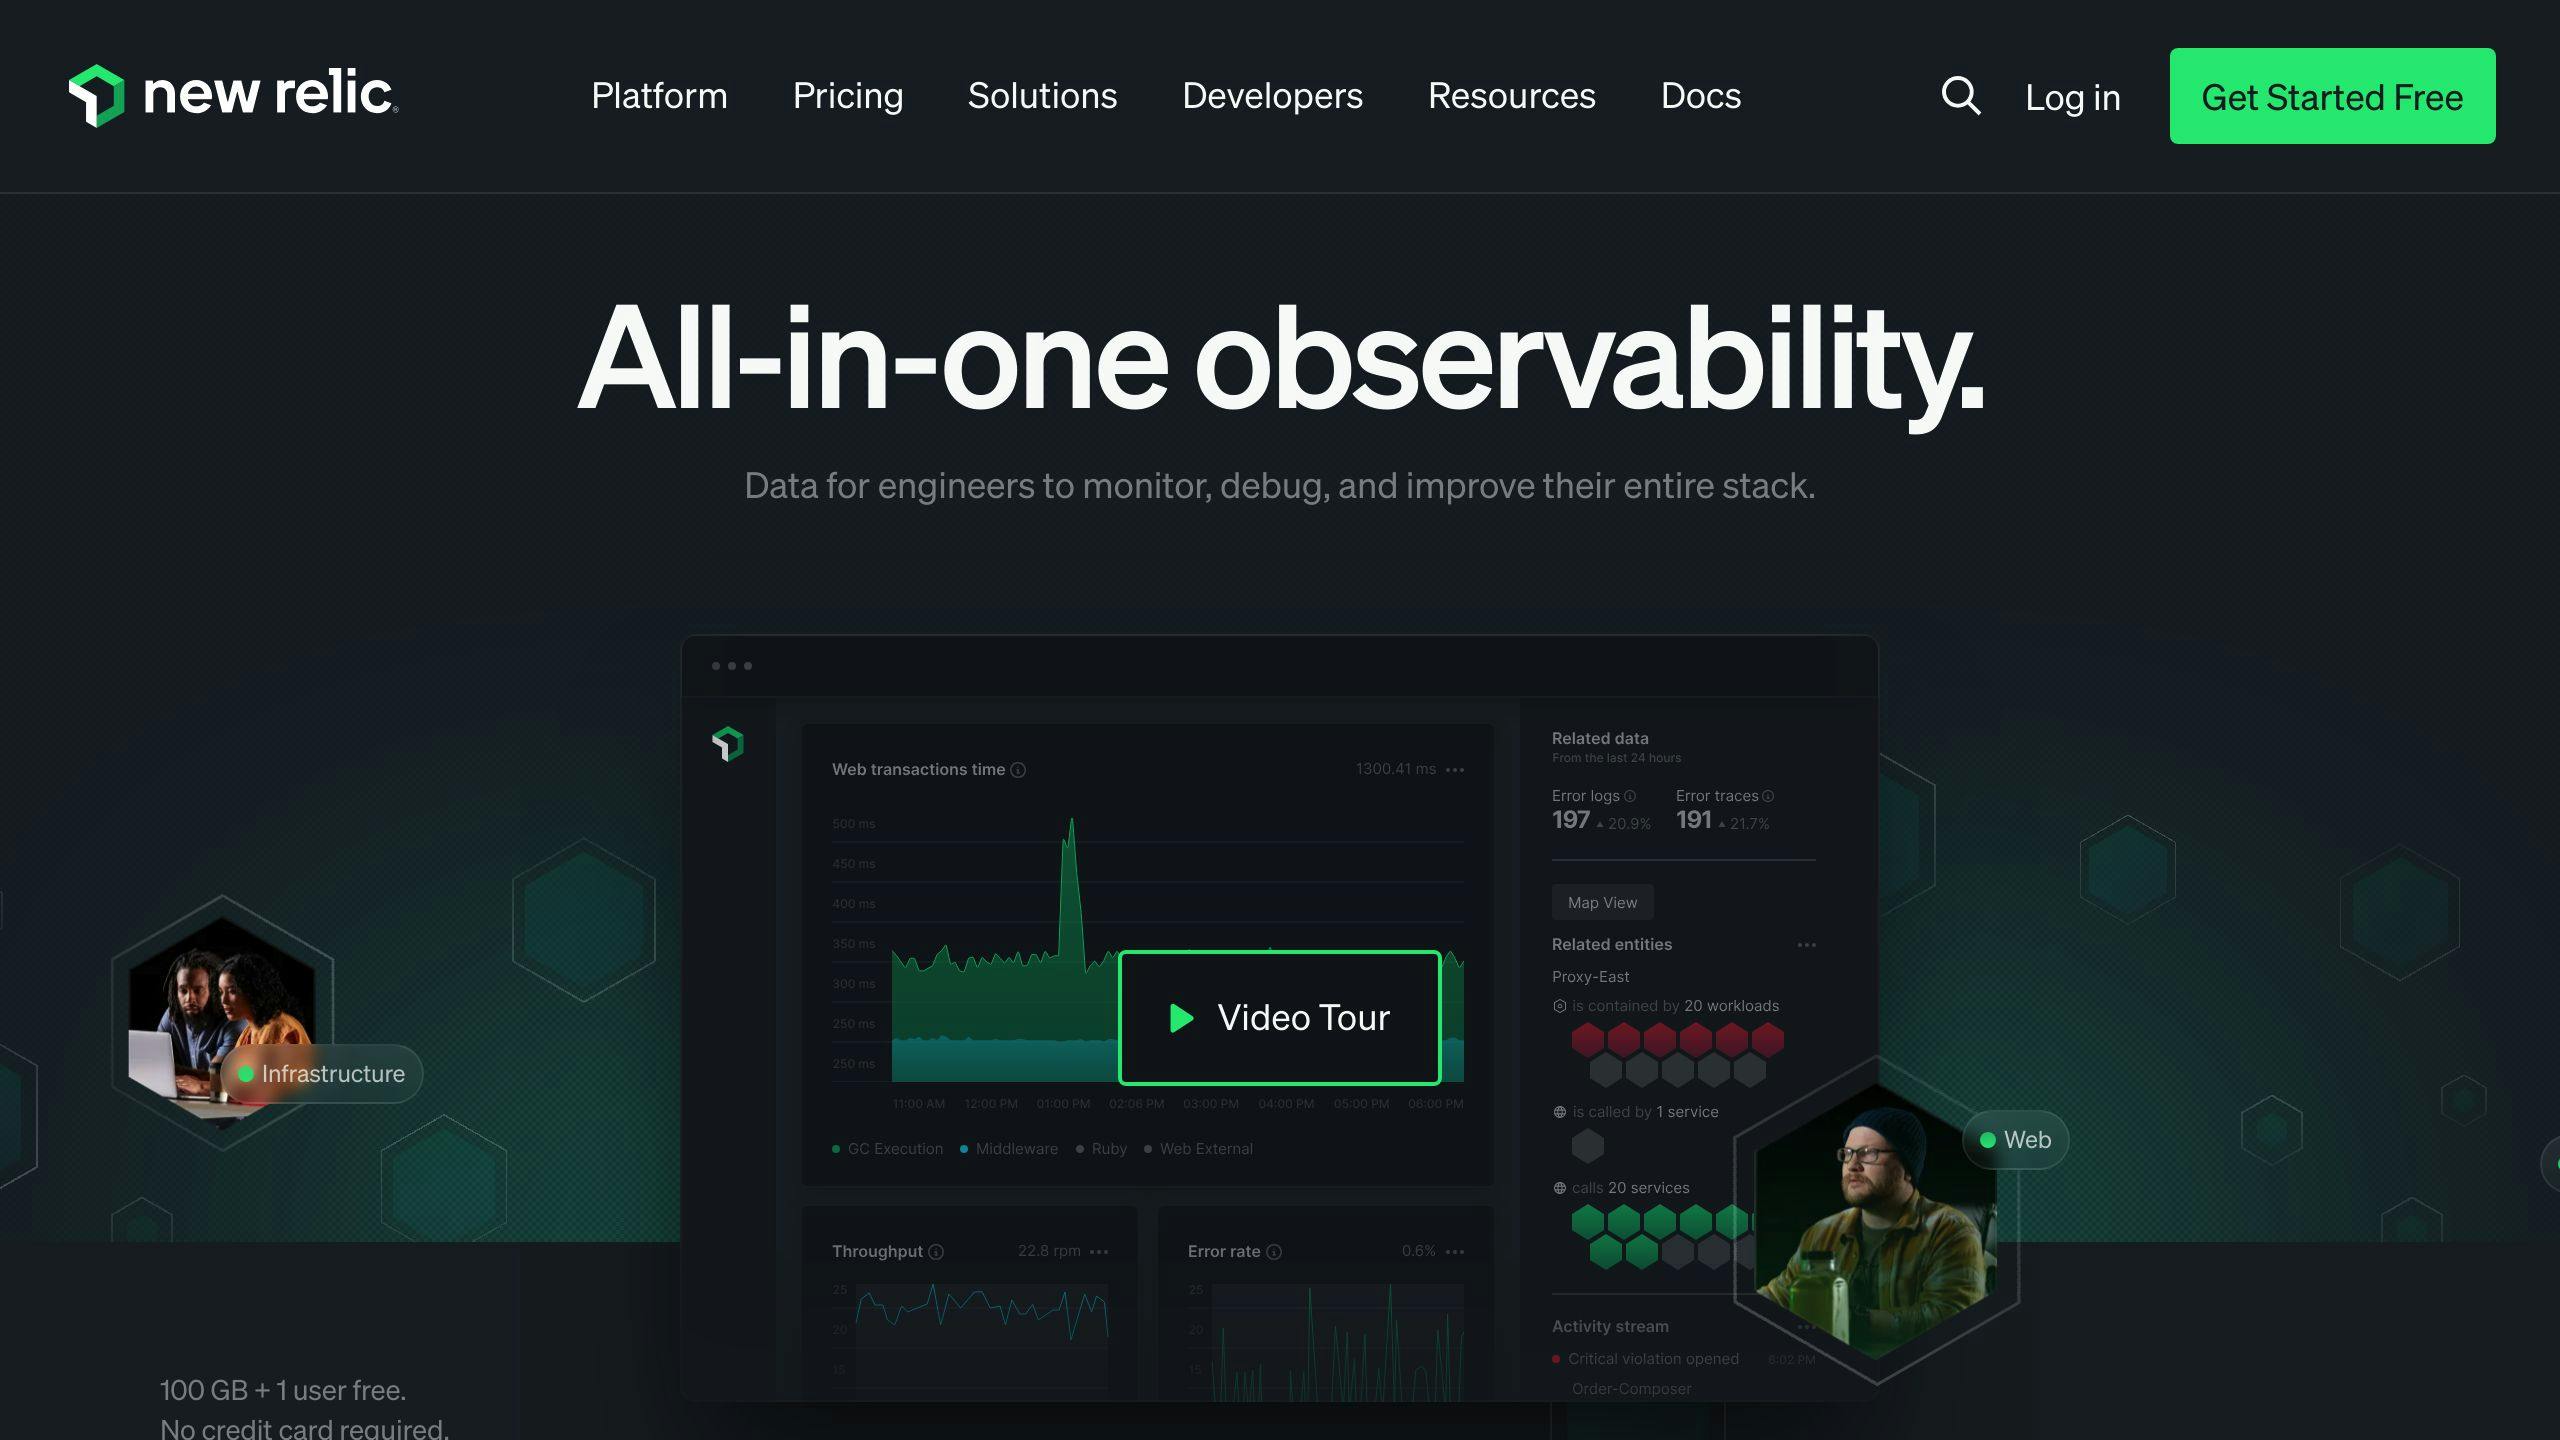
New Relic offers full-stack monitoring for complex software environments. It's known for its user-friendly interface and powerful APM capabilities.
Key Features:
- Auto-instrumentation for 8 programming languages
- Distributed tracing and sampling
- Real-time analytics and full-stack observability
- Customizable dashboards and alerts
- Integration with over 650 third-party tools
Pricing:
| Plan | Data Ingestion | Cost |
|---|---|---|
| Free | First 100GB/month | $0 |
| Paid | Beyond 100GB | $0.30 or $0.50/GB |
User seats can cost up to $549/user per month for enterprise plans.
Best For: Companies with hybrid infrastructure spanning cloud and on-premises environments. Particularly useful for development teams needing detailed APM insights and organizations seeking a simpler user experience.
Drawbacks:
- Can be more expensive than Datadog for larger teams
- May require additional tools like Grafana for custom events and metrics
3. Dynatrace

Dynatrace is a powerful APM tool designed for large enterprises. It offers comprehensive monitoring for cloud, on-premise, hybrid applications, and SaaS environments.
Key Features:
- AI-powered root cause analysis with Davis® AI engine
- Real-time topology mapping with Smartscape
- OneAgent for automatic data collection
- PurePath for distributed tracing and code-level analysis
Pricing:
| Plan | Starting Price | Notes |
|---|---|---|
| Full-stack Monitoring | $74 per 8GB per host | Varies based on deployment mode |
| Infrastructure Monitoring | $0.04 per hour | Any size host |
Best For: Enterprise-level organizations with multicloud and hybrid cloud setups, teams requiring in-depth APM and infrastructure monitoring, and businesses looking for AI-powered problem detection and resolution.
Drawbacks:
- Steep learning curve due to platform complexity
- Higher cost compared to some competitors
- Limited out-of-the-box incident management features
sbb-itb-9890dba
4. Prometheus
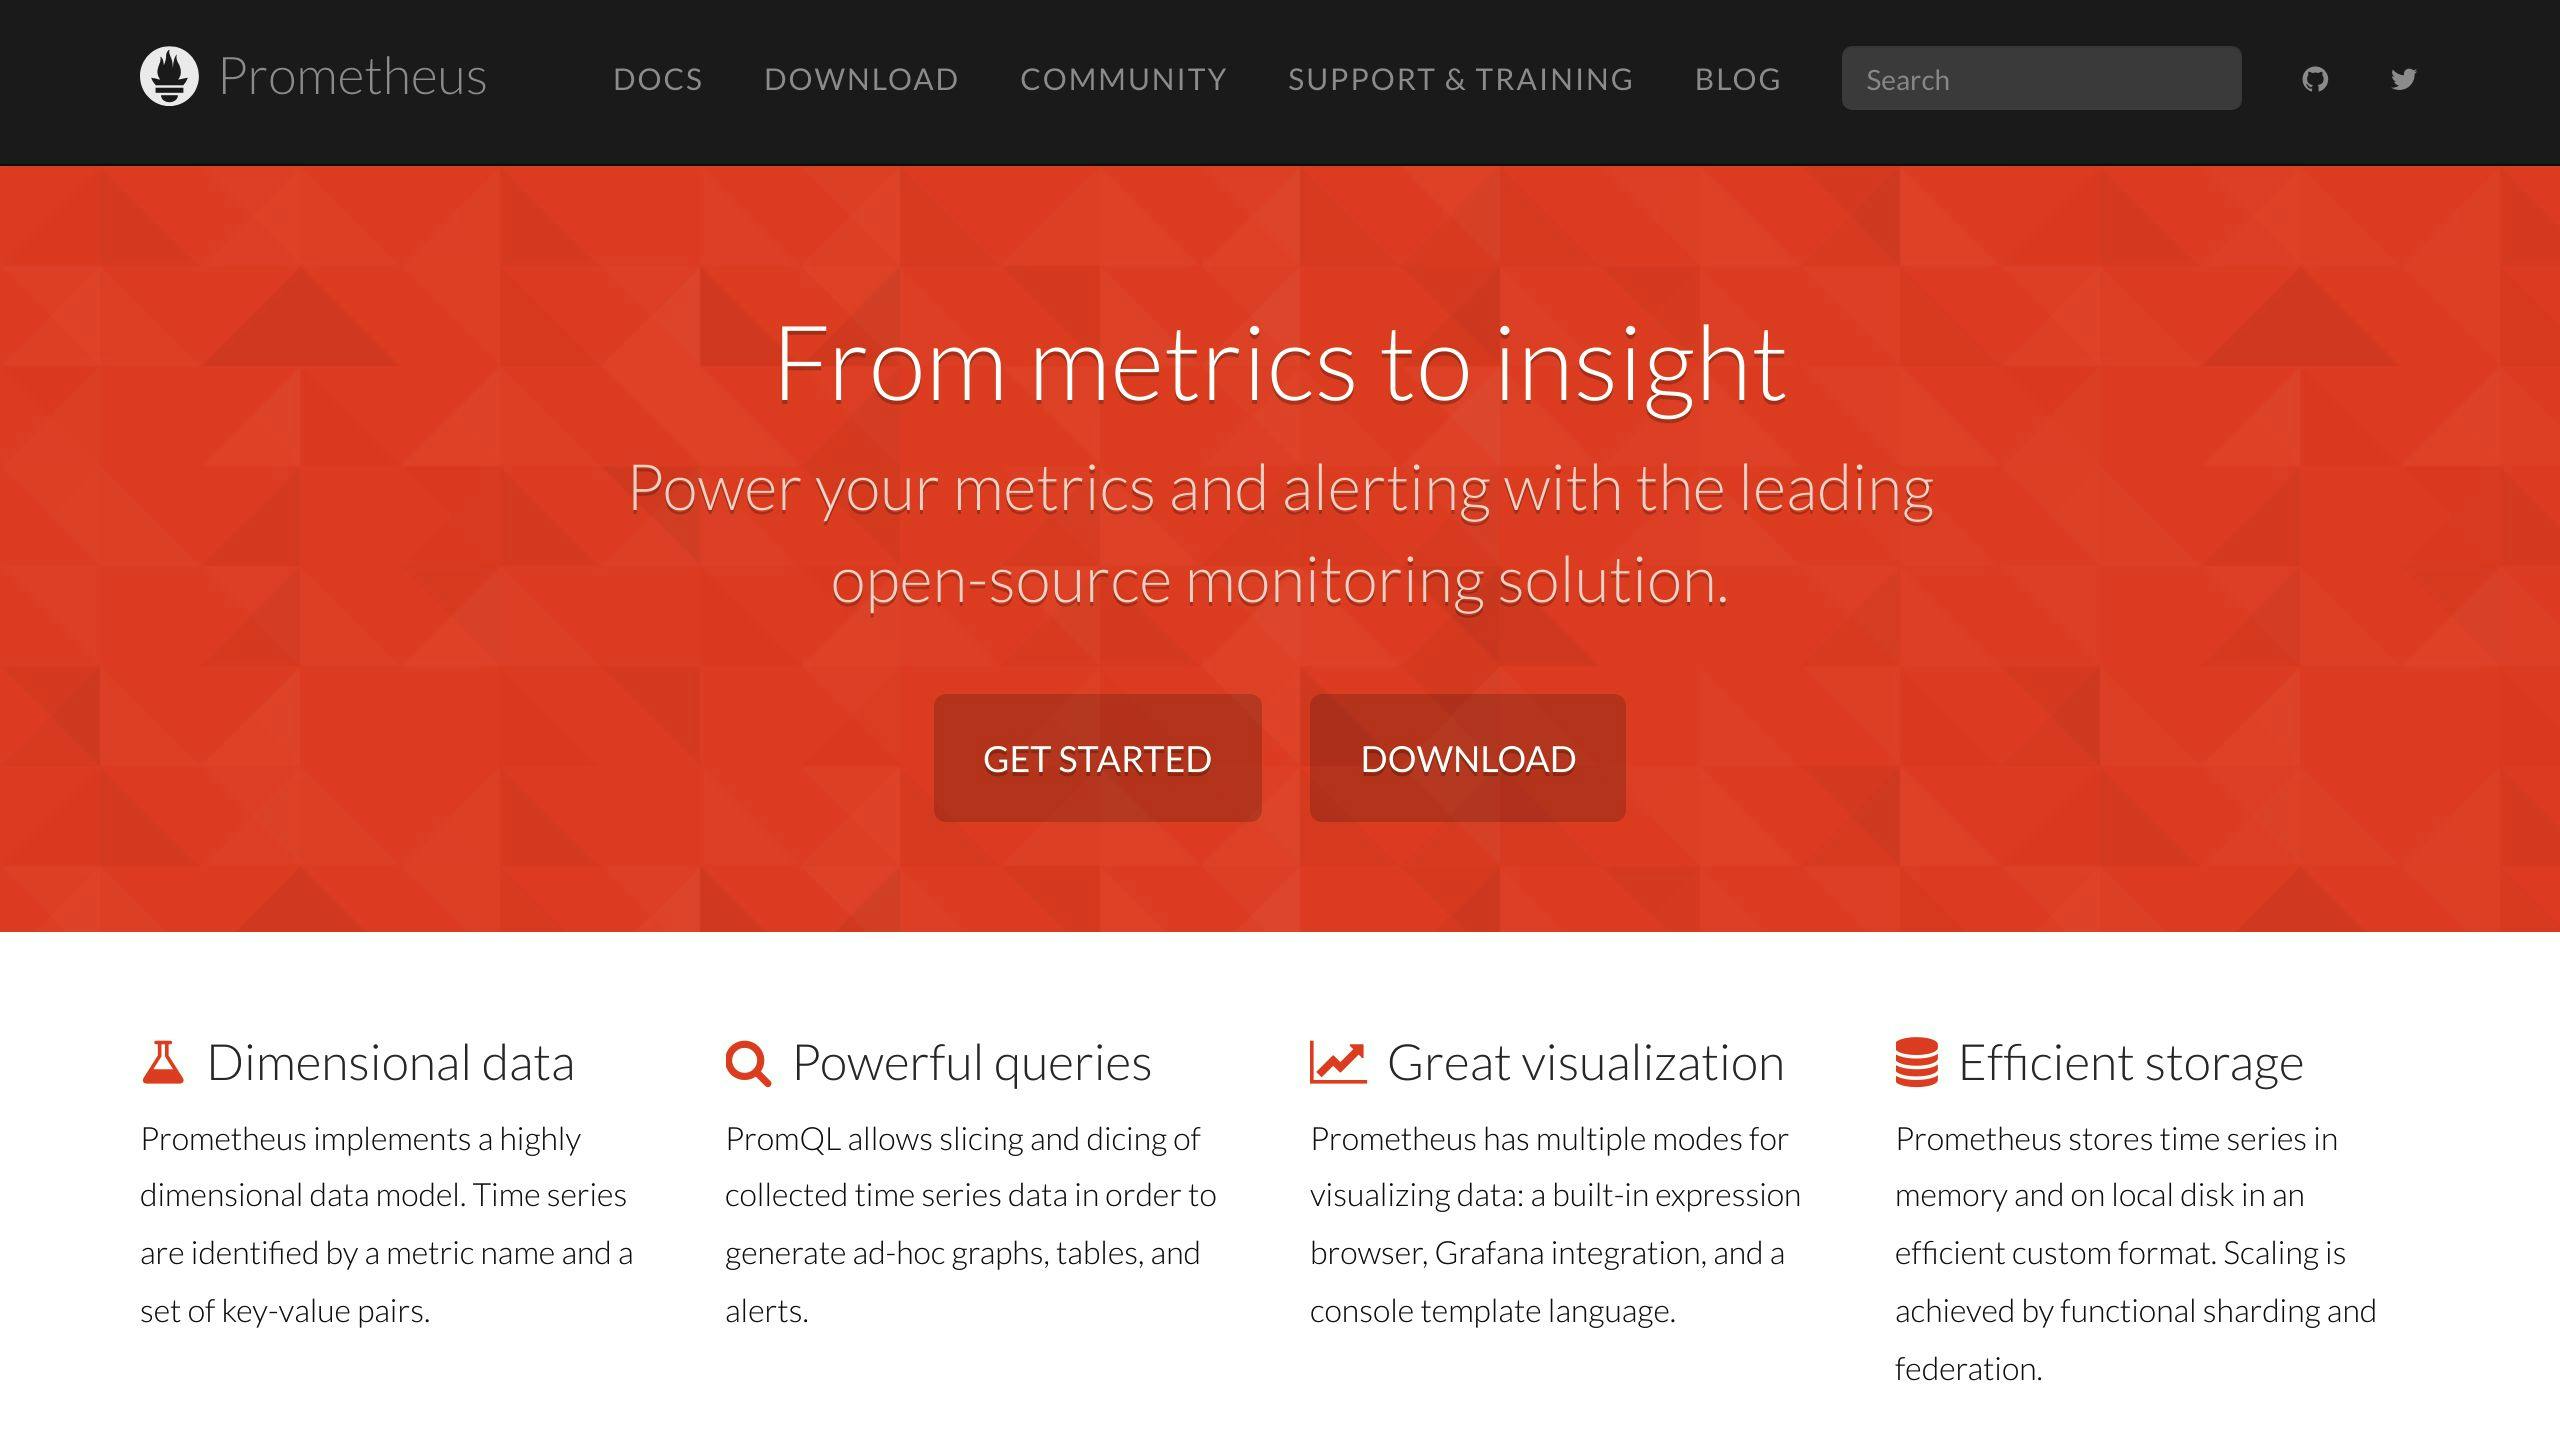
Prometheus is an open-source monitoring and alerting tool designed for cloud-native environments, particularly Kubernetes.
Key Features:
- Multidimensional data model
- PromQL query language for flexible data analysis
- Pull-based data collection model
- Built-in alerting capabilities
- Integration with Grafana for advanced visualization
Pricing: Free to use, but costs may arise from infrastructure setup and maintenance.
Best For: DevOps teams managing containerized environments, organizations using Kubernetes, and teams looking for a cost-effective monitoring solution.
Drawbacks:
- Steep learning curve for setup and configuration
- Limited built-in visualization options
- Requires additional tools for complete observability
5. LogicMonitor
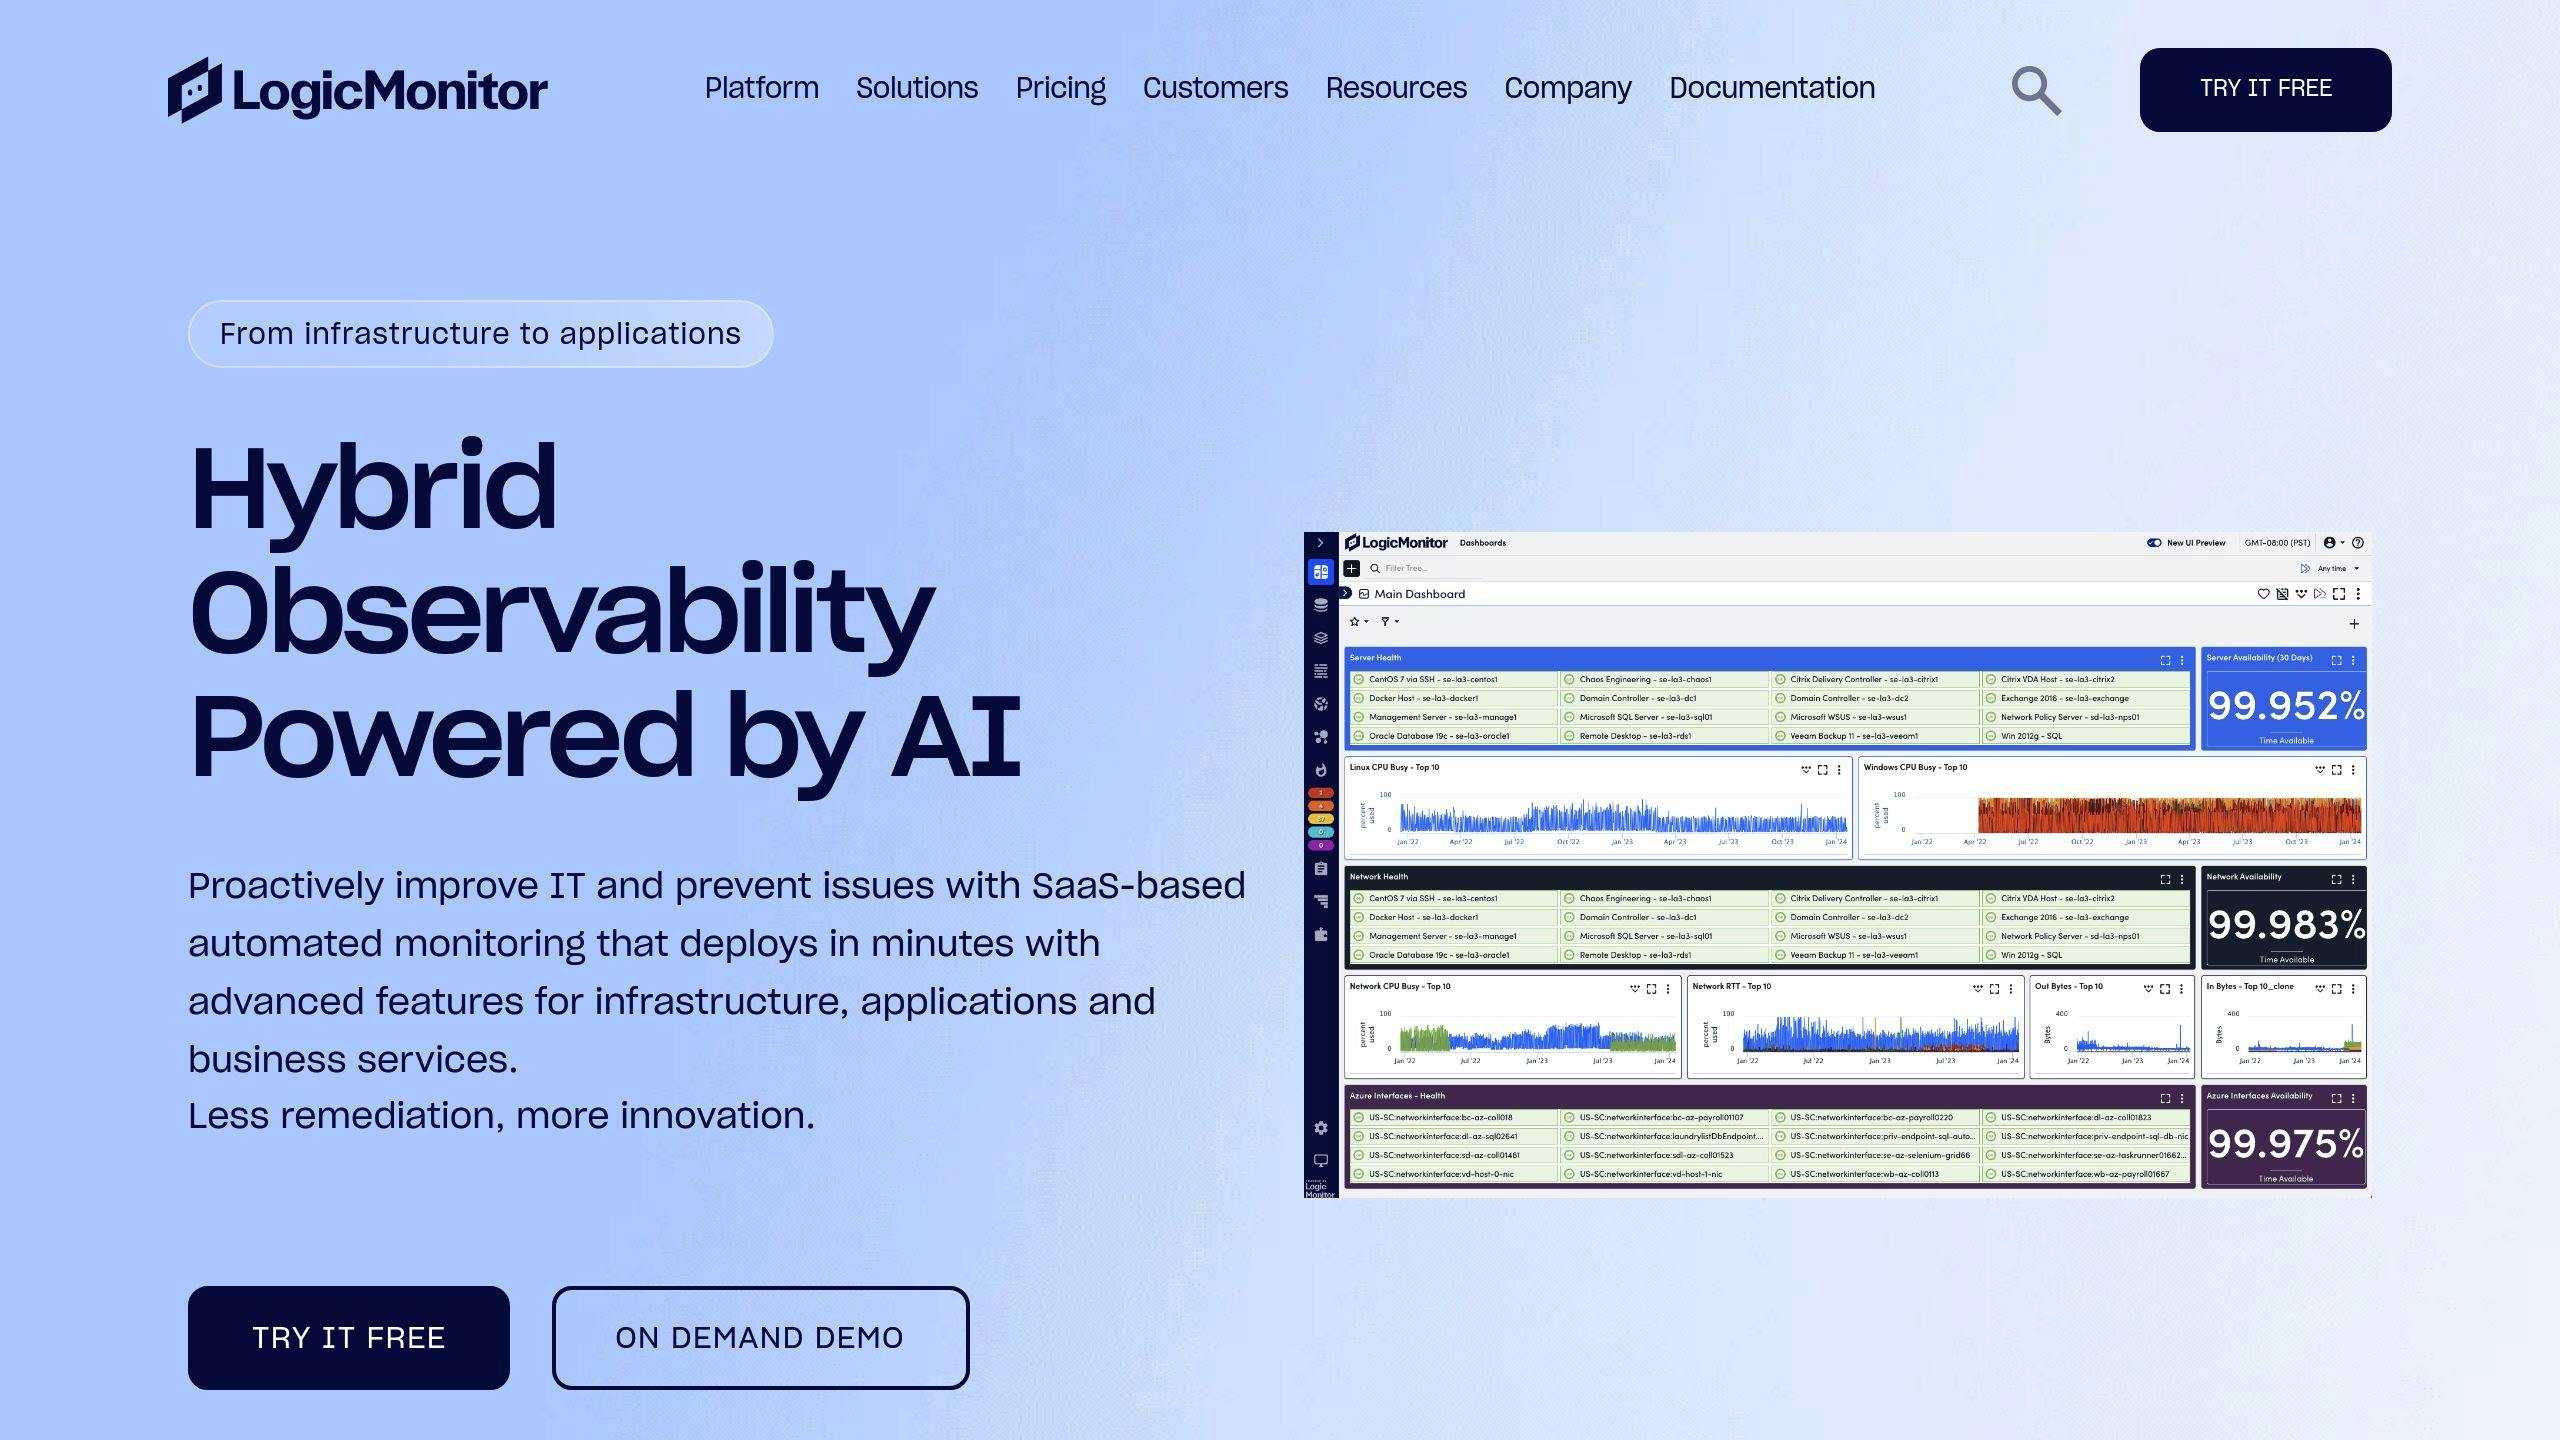
LogicMonitor is a cloud-based observability platform offering end-to-end visibility into IT infrastructure.
Key Features:
- Agentless data gathering
- Dynamic device tracking
- AI-driven anomaly detection
- Customizable dashboards
- Capacity forecasting
Pricing: Two main plans: Pro (up to 1999 devices) and Enterprise (2000+ devices). Exact pricing isn't public.
Best For: Large enterprises with complex, hybrid IT environments, managed service providers handling multiple clients, and organizations needing extensive integration options.
Drawbacks:
- Steep learning curve for new users
- Can be expensive for smaller organizations
- Interface complexity may overwhelm some users
6. AppDynamics

AppDynamics offers real-time insights into complex software environments, helping businesses monitor, manage, and optimize their applications and infrastructure.
Key Features:
- Real-time monitoring and application mapping
- Code-level visibility and distributed transaction tracing
- AI-powered root cause analysis
- Business transaction monitoring
- End-user experience monitoring
Pricing: Subscription-based model with pricing based on data ingestion volume. Three main plans: APM Pro, APM Advanced, and APM Peak.
Best For: Large enterprises with complex IT environments, companies with dedicated IT Operations or DevOps teams, and businesses needing deep insights into application performance.
Drawbacks:
- More involved installation process compared to some alternatives
- User interface can be challenging without proper training
- Limited deployment guide for troubleshooting
7. Splunk
Splunk excels at collecting, indexing, and analyzing machine-generated data in real-time.
Key Features:
- Powerful search capabilities for log files and machine data
- Real-time monitoring and alerting
- Extensive visualization options for data analysis
- AI-driven analytics and automation
- Security Information and Event Management (SIEM) capabilities
Pricing: Based on data ingestion volume, which can get expensive for large-scale operations. Two main pricing models: Workload Pricing and Ingest Pricing.
Best For: Large enterprises with complex IT infrastructures, organizations with significant security and compliance needs, and companies requiring deep, real-time insights from their machine data.
Drawbacks:
- High cost, especially for organizations with large data volumes
- Steep learning curve for new users
- Resource-intensive, which can impact performance
Wrap-up
When choosing a Datadog alternative, consider your specific needs, budget, and technical expertise. Each tool has its strengths:
- SigNoz for budget-conscious teams
- New Relic for comprehensive toolsets
- Dynatrace for AI-powered insights
- Prometheus for cloud-native environments
- LogicMonitor for AIOps features
- AppDynamics for business metrics correlation
- Splunk for powerful log analysis
Test before committing to ensure the solution meets your team's requirements.