Grafana AI Observability and Eyer.ai are game-changers for data management. Here's what you need to know:
• Grafana AI Observability:
- Open-source AI support
- Cuts costs (up to 50% reduction in billable metrics)
- Handles complex, multi-source setups
- Steep learning curve
• Eyer.ai:
- Focused on Boomi integrations
- Quick anomaly detection
- Easy setup with pre-built settings
- Limited to Boomi ecosystem
Quick Comparison:
| Feature | Grafana AI Observability | Eyer.ai |
|---|---|---|
| Focus | Broad observability | Boomi-specific |
| AI Use | Adaptive Telemetry | Anomaly detection |
| Setup | Complex | Easy |
| Cost Savings | Up to 50% | Not specified |
Choose Grafana for diverse, large-scale operations. Pick Eyer.ai for hassle-free Boomi monitoring.
Bottom line: Your choice depends on your tech setup, skills, and monitoring needs.
Related video from YouTube
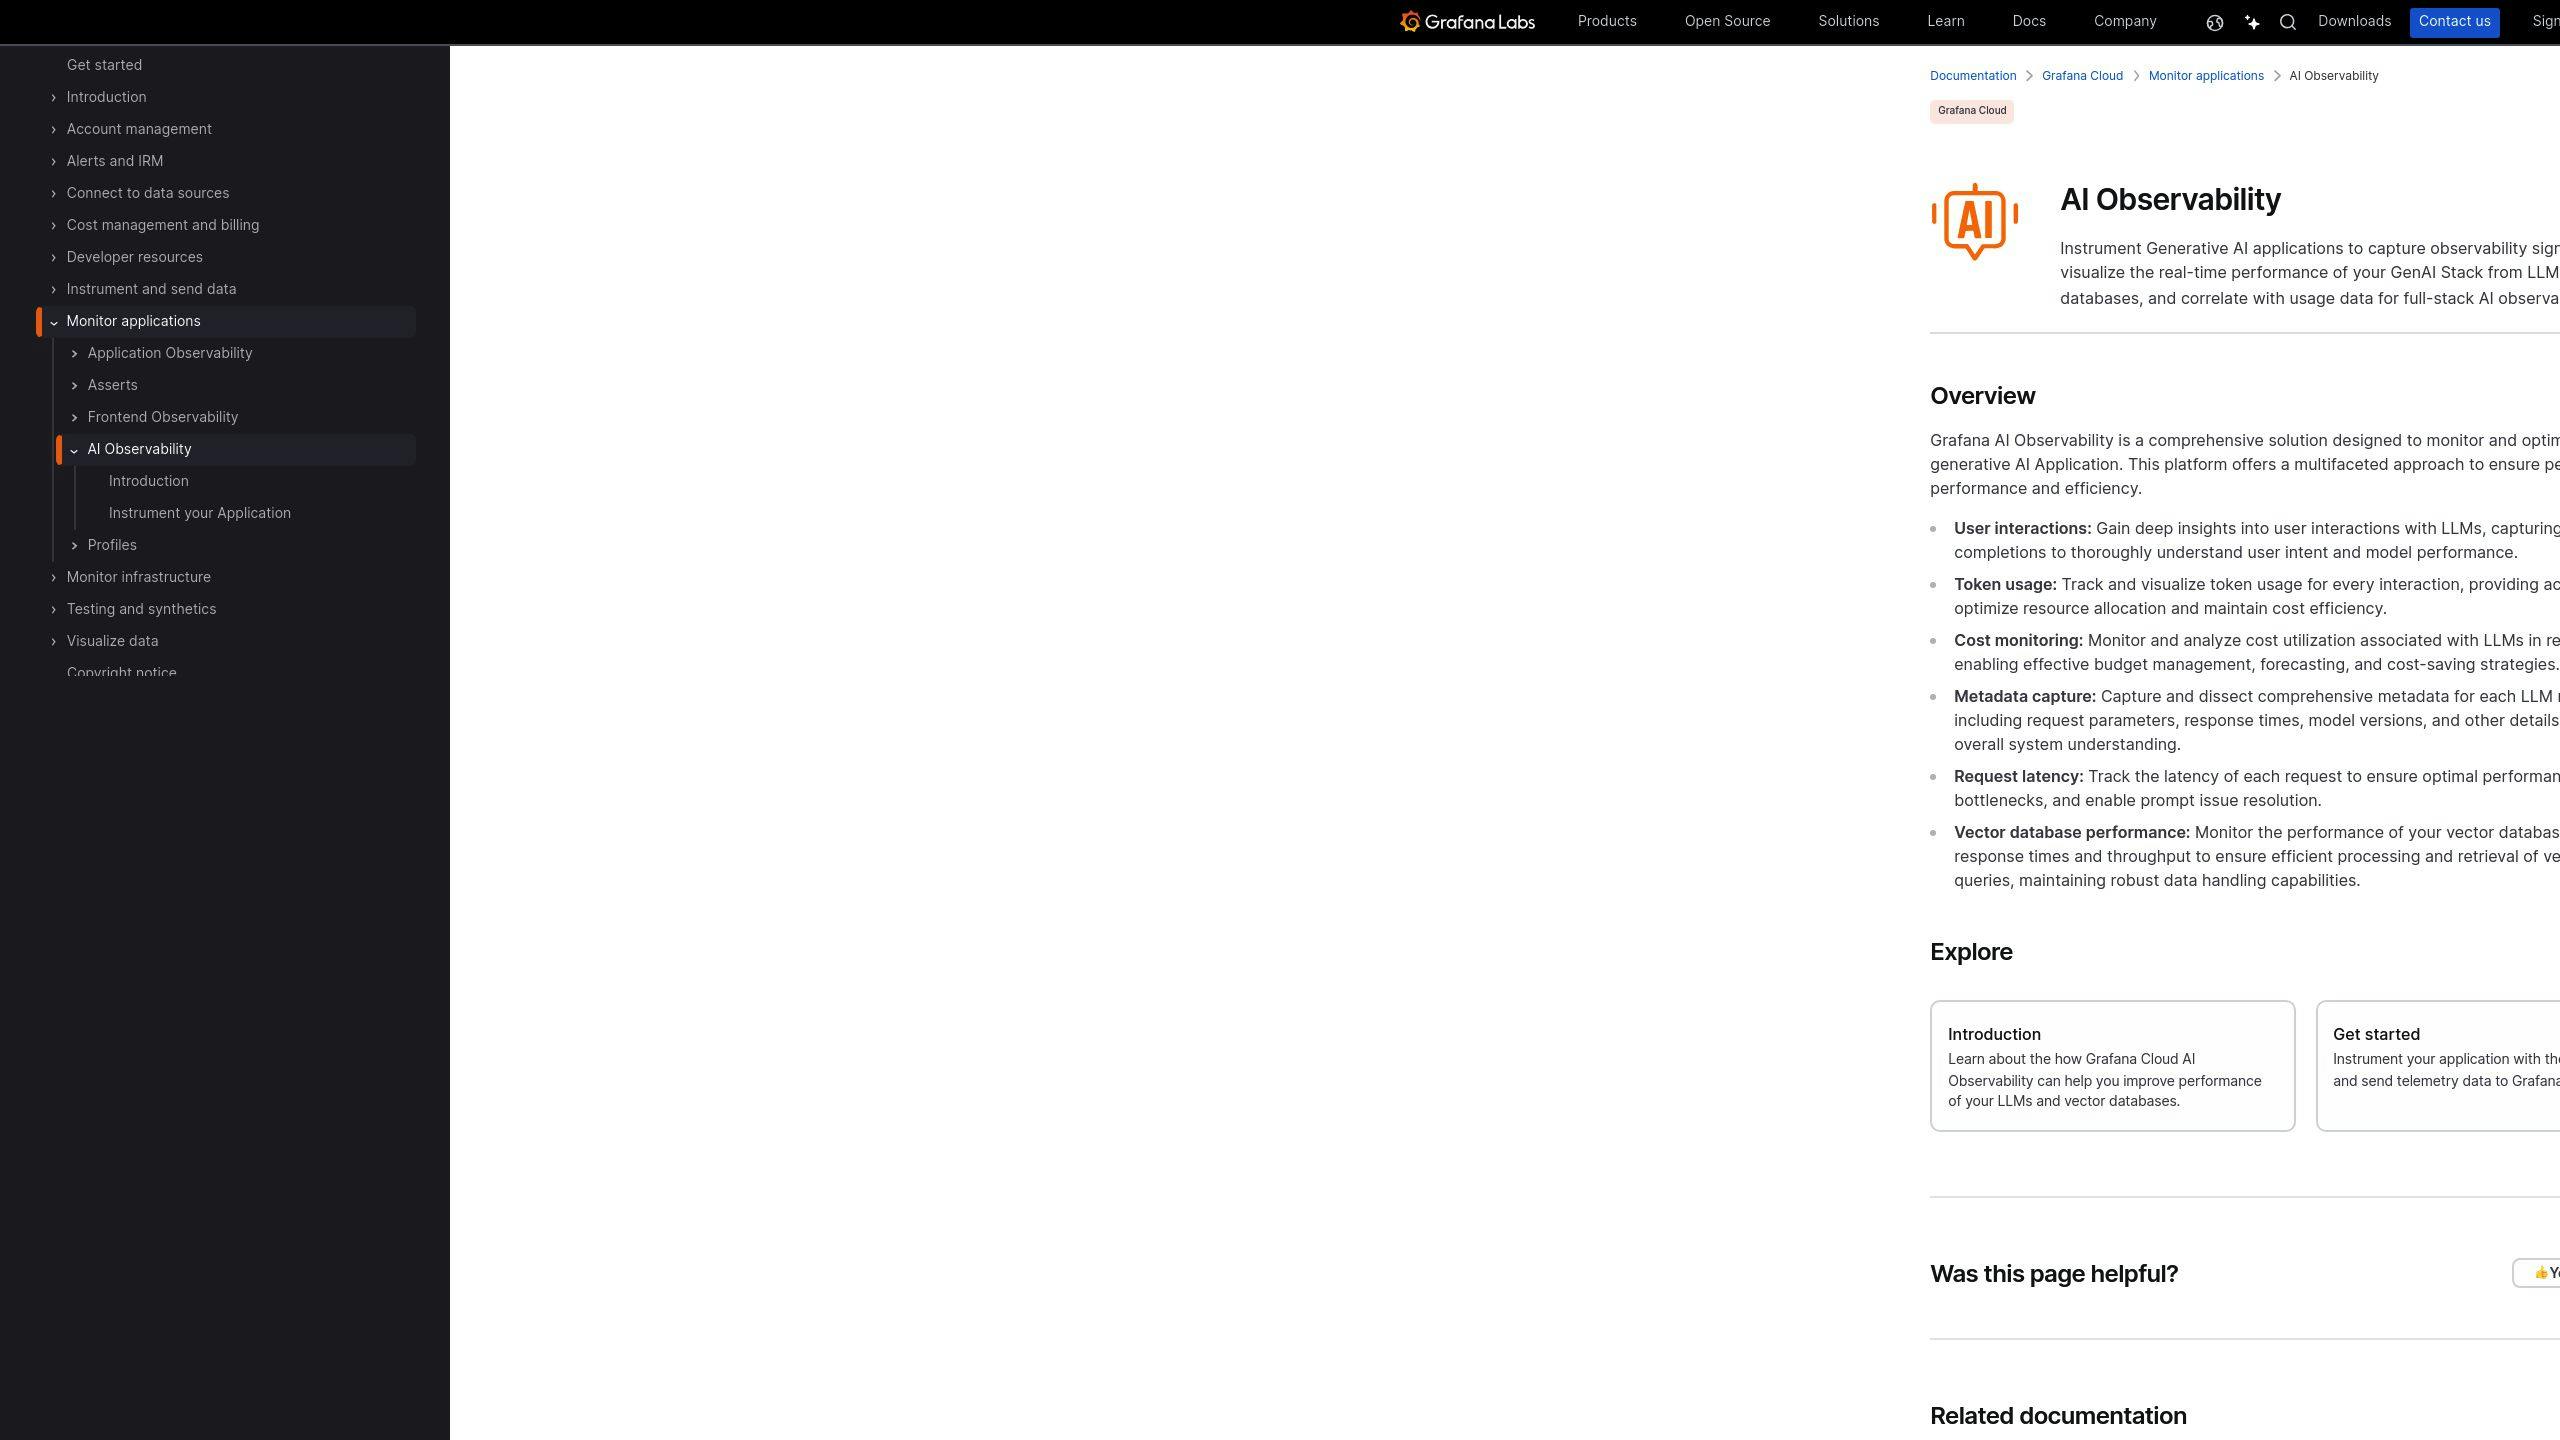
Grafana AI Observability

Grafana AI Observability is shaking up data monitoring. It's Grafana Labs' answer to making data management a breeze.
What's in the box?
- Open-source AI support (no vendor lock-ins)
- LLM plugin for AI-powered experiences
- OpenLIT SDK for monitoring LLMs
But it's not just fancy tech. It's about fixing real issues:
| Problem | Solution |
|---|---|
| High costs | Adaptive Metrics and Logs |
| Tricky data exploration | Explore Apps |
| Slow problem-solving | Sift diagnostic tool |
Let's break it down:
1. Adaptive Metrics and Logs
This feature is a money-saver. Just ask TeleTracking:
- Halved billable metrics
- Slashed log volume by 50%
- Cut overall costs by up to 33%
Andrew Qu from TeleTracking puts it this way:
"Adaptive Logs help reduce this noise, making it easier to spot valuable logs and ultimately saves us costs."
2. Explore Apps
These pre-built interfaces make data querying a snap. Now, even junior engineers can tackle tasks that used to need more experience.
3. Sift
This ML-powered tool sniffs out anomalies across metrics, logs, and traces. It even suggests fixes for log errors.
Grafana AI Observability keeps evolving, getting more user-friendly and cost-effective with each update.
sbb-itb-9890dba
2. Eyer.ai

Eyer.ai is an AI-powered observability platform for Boomi integrations. It's like a smart watchdog for your interconnected systems.
Here's what Eyer.ai brings to the table:
- Spots anomalies FAST
- Analyzes performance metrics
- Sends instant alerts
- Predicts future issues
Eyer.ai plays nice with Boomi:
"It's a breeze to set up. Just plug it in, and you're good to go. Plus, it comes with pre-built Boomi settings. No need to reinvent the wheel."
What's in it for you?
- Keep your integrations in check
- Nip problems in the bud
- Stay one step ahead of issues
- Simplify your monitoring setup
Bottom line: Eyer.ai makes complex integration monitoring a walk in the park. It's like having a crystal ball for your connected systems.
Strengths and Weaknesses
Let's compare Grafana AI Observability and Eyer.ai:
| Feature | Grafana AI Observability | Eyer.ai |
|---|---|---|
| Focus | General observability | Boomi monitoring |
| AI/ML | Adaptive Telemetry | Anomaly detection |
| Cost reduction | 35% avg metrics cost cut | Not specified |
| Ease of use | Steep learning curve | Easy, pre-built Boomi settings |
| Data sources | Multiple (Prometheus, InfluxDB) | Boomi-specific |
| Scalability | Handles big time-series data | Boomi integrations focus |
| Alerting | Built-in, basic | Instant alerts |
Grafana AI Observability is a powerhouse for broad applications. TeleTracking slashed billable metrics by 50% with Adaptive Metrics. Here's what Andrew Qu, their Software Engineer II, said:
"Adaptive Logs help reduce noise, making it easier to spot valuable logs and ultimately saves us costs."
But Grafana's not a walk in the park to learn.
Eyer.ai? It's laser-focused on Boomi integrations. Quick to set up, great at catching anomalies fast.
Both use AI for better observability, but in different ways. Grafana's for big, diverse setups. Eyer.ai's the Boomi specialist.
Choosing? Think about what you need. Running a complex, multi-source environment and can invest time learning? Grafana might be your jam. Boomi user wanting a no-fuss solution? Eyer.ai could be your ticket.
Wrap-up
Grafana AI Observability and Eyer.ai take different paths to data insights:
| Feature | Grafana AI Observability | Eyer.ai |
|---|---|---|
| Focus | Broad observability | Boomi-specific monitoring |
| AI Application | Adaptive Telemetry | Anomaly detection |
| Learning Curve | Steep | Quick, pre-configured |
| Cost Reduction | 35% average on metrics | Not specified |
Grafana's AI features pack a punch. TeleTracking slashed billable metrics and log volume by 50% with Adaptive Metrics and Logs. Andrew Qu from TeleTracking said:
"Adaptive Logs help reduce noise, making it easier to spot valuable logs and ultimately saves us costs."
Got a complex, multi-source setup and time to learn? Grafana AI Observability might be your best bet. It's built for large-scale operations and can save you serious cash.
But if you're all about Boomi and want a no-fuss solution, Eyer.ai's your go-to. It's quick to set up and laser-focused on Boomi integration monitoring.
Your choice boils down to your specific needs, tech skills, and how wide you want to cast your observability net.


