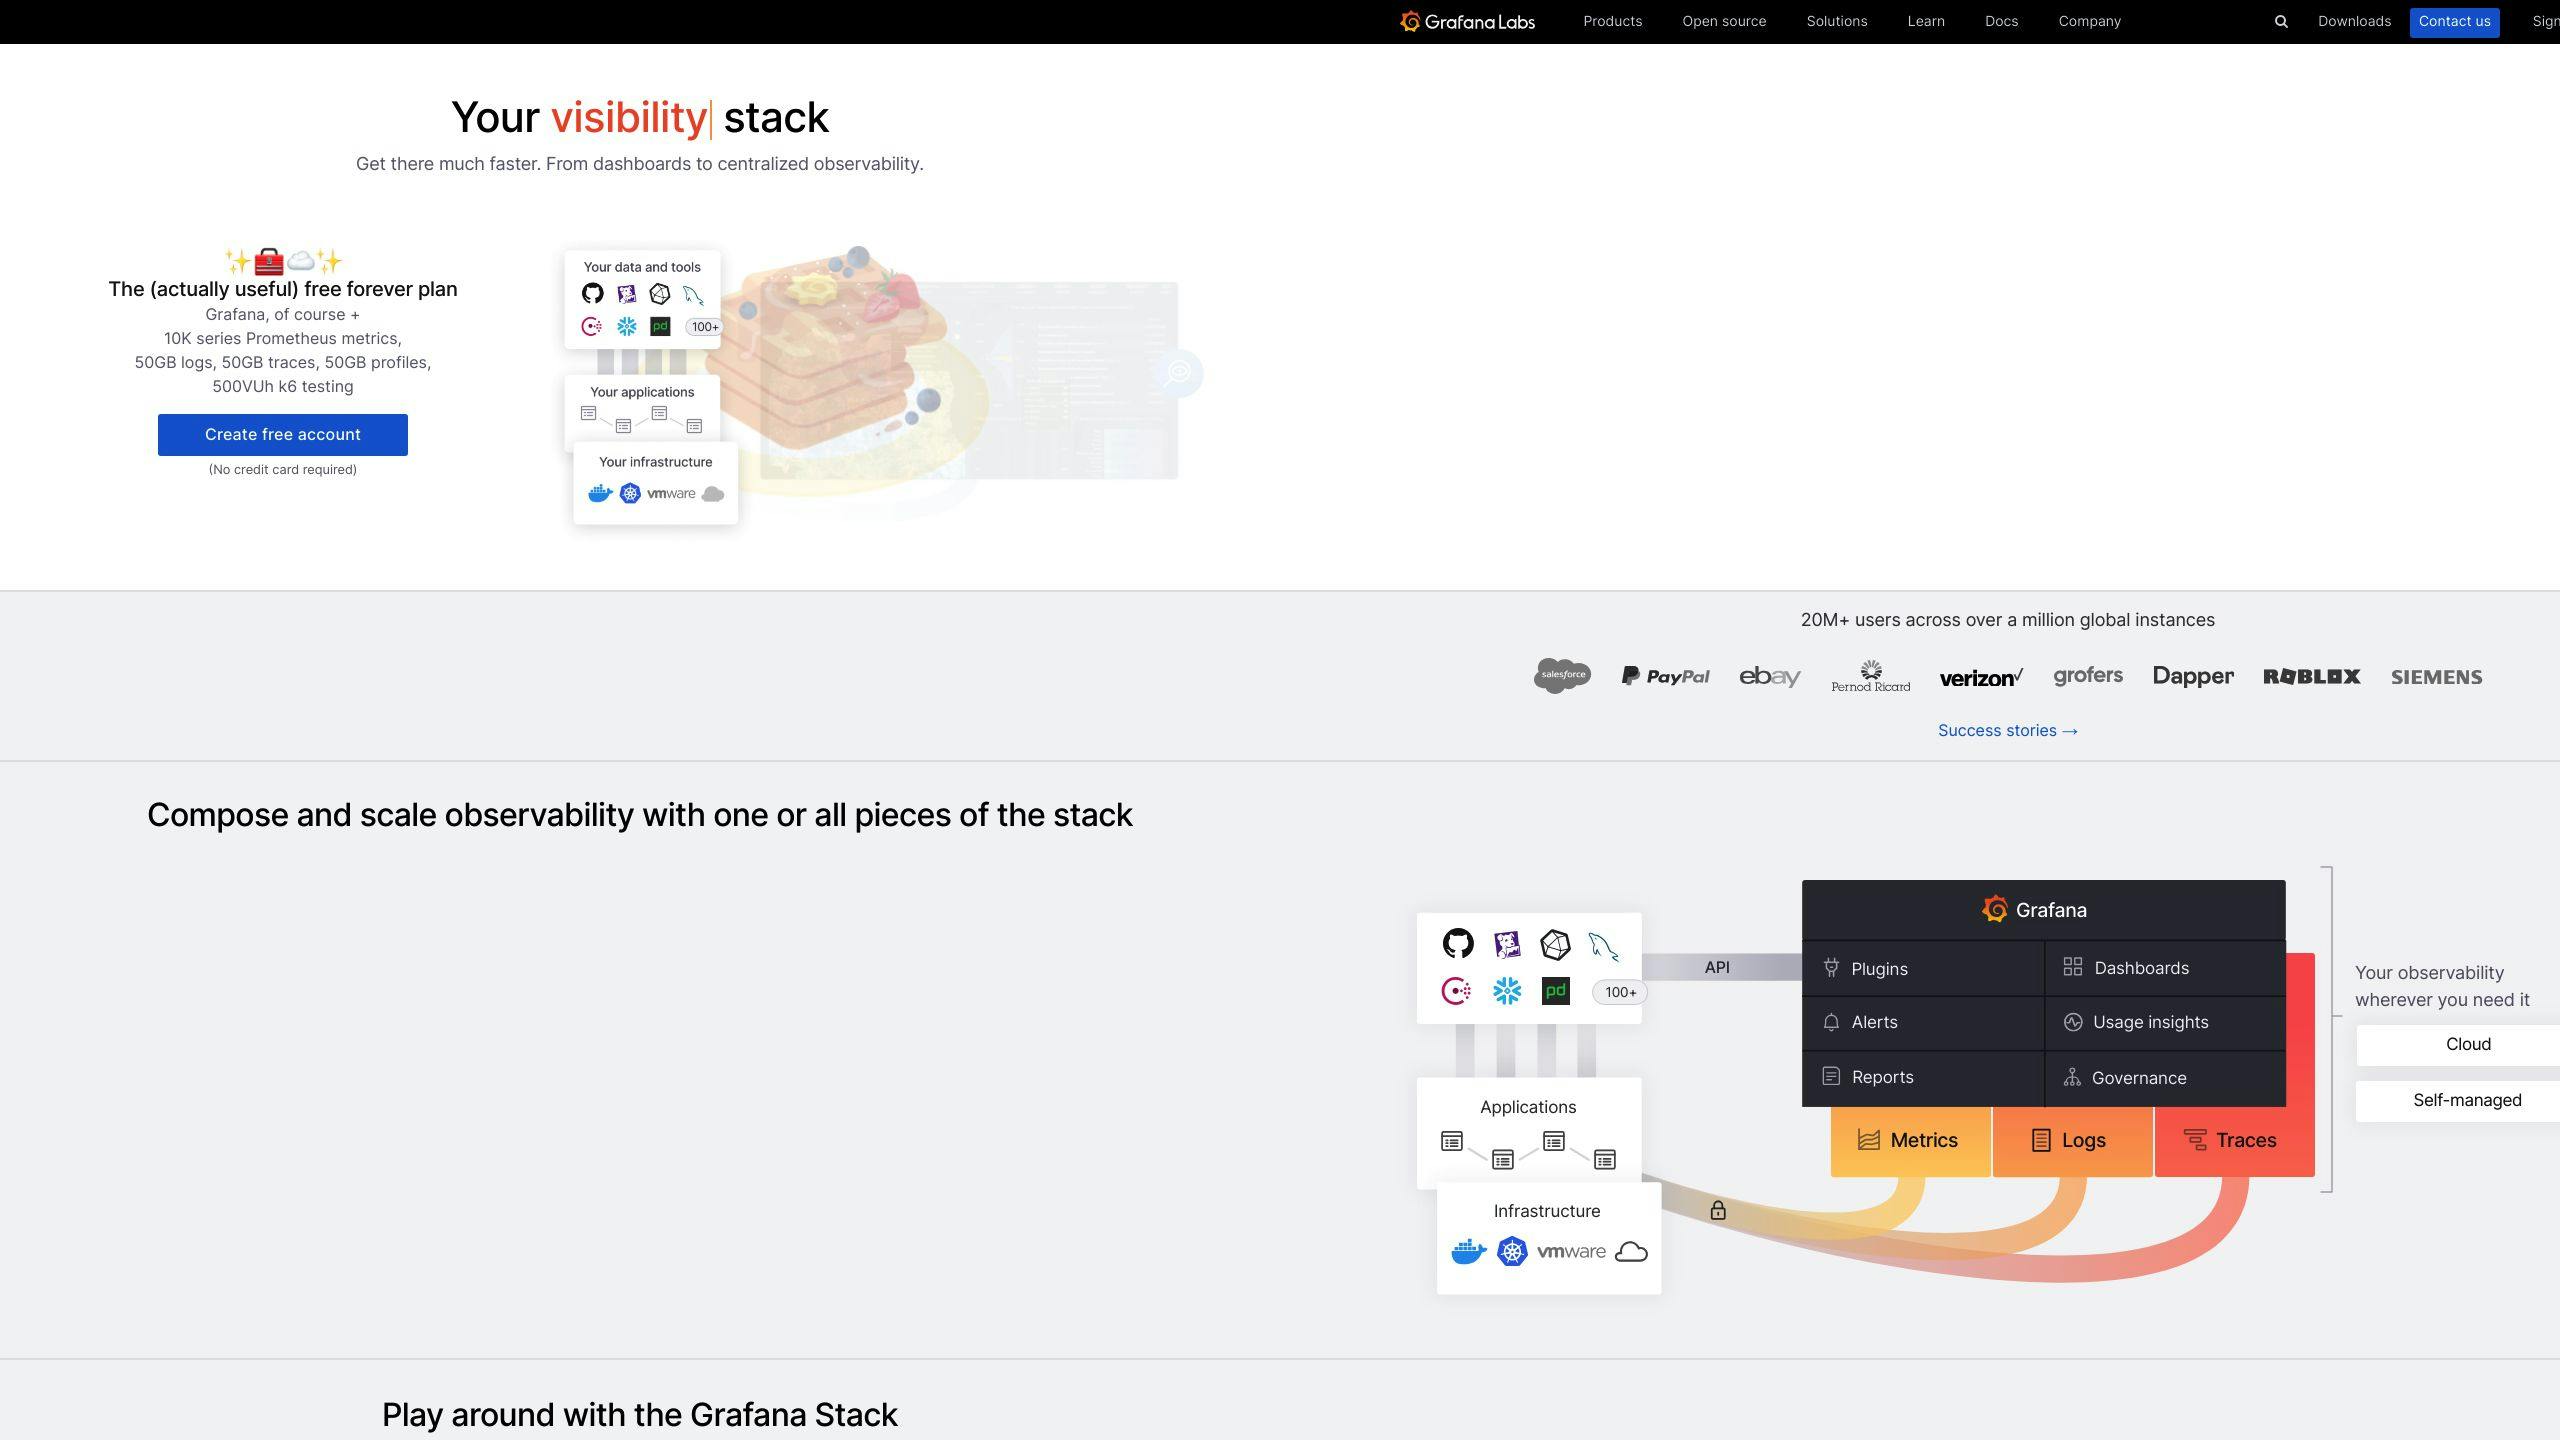
Eyer AIOps and Grafana team up to help IT teams see and manage their systems better. Here's what you need to know:
- Eyer AIOps uses AI to analyze IT data
- Grafana turns this data into easy-to-read visuals
- Together, they help spot and fix issues faster
Key benefits:
| Benefit | Description |
|---|---|
| Better visibility | See your whole IT system clearly |
| Real-time monitoring | Watch and fix problems as they happen |
| Smart analysis | Find patterns and predict issues |
| Easy-to-use dashboards | Understand complex data at a glance |
While this combo is powerful, it may be too much for small teams and costs more than Eyer AIOps alone. Consider your needs carefully before choosing.
Quick Comparison:
| Feature | Eyer AIOps | Eyer AIOps + Grafana |
|---|---|---|
| Data analysis | Yes | Yes |
| Visualization | Basic | Advanced |
| Ease of use | Moderate | High |
| Cost | Lower | Higher |
| Customization | Limited | Extensive |
| Learning curve | Moderate | Steeper |
Related video from YouTube
1. Eyer AIOps Standalone

Eyer AIOps uses AI and machine learning to help IT teams work better. Here's what it can do:
Performance Metrics
Eyer AIOps watches how different parts of IT systems are working:
| Area | What it does |
|---|---|
| Apps | Checks how well apps are running |
| Hardware | Keeps an eye on servers, storage, and networks |
| Network | Looks at network traffic to make it work better |
Real-Time Monitoring
Eyer AIOps watches things as they happen:
- Looks at logs and events to find problems
- Spots possible security threats
- Can fix some issues on its own
Data Interpretation
Eyer AIOps doesn't just watch; it helps understand what's happening:
| Feature | Benefit |
|---|---|
| Predicts issues | Helps stop problems before they start |
| Plans for growth | Helps figure out what you'll need in the future |
| Finds root causes | Helps fix problems faster by showing why they happened |
sbb-itb-9890dba
2. Eyer AIOps with Grafana Integration

When Eyer AIOps works with Grafana, it helps IT teams see and manage their systems better. Here's how:
Performance Metrics
Eyer AIOps and Grafana show how well things are working:
| What it shows | Examples |
|---|---|
| Infrastructure | How servers, storage, and networks are doing |
| Applications | If apps are healthy and fast |
| Custom views | Special dashboards for what you need |
User Experience
Using Grafana makes Eyer AIOps easier to use:
- Easy-to-read dashboards
- Pictures you can change to show what you want
- Updates that happen right away
Data Interpretation
Grafana helps make sense of Eyer AIOps data:
| What it does | How it helps |
|---|---|
| Makes charts | Turns complex info into simple pictures |
| Shows patterns | Helps you see important changes quickly |
| Helps decisions | Makes it easier to choose what to do next |
Real-Time Monitoring
Eyer AIOps and Grafana watch your systems all the time:
- Shows updates on screens as they happen
- Warns you when something's wrong
- Lets you look closer at specific parts
Good and Bad Points
Let's look at how Eyer AIOps works on its own and with Grafana:
| What We're Looking At | Eyer AIOps by Itself | Eyer AIOps with Grafana |
|---|---|---|
| Seeing What's Happening | Shows Boomi connections well | Shows more about complex systems |
| How Easy It Is to Use | Basic look | Easier to use with clear pictures |
| Understanding Data | Simple data checks | Better at showing patterns |
| Watching in Real Time | Limited real-time views | Full real-time watching with quick updates |
| Making It Your Own | Few options to change things | Lots of ways to make it look how you want |
| How Hard It Is to Learn | Takes some time to learn | Takes more time to learn because of extra tool |
| How Much It Costs | Costs less to start | Costs more because of extra software |
Good Things About Eyer AIOps with Grafana
- Sees More: Shows more about how your whole system is working.
- Easier to Use: Makes it simpler to see and work with your data.
- Better Pictures of Data: Turns hard-to-understand info into easy-to-read pictures.
- Watches All the Time: Lets you see and fix problems right away.
Not-So-Good Things About Eyer AIOps with Grafana
- More Complicated: Adding Grafana makes things a bit harder to set up and use.
- Costs More: You have to pay for both Eyer AIOps and Grafana.
- Might Be Too Much: If your system is small, you might not need all the extra features.
When thinking about using Eyer AIOps with Grafana, look at what your team needs and can handle. It's great for seeing more, but it might be too much for some groups.
Wrap-up
Eyer AIOps and Grafana working together make IT management better. Here's what they do:
| Feature | Benefit |
|---|---|
| See more | Shows how your whole IT system is working |
| Watch in real-time | Helps find and fix problems quickly |
| Show data clearly | Makes complex information easy to understand |
While this combo is helpful, it's important to think about:
| Good Points | Not-So-Good Points |
|---|---|
| Better system watching | Harder to set up |
| Easier to spot issues | Costs more money |
| Helps prevent problems | Might be too much for small teams |
As AIOps gets better, we can expect:
- Easier-to-use tools
- More automatic fixes
- Better handling of different IT setups
If you're thinking about using Eyer AIOps with Grafana:
- Look at what your team needs
- Think about how much work it will take to set up
- Make sure it fits with your current tools


