Looking for Datadog alternatives? Here's what you need to know:
- Datadog is popular but can be costly and complex
- Top alternatives include New Relic, Prometheus, Grafana, and Dynatrace
- Free options like Zabbix, Nagios, and Icinga are available
- Cloud providers offer their own tools (AWS CloudWatch, Google Cloud Monitoring, Azure Monitor)
Key factors to consider:
- Scalability
- Compatibility
- Cost
- Security
- Customization
| Tool | Focus | Pricing | Open Source |
|---|---|---|---|
| Datadog | Full-stack monitoring | Usage-based | No |
| New Relic | APM, observability | Data ingestion & users | No |
| Prometheus | Metrics & alerting | Free | Yes |
| Grafana | Visualization | Free & paid | Yes |
| Dynatrace | AI-powered monitoring | From $74/8GB/host | No |
| Zabbix | Network & IT monitoring | Free | Yes |
To implement a new solution:
- Run thorough tests
- Train your team
- Roll out features gradually
Choose the tool that fits your needs and budget.
Related video from YouTube
What are Monitoring Solutions?
Monitoring solutions track IT system health, performance, and availability. They collect and analyze data to help maintain optimal operations.
Key components:
- Sensors: Collect infrastructure data
- Analytics: Process collected data
- UI: Display results in dashboards/reports
These tools gather metrics to ensure systems function properly and help quickly detect and resolve issues.
Monitoring types:
| Type | Description |
|---|---|
| Infrastructure | Tracks servers, networks, storage |
| APM | Observes application behavior |
| Network | Analyzes network performance |
| Security | Detects potential threats |
| Cloud | Oversees cloud resources |
Cloud tech has changed monitoring:
- Tools must handle rapid scaling
- Monitoring covers multiple cloud environments
- Increased automation
- Focus on cloud cost management
As IT grows more complex, effective monitoring becomes crucial. Organizations often use multiple tools to cover various aspects of their IT landscape.
Reasons to Look Beyond Datadog
While popular, some organizations seek Datadog alternatives due to specific challenges:
Common Datadog Issues
-
Cost Escalation: Pricing can become burdensome as organizations scale
- Log costs: $0.10 for ingestion, up to $2.50 for 30-day retention
- Many startups face big cost jumps as they grow
-
Data Limitations: Restrictions on data ingestion and retention
- Can hinder long-term troubleshooting
-
Complexity: Users struggle with learning curve and setup
- Common errors: hostname detection, API key configuration
Alternative Tool Advantages
-
Cost-Effective Options:
- ChaosSearch: Starts at $0.30/GB for unlimited retention
- MetricFire: Budget-friendly monitoring
- User-Friendly: Tools like MetricFire offer simpler interfaces
- Flexible Data Retention: Some allow longer retention without steep costs
- Enhanced Integration: Tools can complement Datadog's functionality
"ChaosSearch can complement Datadog by centralizing logs with unlimited retention at a fraction of the cost."
Key Monitoring Tool Features
When choosing monitoring tools, focus on these areas:
Live Data Collection
- Continuous data collection from all system parts
- Real-time dashboard updates
- Instant anomaly alerts
Example: SolarWinds Network Performance Monitor tracks bandwidth and packet loss in real-time.
Alert Systems
Effective alerts should:
- Be customizable
- Notify the right people via various channels
- Allow different urgency levels
Atera's platform sends real-time alerts about potential incidents.
Flexible Dashboards
The best dashboards:
- Allow customization for different roles
- Show key metrics at a glance
- Enable easy data exploration
Dashboard comparison:
| Tool | Customization | Visualization | User-Friendliness |
|---|---|---|---|
| Datadog | High | Advanced | Moderate |
| New Relic | Moderate | Good | High |
| Prometheus | High | Basic | Low |
| Grafana | Very High | Excellent | Moderate |
Main Datadog Alternatives
Let's examine four key Datadog alternatives:
New Relic
New Relic offers comprehensive APM and real-time monitoring:
- Detailed app performance insights
- Infrastructure monitoring (cloud, on-premises, hybrid)
- Real user and synthetic monitoring
- Customizable dashboards
Popular in e-commerce and finance for maintaining digital service efficiency.
| Feature | New Relic | Datadog |
|---|---|---|
| APM | Yes | Yes |
| Infrastructure | Yes | Yes |
| User Monitoring | Yes | Yes |
| Synthetic | Yes | Yes |
| Dashboards | Yes | Yes |
| Pricing | Usage-based | Per-host |
Prometheus
Open-source monitoring focused on metrics collection:
- Scrapes metrics from endpoints
- Basic alerting
- Lightweight design
- Active community
Cost-effective but may need more maintenance resources.
| Aspect | Prometheus | Datadog |
|---|---|---|
| Open-source | Yes | No |
| Scalability | Challenging | Built-in |
| Visualization | Third-party | Built-in |
| Alerting | Basic | Advanced |
Grafana
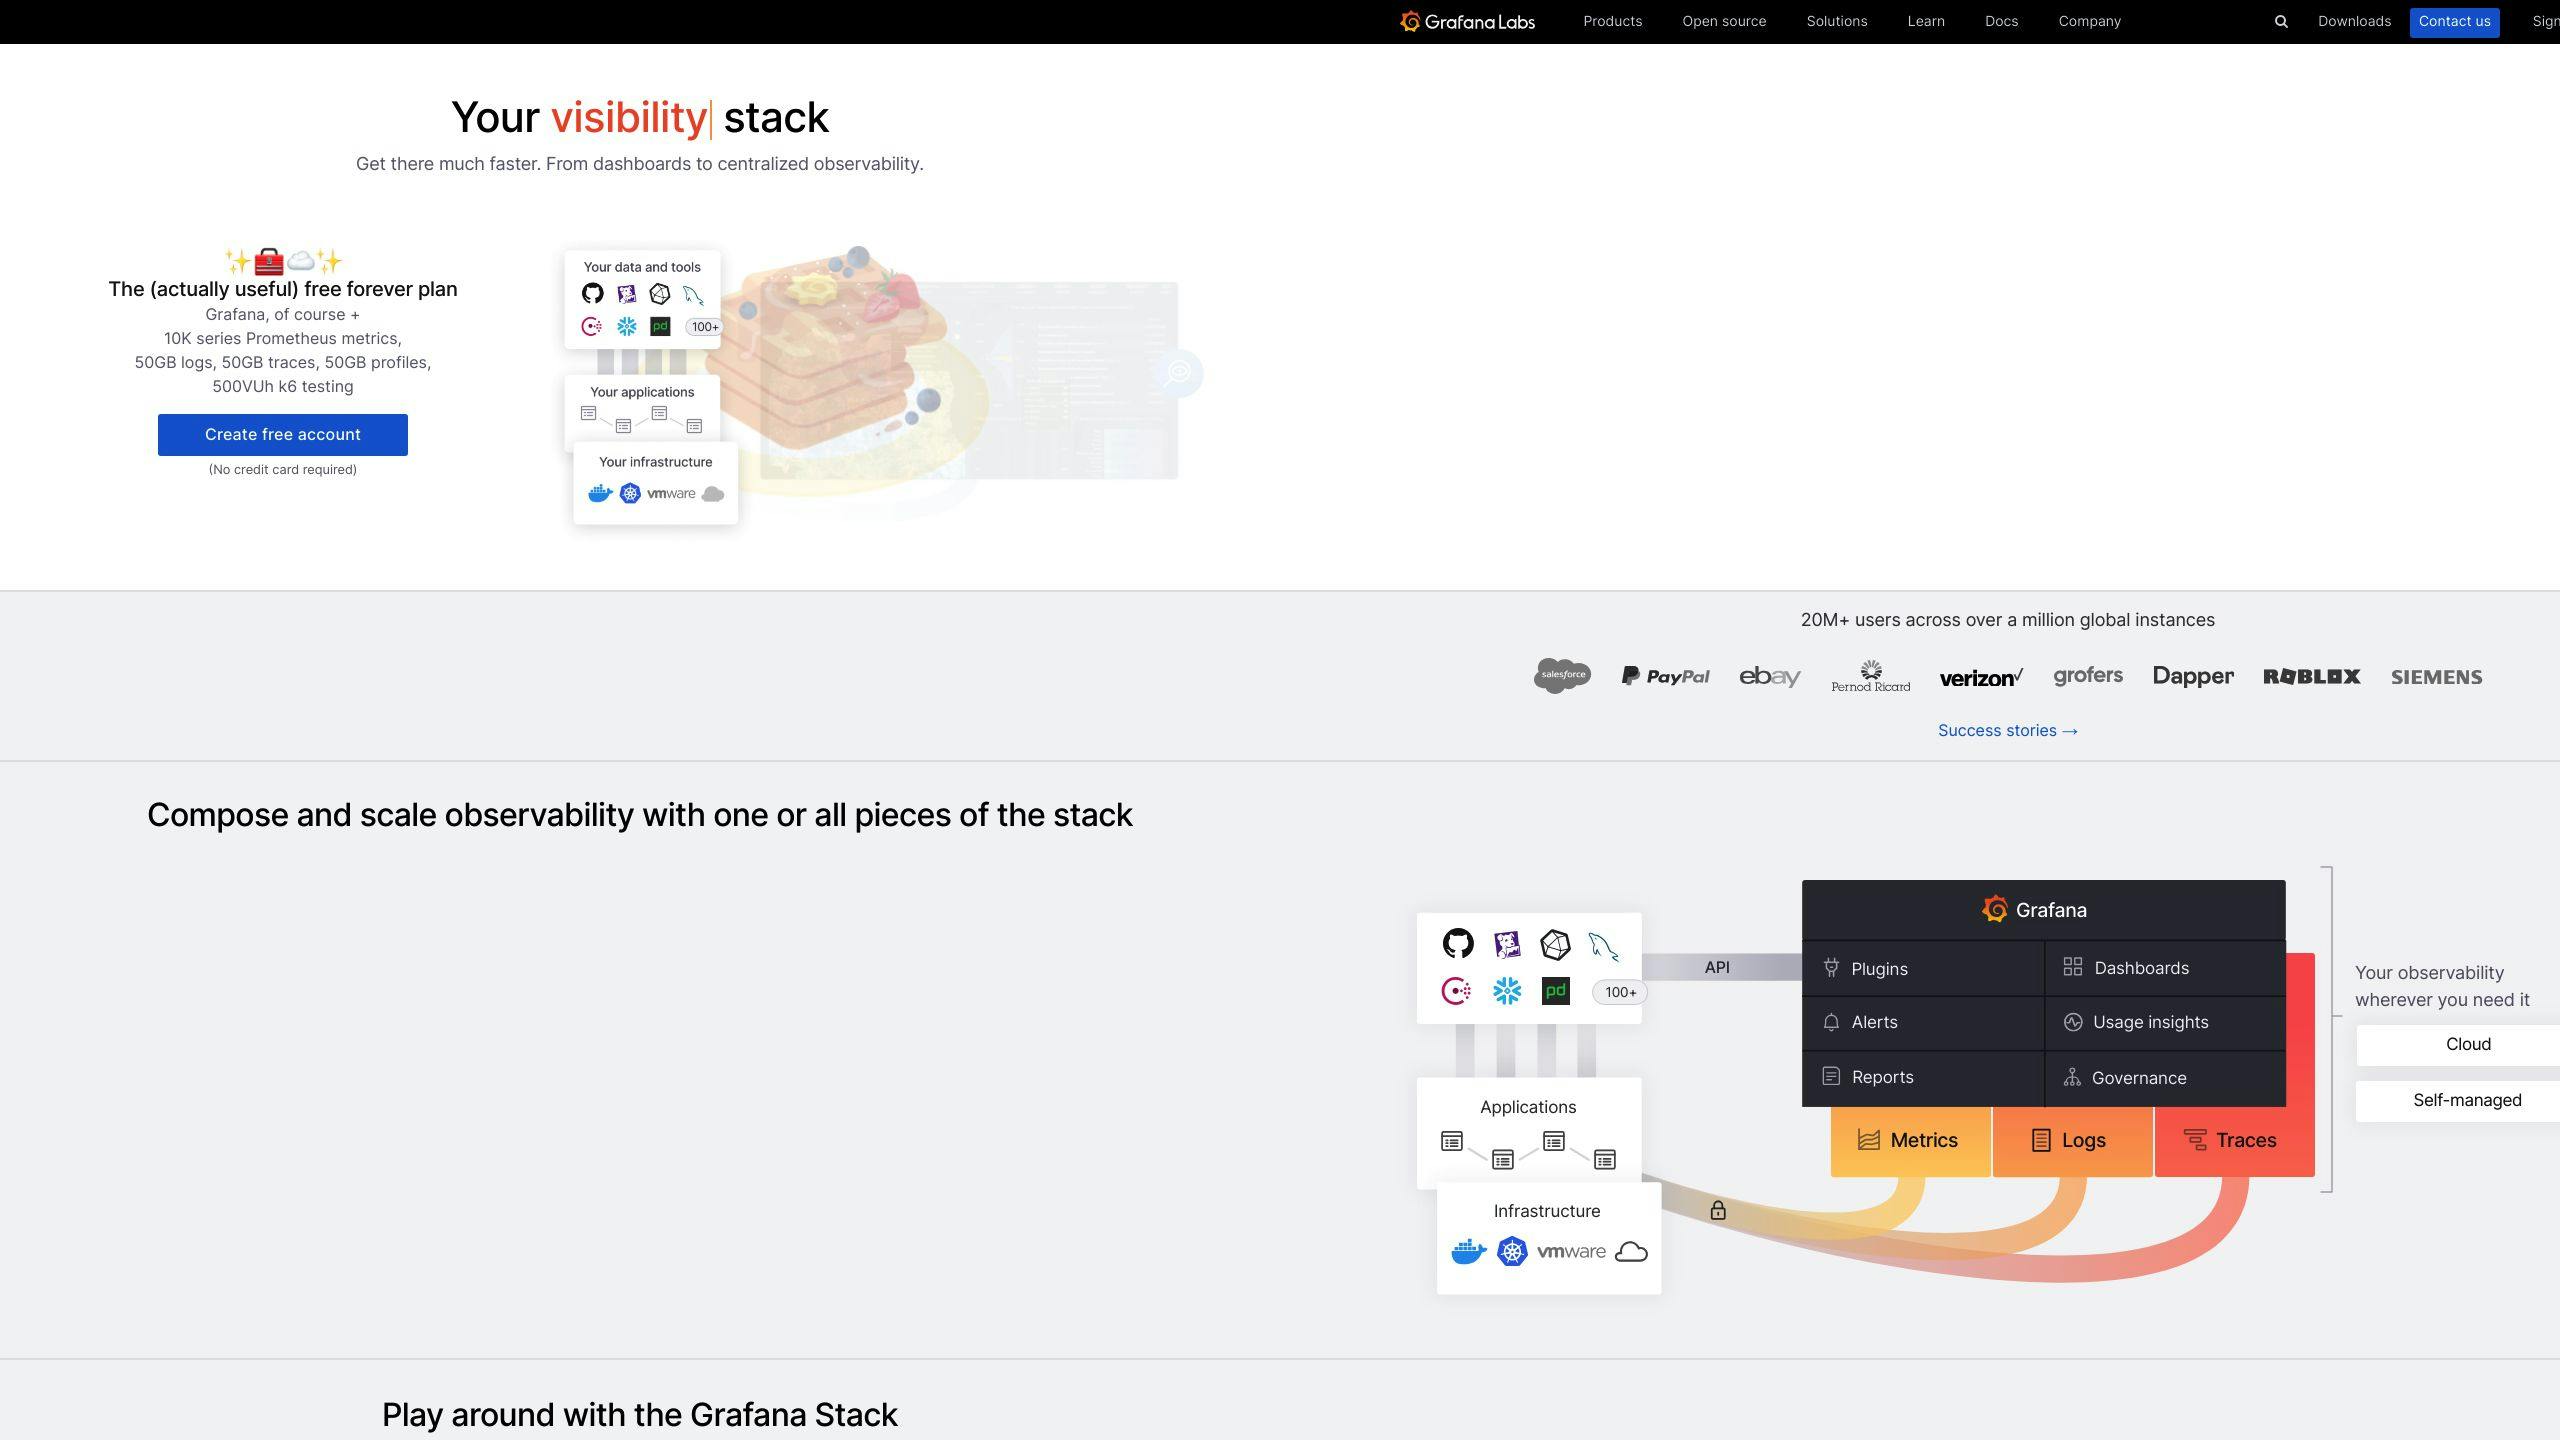
Open-source visualization and analytics platform:
- Multiple data source support
- Highly customizable dashboards
- Extensive plugin ecosystem
- Open-source and managed options
Ideal for flexible, scalable visualization needs.
| Feature | Grafana | Datadog |
|---|---|---|
| Data Sources | Extensive | Limited |
| Customization | High | Moderate |
| Managed Service | Optional | Yes |
| Focus | Visualization | Full-stack |
Dynatrace

Full-stack monitoring for cloud, hybrid, and on-premises:
- OneAgent for detailed data collection
- PurePath for transaction visibility
- Smartscape for component dependencies
- Davis AI for predictive analytics
AI-powered approach suits complex IT environments.
| Capability | Dynatrace | Datadog |
|---|---|---|
| AI analysis | Yes (Davis) | Limited |
| Dependency mapping | Yes (Smartscape) | Basic |
| Transaction tracing | Yes (PurePath) | Yes |
| Tech support | Wide range | Extensive |
Consider your needs, expertise, and budget when evaluating these options.
sbb-itb-9890dba
Free and Open-Source Options
For cost-cutting or more control, consider these free and open-source Datadog alternatives:
Zabbix
Robust, open-source monitoring system:
- Client-server architecture
- Various data collection methods (SNMP, JMX, IPMI)
- Real-time graphing
- Customizable alerts
Useful for diverse IT infrastructures.
| Feature | Zabbix | Datadog |
|---|---|---|
| Cost | Free | Paid |
| Installation | Self-hosted | SaaS |
| Scalability | Moderate | High |
| UI | Web-based | Web-based |
| Learning Curve | Steep | Moderate |
Nagios
Flexible, open-source monitoring with extensive plugins:
- Core 4 engine for scalability
- Proactive infrastructure management
- Customizable alerts
- Large community and plugin library
Suited for complex IT environments.
| Aspect | Nagios | Datadog |
|---|---|---|
| Cost | Free (Core), Paid (XI) | Paid |
| Customization | High | Moderate |
| Plugins | Extensive | Limited |
| Ease of Use | Complex | User-friendly |
| Reporting | Basic (Core), Advanced (XI) | Advanced |
Icinga
Powerful monitoring solution (Nagios fork):
- Automated ticket incidents and alerts
- Windows and Linux oversight
- Intuitive web interface
- API and Ansible integration
Good for managed service providers and automated incident management.
| Feature | Icinga | Datadog |
|---|---|---|
| Cost | Free | Paid |
| Automation | High | High |
| UI Customization | Moderate | High |
| Integration | Extensive | Extensive |
| Support | Community | Company-backed |
Consider your technical expertise and resources when choosing open-source tools.
Cloud Provider Monitoring Tools
Cloud providers offer monitoring solutions tailored to their platforms:
Amazon CloudWatch
AWS's built-in monitoring service:
- Real-time AWS resource monitoring
- Log management and analysis
- Customizable dashboards and alerts
Volume-based pricing with a free tier.
| Feature | Description |
|---|---|
| Metrics | Auto-collects from AWS services |
| Logs | Aggregates and searches logs |
| Alerts | Sets thresholds-based alarms |
| Dashboards | Creates metric visualizations |
Google Cloud Monitoring
Seamless integration with Google Cloud:
- Out-of-the-box metric dashboards
- Hybrid and multi-cloud support
- Managed metrics for GKE and VMs
Included with Google Cloud projects at no extra cost.
Azure Monitor

Comprehensive Azure monitoring:
- Strong PaaS service monitoring
- Application and infrastructure oversight
- Integration with other Azure services
| Aspect | Azure Monitor | CloudWatch | Google Cloud Monitoring |
|---|---|---|---|
| Platform | Azure | AWS | Google Cloud |
| PaaS Support | Strong | Limited | Strong |
| Learning Curve | Steeper | Moderate | Moderate |
| Cost | Usage-based | Volume-based | Included with GCP |
Consider your primary cloud platform when choosing a provider-specific tool.
Comparing Datadog Alternatives
Key comparisons of Datadog alternatives:
Dynatrace vs Datadog
| Feature | Dynatrace | Datadog |
|---|---|---|
| Focus | AI-powered APM and security | Cloud infrastructure and security |
| APM | Advanced | Limited |
| Infrastructure Agent | Auto-scanning | Manual config |
| Incident Management | Basic | Comprehensive |
| Log Management | UI-configurable | Manual setup |
| Pricing | From $74/8GB/host | Complex SKU-based |
Dynatrace offers better APM but at a higher cost.
New Relic vs Datadog
| Aspect | New Relic | Datadog |
|---|---|---|
| UI | More intuitive | Some usability issues |
| Documentation | Better organized | Well-written but scattered |
| Free Tier | 100GB/month | Not available |
| Pricing | Data ingestion and users | Complex SKU-based |
| Cloud SIEM | No | Yes |
| User Monitoring | More comprehensive | Limited |
New Relic's pricing can reach $549/user/month for enterprise plans.
Zabbix (Open-Source)
Free solution with agent-based and agentless monitoring. Highly scalable but complex configuration.
Cloud Provider Tools
| Tool | Key Features | Pricing |
|---|---|---|
| CloudWatch | AWS resource monitoring, logs | Volume-based, free tier |
| Google Cloud Monitoring | Out-of-box metrics, hybrid support | Included with GCP |
| Azure Monitor | Comprehensive PaaS, mixed environments | Usage-based |
Tight platform integration but may lack cross-platform capabilities.
Consider your needs, budget, and technical requirements when choosing.
Choosing the Right Tool
To pick the best monitoring tool:
Assess Your Needs
- Network size
- Technology stack
- User volume
- Transaction complexity
Evaluate Costs
| Factor | Consideration |
|---|---|
| Total ownership cost | Include licensing, setup, maintenance |
| Hidden costs | Look for extra charges |
| ROI | Assess value in performance and uptime |
Free tools often have limited features.
Identify Technical Needs
- Full-stack observability
- Scalability
- Integration capabilities
- Customization options
Request a full-scale test version before committing.
Implementing New Tools
To smoothly transition to a new monitoring tool:
Test Runs
- Start small
- Use staging environments
- Validate outputs
Run parallel tests to fine-tune before full switch.
Training and Adoption
| Aspect | Description |
|---|---|
| Skill assessment | Identify training needs |
| Workshops | Provide hands-on sessions |
| Documentation | Create clear guides |
| Feedback | Establish user input system |
Encourage adoption:
- Show benefits
- Roll out gradually
- Use peer champions
Create a transition team to smooth the process.
Conclusion
Choosing the right monitoring tool is crucial. Consider:
- Scalability
- Compatibility
- Cost-effectiveness
- Security
- Customization
Assess your needs, test options, and involve your team. For implementation:
- Run thorough tests
- Train comprehensively
- Roll out features gradually
The best tool depends on your specific requirements.