Grafana is a powerful tool for DevOps teams, helping to monitor, visualize, and understand the vast amount of data generated by their systems and applications. Here's what you need to know:
- Central Monitoring: Grafana consolidates data from various sources like Prometheus, Loki, and more into customizable dashboards.
- Data Visualization: It transforms raw data into understandable charts and graphs, making it easier for teams to analyze.
- Alerting: Grafana sends out alerts when metrics hit certain thresholds, allowing for quick problem resolution.
- Collaboration: Sharing dashboards and data views enhances team communication and problem-solving.
- Integration: Works well with a range of DevOps tools, improving monitoring and observability across your tech stack.
Whether you're monitoring Kubernetes at scale, analyzing CI/CD pipelines, or ensuring your infrastructure is running smoothly, Grafana offers the features and flexibility to keep your operations on track.
What is Grafana?

Grafana lets you create easy-to-understand dashboards that show data from different places like Prometheus, Elasticsearch, and more. It's great for:
- Watching your system and software in real-time to see how they're doing
- Getting alerts when things aren't working right
- Marking important events on your data charts
- Connecting with many databases and services
- Making custom visual charts
- Setting up dashboards that change based on what you're looking for
- Controlling who can see or do what
In short, Grafana helps you keep everything in one spot so you can watch, understand, and react to your data easily.
Grafana's Role in DevOps
Grafana helps out a lot in the whole DevOps process:
Continuous Integration & Delivery
- It links code changes and deployments with data so you can see how changes affect things
- Helps make standard dashboards for different settings
- Keeps an eye on the process of making and releasing software to spot problems early
Infrastructure & Application Monitoring
- Lets you see data from your servers, services, and more in real-time
- Puts logs, traces, and metrics together in one place
- Sends alerts to let you know when things aren't working as they should
Collaboration
- Makes it easy to share dashboards and data with your team
- Allows you to add notes on graphs to explain what's happening
- Lets you schedule and share reports on how things are going
In a nutshell, Grafana's tools for showing data and sending alerts are super helpful for DevOps teams. They help keep an eye on everything, understand what's going on, and work together better. It works well with other DevOps tools like Prometheus, Elasticsearch, Kubernetes, etc., to give a full picture based on data.
Setting Up Grafana for DevOps
Prerequisites
Before you get started with Grafana in a DevOps setup, you need to have a few things ready:
- Server OS: Grafana works on Linux, Windows, and macOS. Linux is usually the go-to for most setups.
- Web server: You'll need a web server like Apache or Nginx to get Grafana up and running.
- Database: Grafana uses databases like MySQL, PostgresSQL, SQLite, or Microsoft SQL Server to keep track of all your dashboards and info.
- Access rights: Make sure the account setting up Grafana can get into and change files where Grafana is going to be installed.
Also, think about:
- How much computer power and memory you have for Grafana and its databases.
- Making sure your network lets Grafana use its needed ports, especially port 3000 for the Grafana UI.
- Ensuring Grafana and its database can talk to each other quickly and without issues.
Installation & Configuration
Here’s how you can get Grafana set up:
- Docker: For a quick test or dev setup, grab the Grafana Docker image and run it. Remember to set up storage so you don’t lose data.
- Binary: For real use, download the Grafana binaries for Linux or Windows, or use a package manager.
- Source: If you want the latest features, you can build Grafana from its source code.
First steps to get going:
- Check the config file (
grafana.inior use environment variables) and tweak settings for your setup. This includes where to store data, server details, and logging info. - Start the Grafana server. - Head over to the Grafana web UI by going to http://:3000 in your browser.
- Change the default admin password.
- Add your data sources like Prometheus for metrics or Elasticsearch for logs.
- Make your dashboards.
- Set up user accounts, what they can do, and how Grafana will tell you when things go wrong.
- Make sure your dashboards stay put even if you restart Grafana.
And that’s it! With these steps, Grafana is all set up and ready to help you keep an eye on your apps and infrastructure.
Integrating Grafana with DevOps Tools
Grafana works well with a bunch of tools that DevOps teams love, helping them see and understand everything happening in their systems. By connecting Grafana with these tools, teams can get a full view of their tech stack, combining different types of data like metrics, logs, and more.
Common DevOps Tools
Here are some tools that Grafana can connect with:
- Prometheus - This tool keeps track of metrics and sends alerts. Grafana can show these metrics in a way that's easy to understand.
- Loki - Loki gathers logs, and Grafana can show these logs, making it easier to see how they match up with other data.
- Docker - Grafana can keep an eye on Docker containers, showing how much resources they're using.
- Kubernetes - With Grafana, you can watch over your Kubernetes clusters, pods, and more, making sure everything's running smoothly.
- Terraform - Grafana can display what's happening with your Terraform runs, like how long things take and if there's any drift.
- Datadog - If you're sending metrics to Datadog, Grafana can also show those, giving you more options for monitoring.
- New Relic - You can use Grafana to look at data from New Relic, thanks to special plugins.
Practical Examples
Let's look at how to combine Grafana with some of these tools:
Prometheus + Grafana
- First, set up a Prometheus server to collect data.
- Then, tell Grafana about Prometheus so it can use that data.
- Create visual boards in Grafana to show what's happening with your metrics.
- You can also set up alerts in Grafana based on what Prometheus is telling you.
Loki + Promtail + Grafana
- Put Promtail on your servers to gather logs.
- Send those logs to Loki.
- Connect Loki to Grafana so you can see your logs there.
- Now, you can look at your logs and metrics together, making it easier to figure out what's going on.
Kubernetes + Prometheus Operator + Grafana
- Use Prometheus Operator in your Kubernetes cluster to keep an eye on things automatically.
- Grafana will work with the Prometheus that the operator sets up.
- Now, you can make dashboards in Grafana to watch over your Kubernetes resources, using data from Prometheus.
Advanced Grafana Capabilities
Grafana is packed with features that help you keep a close eye on your systems and make your dashboards work better.
Monitoring & Visualization
Grafana lets you watch over your tech and turn data into easy-to-read charts:
- Dashboard tools - You can see important info like metrics, logs, and more on panels. You can also customize how graphs look.
- Quick data checks - The Explore feature lets you dig into data that's not on your dashboards, great for solving problems.
- Unique charts - You can make your own types of charts or add new ones from others for more specific needs.
- Notes on charts - You can mark important updates or events on your graphs to help your team stay on the same page.
- Dashboard templates - Create dashboards that can change based on what you're looking for, saving you time.
- Big screen mode - Show your dashboards on big screens in control rooms or offices to keep everyone updated.
Grafana is really good at helping you keep track of everything from servers to business numbers with real-time updates and easy ways to look at your data.
Alerts & Notifications
Setting up alerts in Grafana is pretty straightforward:
- When things go off track - You get an alert when your data goes above or below what you expect.
- Custom alerts - You can send alerts to more places with custom setups.
- Connect alert rules - Link different alerts together for better control or to cut down on unnecessary alerts.
- Alert templates - Make common alerts once and use them in many dashboards.
- Quiet times - Set times when alerts won't bother you, like during system updates.
Grafana's alert system helps your team find and fix problems fast with flexible alert options and ways to let you know what's happening.
Dashboard Best Practices
Here are some tips for making better Grafana dashboards:
- Name your dashboards clearly and use tags to keep them organized.
- Keep related info together but separate different topics into their own dashboards.
- Don't make your dashboards too wide; it makes them harder to read.
- Use templates so you can easily make new dashboards without starting from scratch.
- Include text panels for instructions or helpful links.
- Keep your dashboards simple and easy to look at quickly.
- Clean up by getting rid of dashboards you don't use.
Following these tips will make your dashboards more useful and easier for your team to use.
sbb-itb-9890dba
Grafana Observability Stack

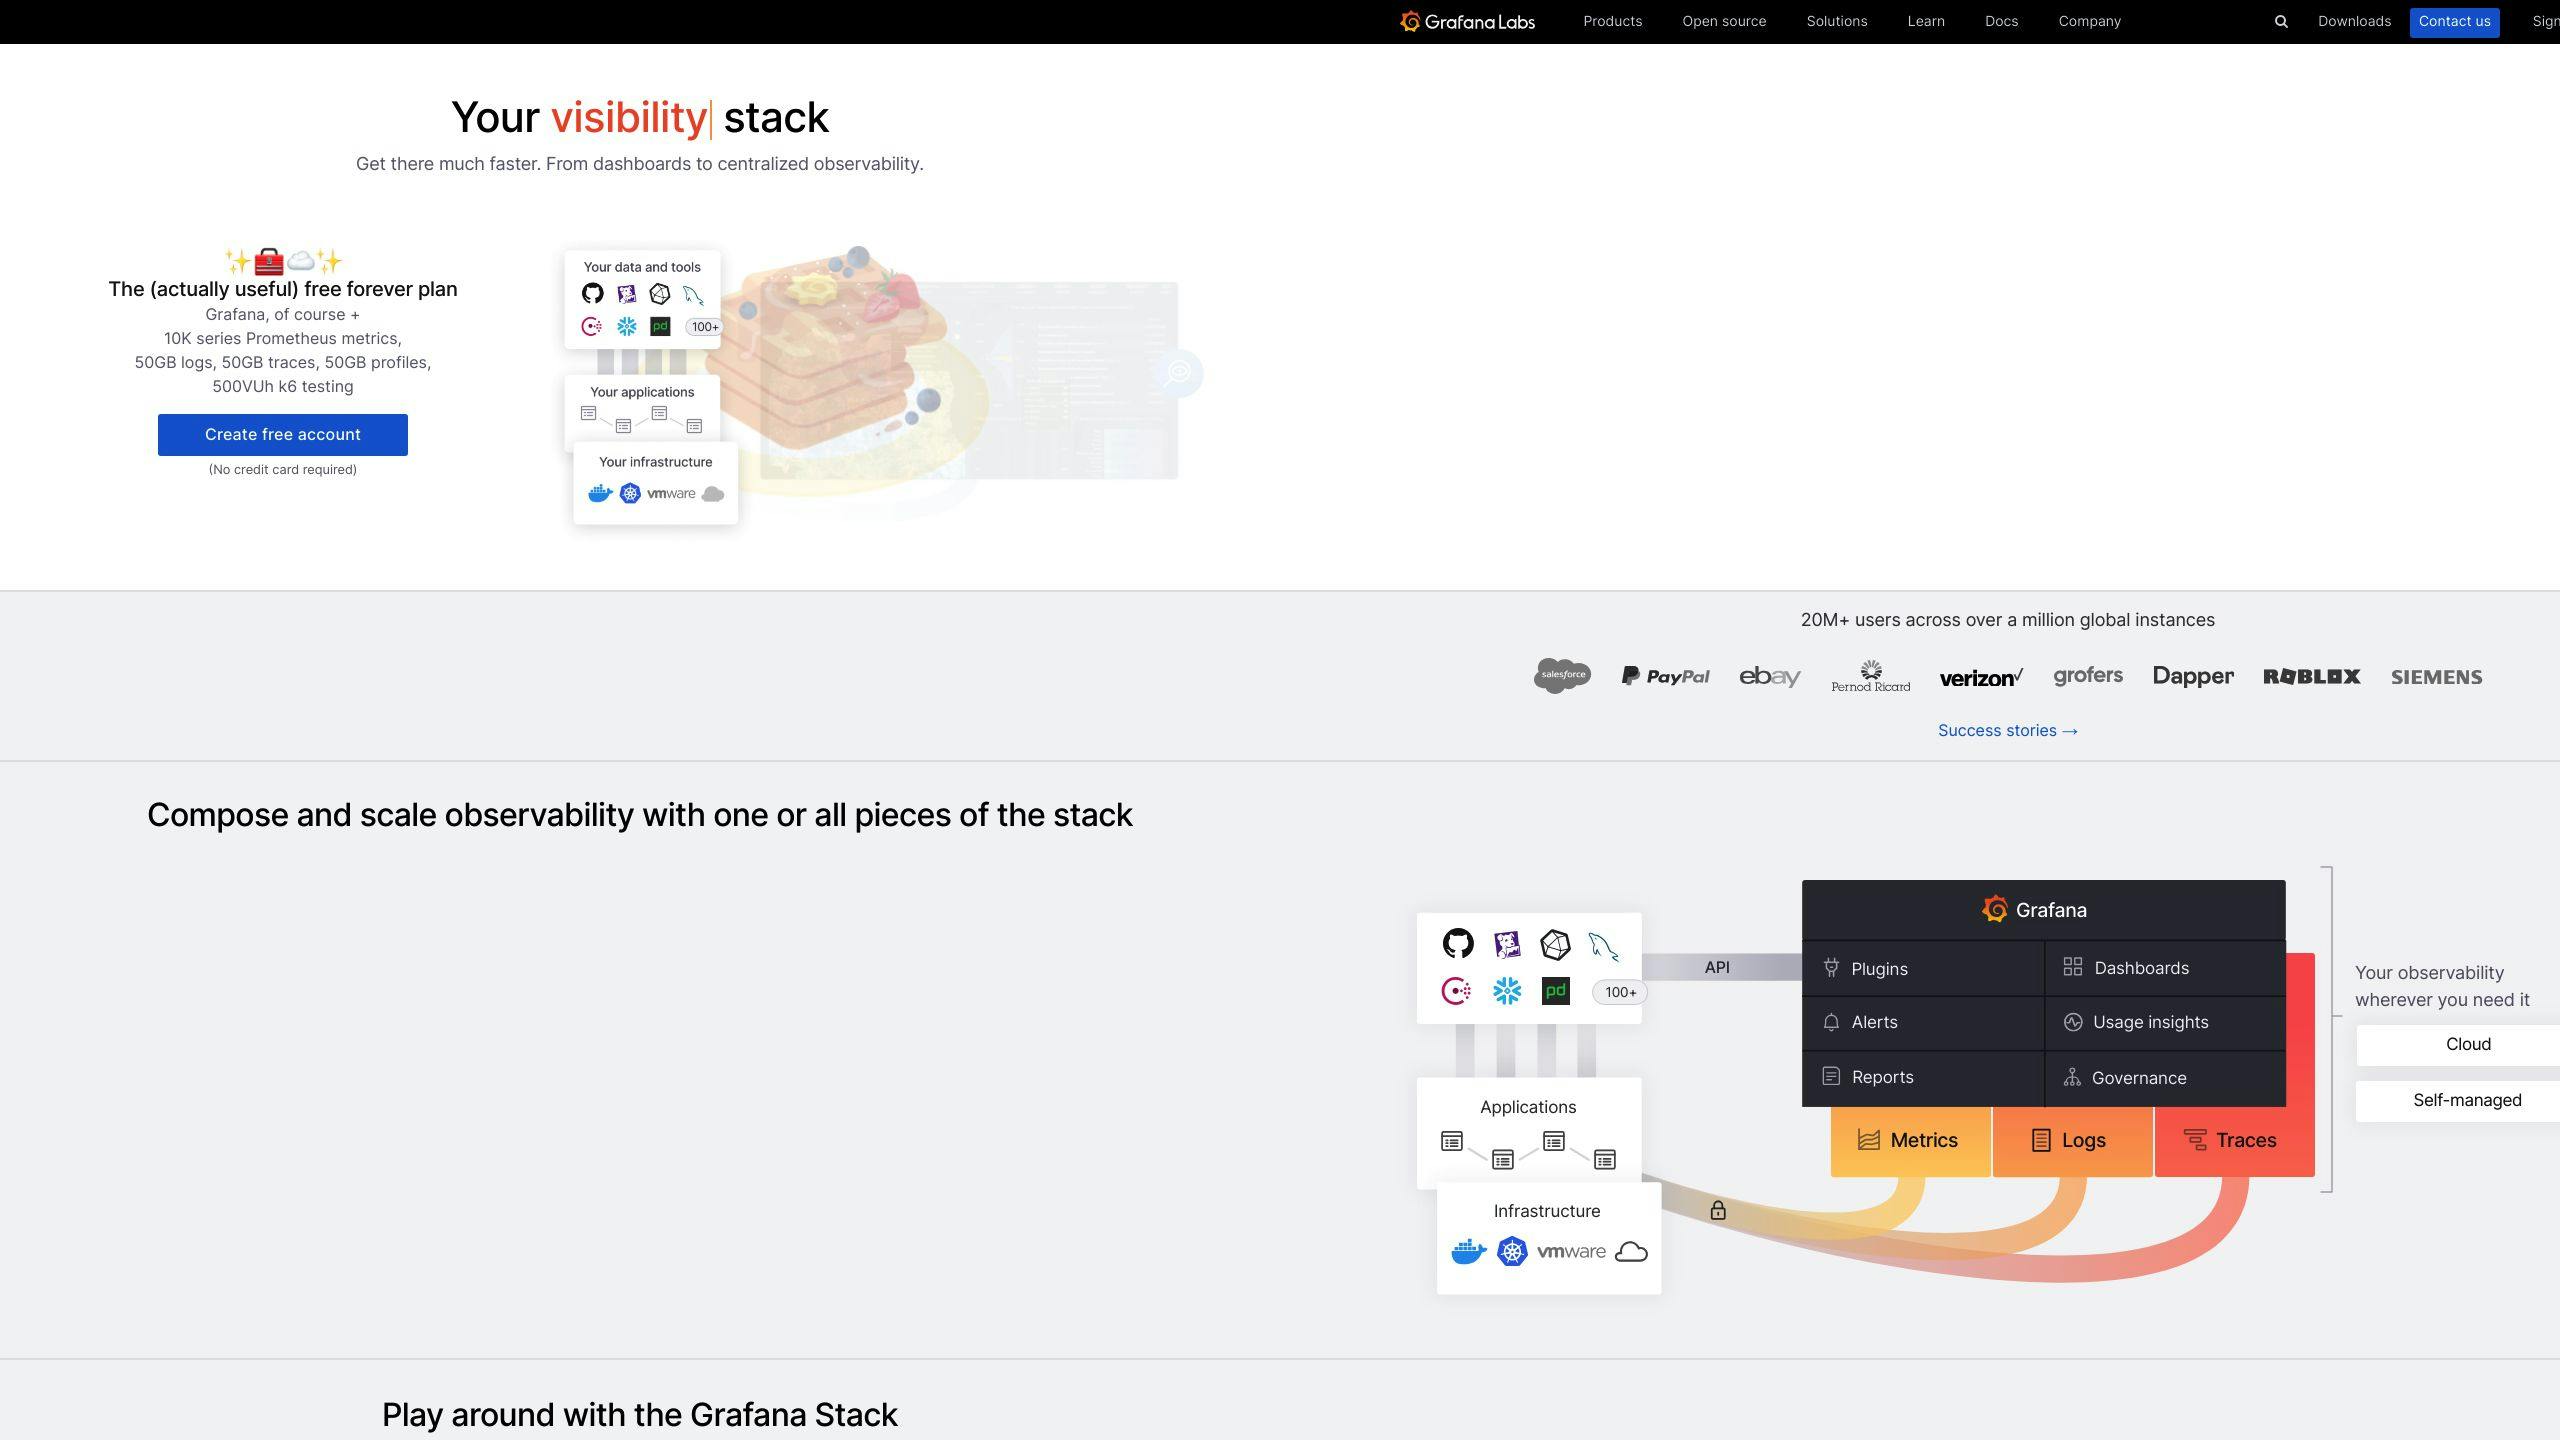
Grafana's observability stack is like a Swiss Army knife for keeping an eye on your system and apps. It helps you collect, store, and see logs, metrics, and traces all in one place. This means you can watch how things are running in real-time, find and fix problems faster, and make your work process smoother.
Components Overview
Here are the main tools in the Grafana observability stack:
- Loki: This tool collects logs from different places. It works with Promtail agents to gather and organize logs so you can search and analyze them in Grafana.
- Promtail: An agent that finds logs and sends them to Loki. It's like a delivery van for logs.
- Tempo: This tool deals with tracing. It collects details from your apps to help you understand how requests move through your services.
- Prometheus: A tool for monitoring and alerting. It keeps an eye on your system and collects data over time. Grafana can then show this data in a way that's easy to understand.
- Cortex: Think of Cortex as a supercharged version of Prometheus. It's built to handle a lot more data, making it great for big projects.
- Grafana: The heart of the stack. It lets you see your data through graphs and alerts, helping you understand what's happening at a glance.
Deployment Guide
Here's how to set everything up:
- Start with Prometheus servers to collect and keep track of data.
- Get Promtail working on your servers to collect logs and send them to Loki.
- Set up Loki to store and organize these logs.
- Install Tempo for tracing, so you can see how requests travel through your apps.
- Use Cortex for handling lots of data, especially if you're working on a big scale.
- Launch Grafana and set up dashboards to show your data. Make sure you connect it to Loki, Tempo, and Cortex.
- Make your apps ready to send data by setting up exporters and adding instrumentation for Prometheus, Promtail, and Tempo.
- Create alerts in Grafana to let you know when things aren't going as expected.
With all these pieces working together, you'll have a complete view of how your infrastructure and applications are performing. Grafana makes it easy to dive into your data, offering insights that can help you run things more smoothly.
Grafana in Action
Grafana is super useful for teams that handle software and systems, helping them see how things are working and find ways to make them better. Let's look at some examples of how Grafana helps in real life.
Use Cases
Monitoring Kubernetes at Scale
Imagine a big online store that uses Kubernetes to handle lots of small services. They use Grafana to keep an eye on:
- How much resources are being used
- Where delays are happening
- Errors in the system
They set up special screens that show all this info in one place, making it easier to spot and fix issues. They also get alerts when something might go wrong, helping them act fast.
CI/CD Analytics
A tech company with hundreds of developers uses Grafana to get a better look at their software building process. They can see:
- How long it takes to build and test their software
- How often they're able to release new versions
- How quickly they can go from writing code to using it
This helps them see where they can get better and make their process smoother.
Unified Infrastructure Monitoring
A hospital system uses Grafana to watch over their computer setup, which includes traditional servers, cloud services, and everything in between. Grafana shows them everything in one view, like:
- Servers and cloud services
- Databases and storage
This helps the tech and software teams work together more easily.
Key Takeaways
Accelerate Detection and Remediation
Grafana brings together all sorts of monitoring data, making it quicker to find and fix problems. Teams can look at different types of data together to understand issues better.
Improve Operational Efficiency
Grafana helps save money by showing where resources are being used too much or too little. It gives a big-picture view and lets you zoom in for details.
Enhance Collaboration
By sharing data and insights through Grafana, teams can talk more openly and work better together. This leads to better results and happier teams.
Continuous Process Improvements
Grafana helps teams see where things are getting stuck or could be done faster, especially in building and releasing software. This means they can keep getting better over time.
The Future of Grafana in DevOps
Emerging Trends
Grafana is getting ready to grow with some big changes happening in how we make and manage software:
GitOps
GitOps is about using Git (a tool to track changes in code) as the main way to manage how software and systems are set up. Grafana can work with GitOps tools like Flux and Argo CD to show what's happening with deployments, check for differences, and make sure everything matches what's supposed to be happening.
CI/CD Pipeline Observability
Teams want to see more about what's happening in their CI/CD pipelines, which help them get software from code to usable product. Grafana gives a single place to look at how the pipeline is doing, helping teams make things faster and smoother.
Platform Engineering
As teams build common systems for developers to use, Grafana helps by keeping an eye on how these systems are doing, how much they're being used, and how they're growing or changing.
Database as a Service (DBaaS)
More people are using cloud-based databases like AWS RDS, Azure SQL, and Google Cloud SQL. Grafana can connect to these databases to keep an eye on how they're doing.
Kubernetes at Scale
Kubernetes is a popular way to manage lots of different parts of software in containers. But it can get complicated. Grafana helps by working with tools like Prometheus, Loki, and Cortex to make it easier to manage.
Preparing for the Future
To get ready for these changes, teams can:
Extending Monitoring Scope
Look at more than just apps and systems. Start keeping an eye on CI/CD pipelines, shared systems, databases, and more.
Building Internal Expertise
Learn more about Grafana and how to use it for more complex setups.
Automating Dashboarding
Use tools to automatically create and update Grafana dashboards as things change.
Converging On Observability Standards
Agree on common ways to record and look at data across different tools and systems.
Planning for Growth
Think ahead about how much data you'll have and how complex things might get. Make sure Grafana and your systems can handle it.
By getting good at using Grafana and setting up systems to handle more data and complexity, teams can keep up with new ways of working and keep their systems running well.
Conclusion
Grafana is a super useful tool for DevOps teams who want to keep a close eye on their systems. It pulls together all sorts of information like metrics, logs, and traces into easy-to-understand dashboards. This helps teams work together better, spot problems faster, and make smart decisions based on data.
Key points to remember:
- Centralized monitoring and visualization - Grafana brings together data from sources like Prometheus and Loki into one place. This lets teams see important info all at once on custom dashboards.
- Alerting capabilities - Grafana can send alerts through Slack, email, PagerDuty, and more when things aren't looking right. This helps teams jump on issues quickly.
- Extensive capabilities - Grafana has cool features like templates, notes on graphs, and a special query tool that help you dig deeper into your data. It also keeps things secure with good access controls.
- Growing ecosystem - There's a big community around Grafana that's always adding new plugins and dashboards for different needs.
As things like GitOps and managing Kubernetes at a larger scale become more common, Grafana will continue to be really important for engineering teams who need to keep an eye on things, work well together, and stay tough in the face of challenges. Getting better at using Grafana and getting ready for more data will help teams keep up and do well.


