?
Eyer and Grafana are data visualization and monitoring tools with different strengths:
| Feature | Eyer | Grafana |
|---|---|---|
| Focus | AI-driven insights for business | Customizable dashboards for IT |
| Ease of use | User-friendly | Steeper learning curve |
| Data sources | AI-focused | Wide range |
| Customization | Limited | Highly flexible |
| Cost | Subscription-based | Free and paid options |
| Best for | Business analysts, AIOps | IT teams, DevOps |
Key differences:
- Eyer uses AI for predictive insights and is easier for non-technical users
- Grafana offers more customization and works with many data types
- Eyer is better for AI-powered business analytics
- Grafana excels in system monitoring and infrastructure visualization
Choose Eyer for AI-driven business insights or Grafana for flexible, technical monitoring.
Related video from YouTube
What is Eyer?

Eyer is a tool that helps businesses keep an eye on their Boomi integration processes. It shows what's happening in real-time, helps improve performance, and aids in planning for future needs.
Main features of Eyer
| Feature | Description |
|---|---|
| Real-time monitoring | Watches Boomi processes as they happen |
| Error detection | Spots problems quickly |
| Automated alerts | Sends notices when issues occur |
| Performance analysis | Finds slow spots in processes |
| Future planning | Helps prepare for growth |
How Eyer is used
Eyer is mostly used by IT teams to watch over and improve Boomi integrations. It's helpful for companies that rely a lot on connecting different systems.
Eyer's AI analytics
Eyer uses AI to look at data and offer insights. This helps businesses make choices based on information rather than guesses. The AI can:
- Look at lots of data quickly
- Find patterns
- Suggest what might happen next
This makes Eyer useful for companies wanting to stay on top of their game.
What is Grafana?
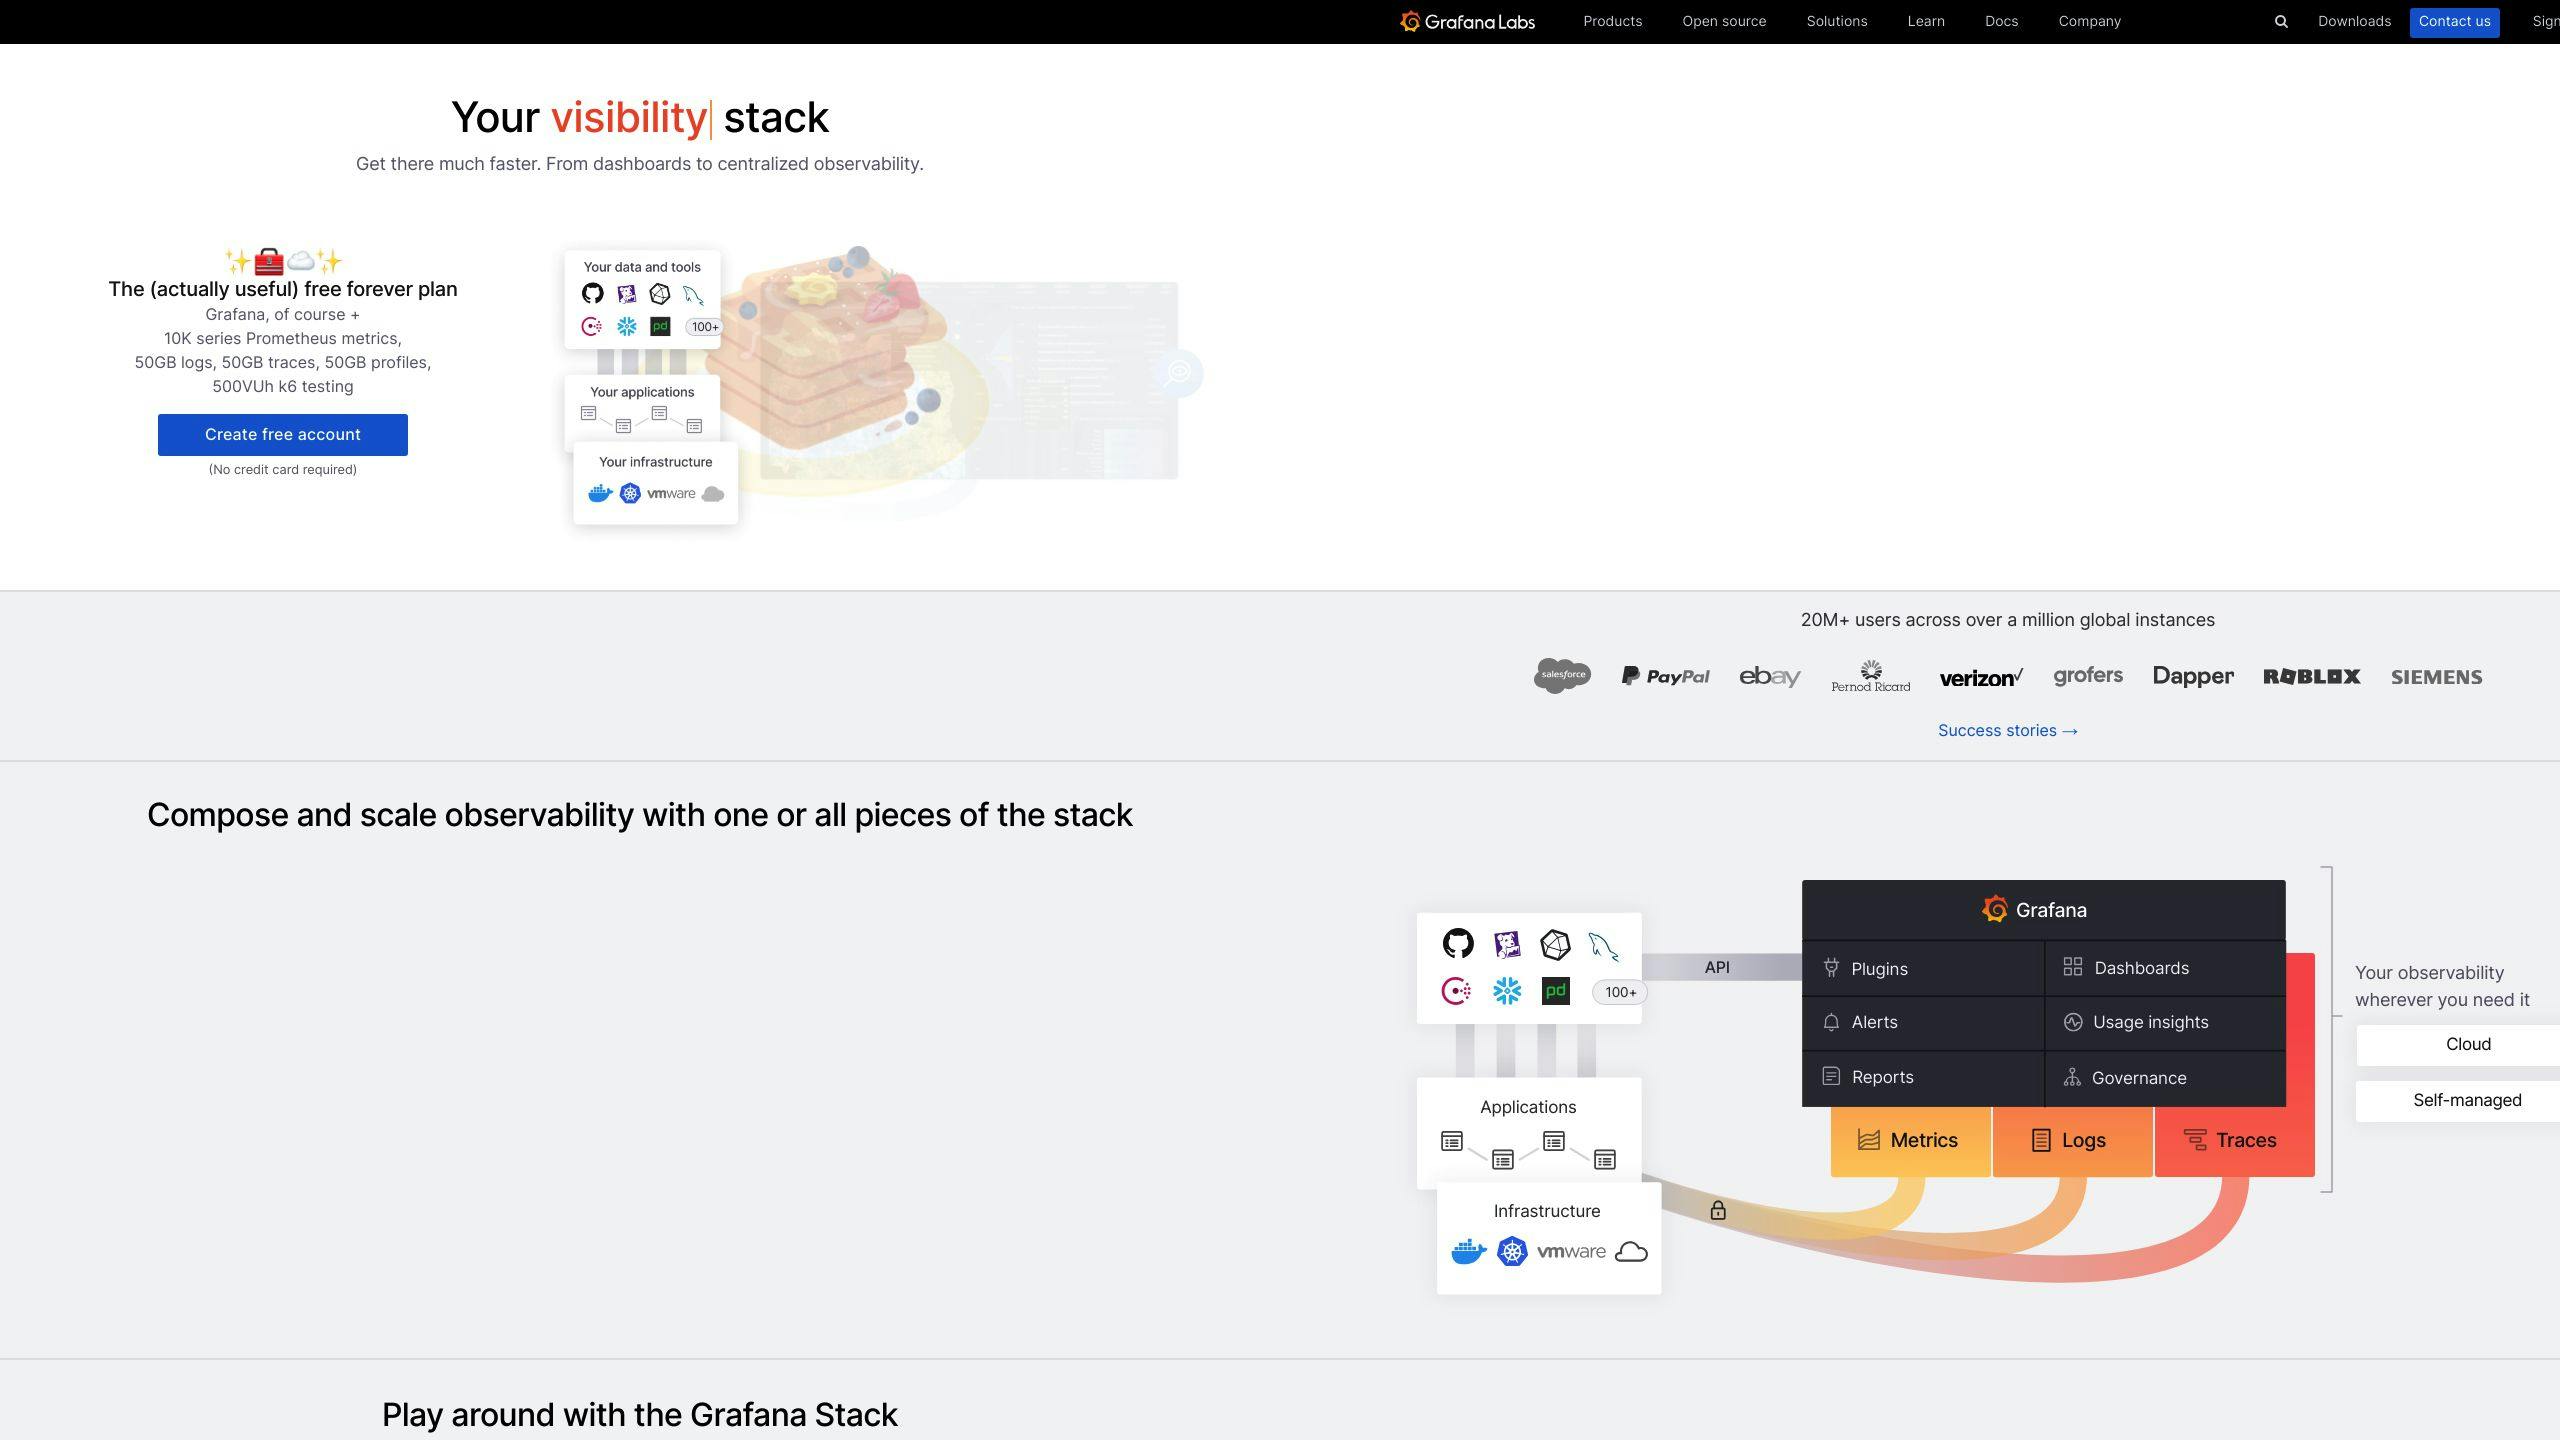
Grafana is a free, open-source tool for showing data in charts and graphs. It helps users look at, understand, and get alerts about their data from many different sources.
Grafana as open-source software
Being open-source means:
- It's free to use
- Anyone can change or add to it
- Many people work together to make it better
Data types Grafana can use
Grafana works with many kinds of data:
| Data Type | Examples |
|---|---|
| Time-series databases | InfluxDB, Prometheus |
| Regular databases | MySQL, PostgreSQL |
| Cloud services | AWS CloudWatch, Google Cloud Monitoring |
| NoSQL databases | MongoDB, Cassandra |
| Work tools | Jira, ServiceNow |
| Code tools | GitLab |
Making dashboards in Grafana
Users can make their own dashboards in Grafana:
- Put different charts on one screen
- Move charts around easily
- Use a special tool to ask for exactly the data they want
Grafana's alert system
Grafana can send alerts:
- Set up rules for when to send alerts
- Get a message when something important happens
- Helps users fix problems quickly
sbb-itb-9890dba
Eyer vs Grafana: Key differences
Data sources and setup
Eyer and Grafana handle data sources and setup differently:
| Feature | Eyer | Grafana |
|---|---|---|
| Data Source Compatibility | Works with many IT and business data sources | Supports many data sources and types |
| Setup | Easy to set up | Needs some tech know-how |
Data visualization tools
The tools differ in how they show data:
| Feature | Eyer | Grafana |
|---|---|---|
| Visualization Type | AI-powered insights | Many options to customize |
| User Control | Less control, but smart AI help | More control for users |
AI and machine learning
Eyer and Grafana use AI differently:
| Feature | Eyer | Grafana |
|---|---|---|
| AI Insights | Strong AI for future guesses | Basic AI add-ons |
| Spotting Odd Data | AI finds unusual patterns | Limited ability to spot odd data |
Alerts and monitoring
The tools have different ways to alert users:
| Feature | Eyer | Grafana |
|---|---|---|
| Smart Alerts | AI-based alerts that can predict | User-set alerts |
| How Well It Watches | Very good due to AI | Good, but needs user setup |
Ease of use
Eyer and Grafana differ in how easy they are to use:
| Feature | Eyer | Grafana |
|---|---|---|
| How It Looks | Easy to use with AI help | More complex, but can change a lot |
| How Hard to Learn | Easy for most people | Harder, needs tech skills |
Handling large data sets
The tools handle big data differently:
| Feature | Eyer | Grafana |
|---|---|---|
| Big Data Handling | Uses AI to handle big data well | Works well if set up right |
| How Fast It Works | Fast with AI help | Steady, but needs watching |
Cost and licensing
Eyer and Grafana have different pricing:
| Feature | Eyer | Grafana |
|---|---|---|
| How You Pay | Pay monthly or yearly | Free version and paid options |
| Cost to Think About | Good value for AI features | Depends on what you use |
How Eyer and Grafana are used
AIOps and IT Operations
Eyer and Grafana help improve system performance in AIOps and IT Operations. Here's how they're used:
| Tool | AIOps Use | IT Operations Use |
|---|---|---|
| Eyer | Finds odd patterns and predicts issues | Sends smart alerts for potential problems |
| Grafana | Shows system performance on custom dashboards | Helps find root causes of issues |
Business Intelligence and Analytics
Both tools help businesses understand their data better:
| Tool | Business Intelligence Use | Analytics Use |
|---|---|---|
| Eyer | Uses AI to spot trends and challenges | Helps make choices based on data |
| Grafana | Makes interactive dashboards | Shows data in easy-to-understand ways |
DevOps and Infrastructure Monitoring
Eyer and Grafana work well for DevOps teams:
| Feature | Eyer | Grafana |
|---|---|---|
| Main use | Finds performance bottlenecks | Shows infrastructure performance |
| Team benefit | Helps spot issues quickly | Makes it easier for teams to work together |
Summary
This article compared Eyer and Grafana, two tools used in AI for Business Analytics and Decision Making. Here's a quick look at their main differences:
| Feature | Eyer | Grafana |
|---|---|---|
| Main strengths | AI-driven insights, easy to use | Can be changed a lot, free to use |
| Main uses | AIOps, business analytics | Showing data, keeping watch |
| Cost | Pay monthly or yearly | Free and paid options |
When picking between Eyer and Grafana, think about:
- If you want AI help and an easy-to-use tool, Eyer might be better.
- If you like a tool you can change a lot and that works with many other tools, Grafana could be good.
- Both tools work for AIOps, business analytics, and DevOps, but:
- Eyer is better at using AI to help you understand data.
- Grafana is better at showing data and watching systems.
FAQs
What is Grafana best for?
Grafana is great for:
| Purpose | Description |
|---|---|
| Data viewing | Shows data from many sources in one place |
| Custom dashboards | Users can make their own data screens |
| System watching | Helps spot issues in complex setups |
It works well with tools like Prometheus, InfluxDB, and Elasticsearch.
When to use Grafana?
Use Grafana when you need to:
| Need | Example |
|---|---|
| Watch app speed | Find slow parts in your system |
| Check logs | See patterns in your data |
| Look at time data | Spot odd things happening |
| Make dashboards | Build screens to show key info |
| Mix with other tools | Get all your data in one view |
Grafana fits many jobs, from IT work to business number crunching.