Eyer and Grafana are both data analytics and monitoring platforms, but they have key differences:
- Eyer: All-in-one solution for data processing and analysis
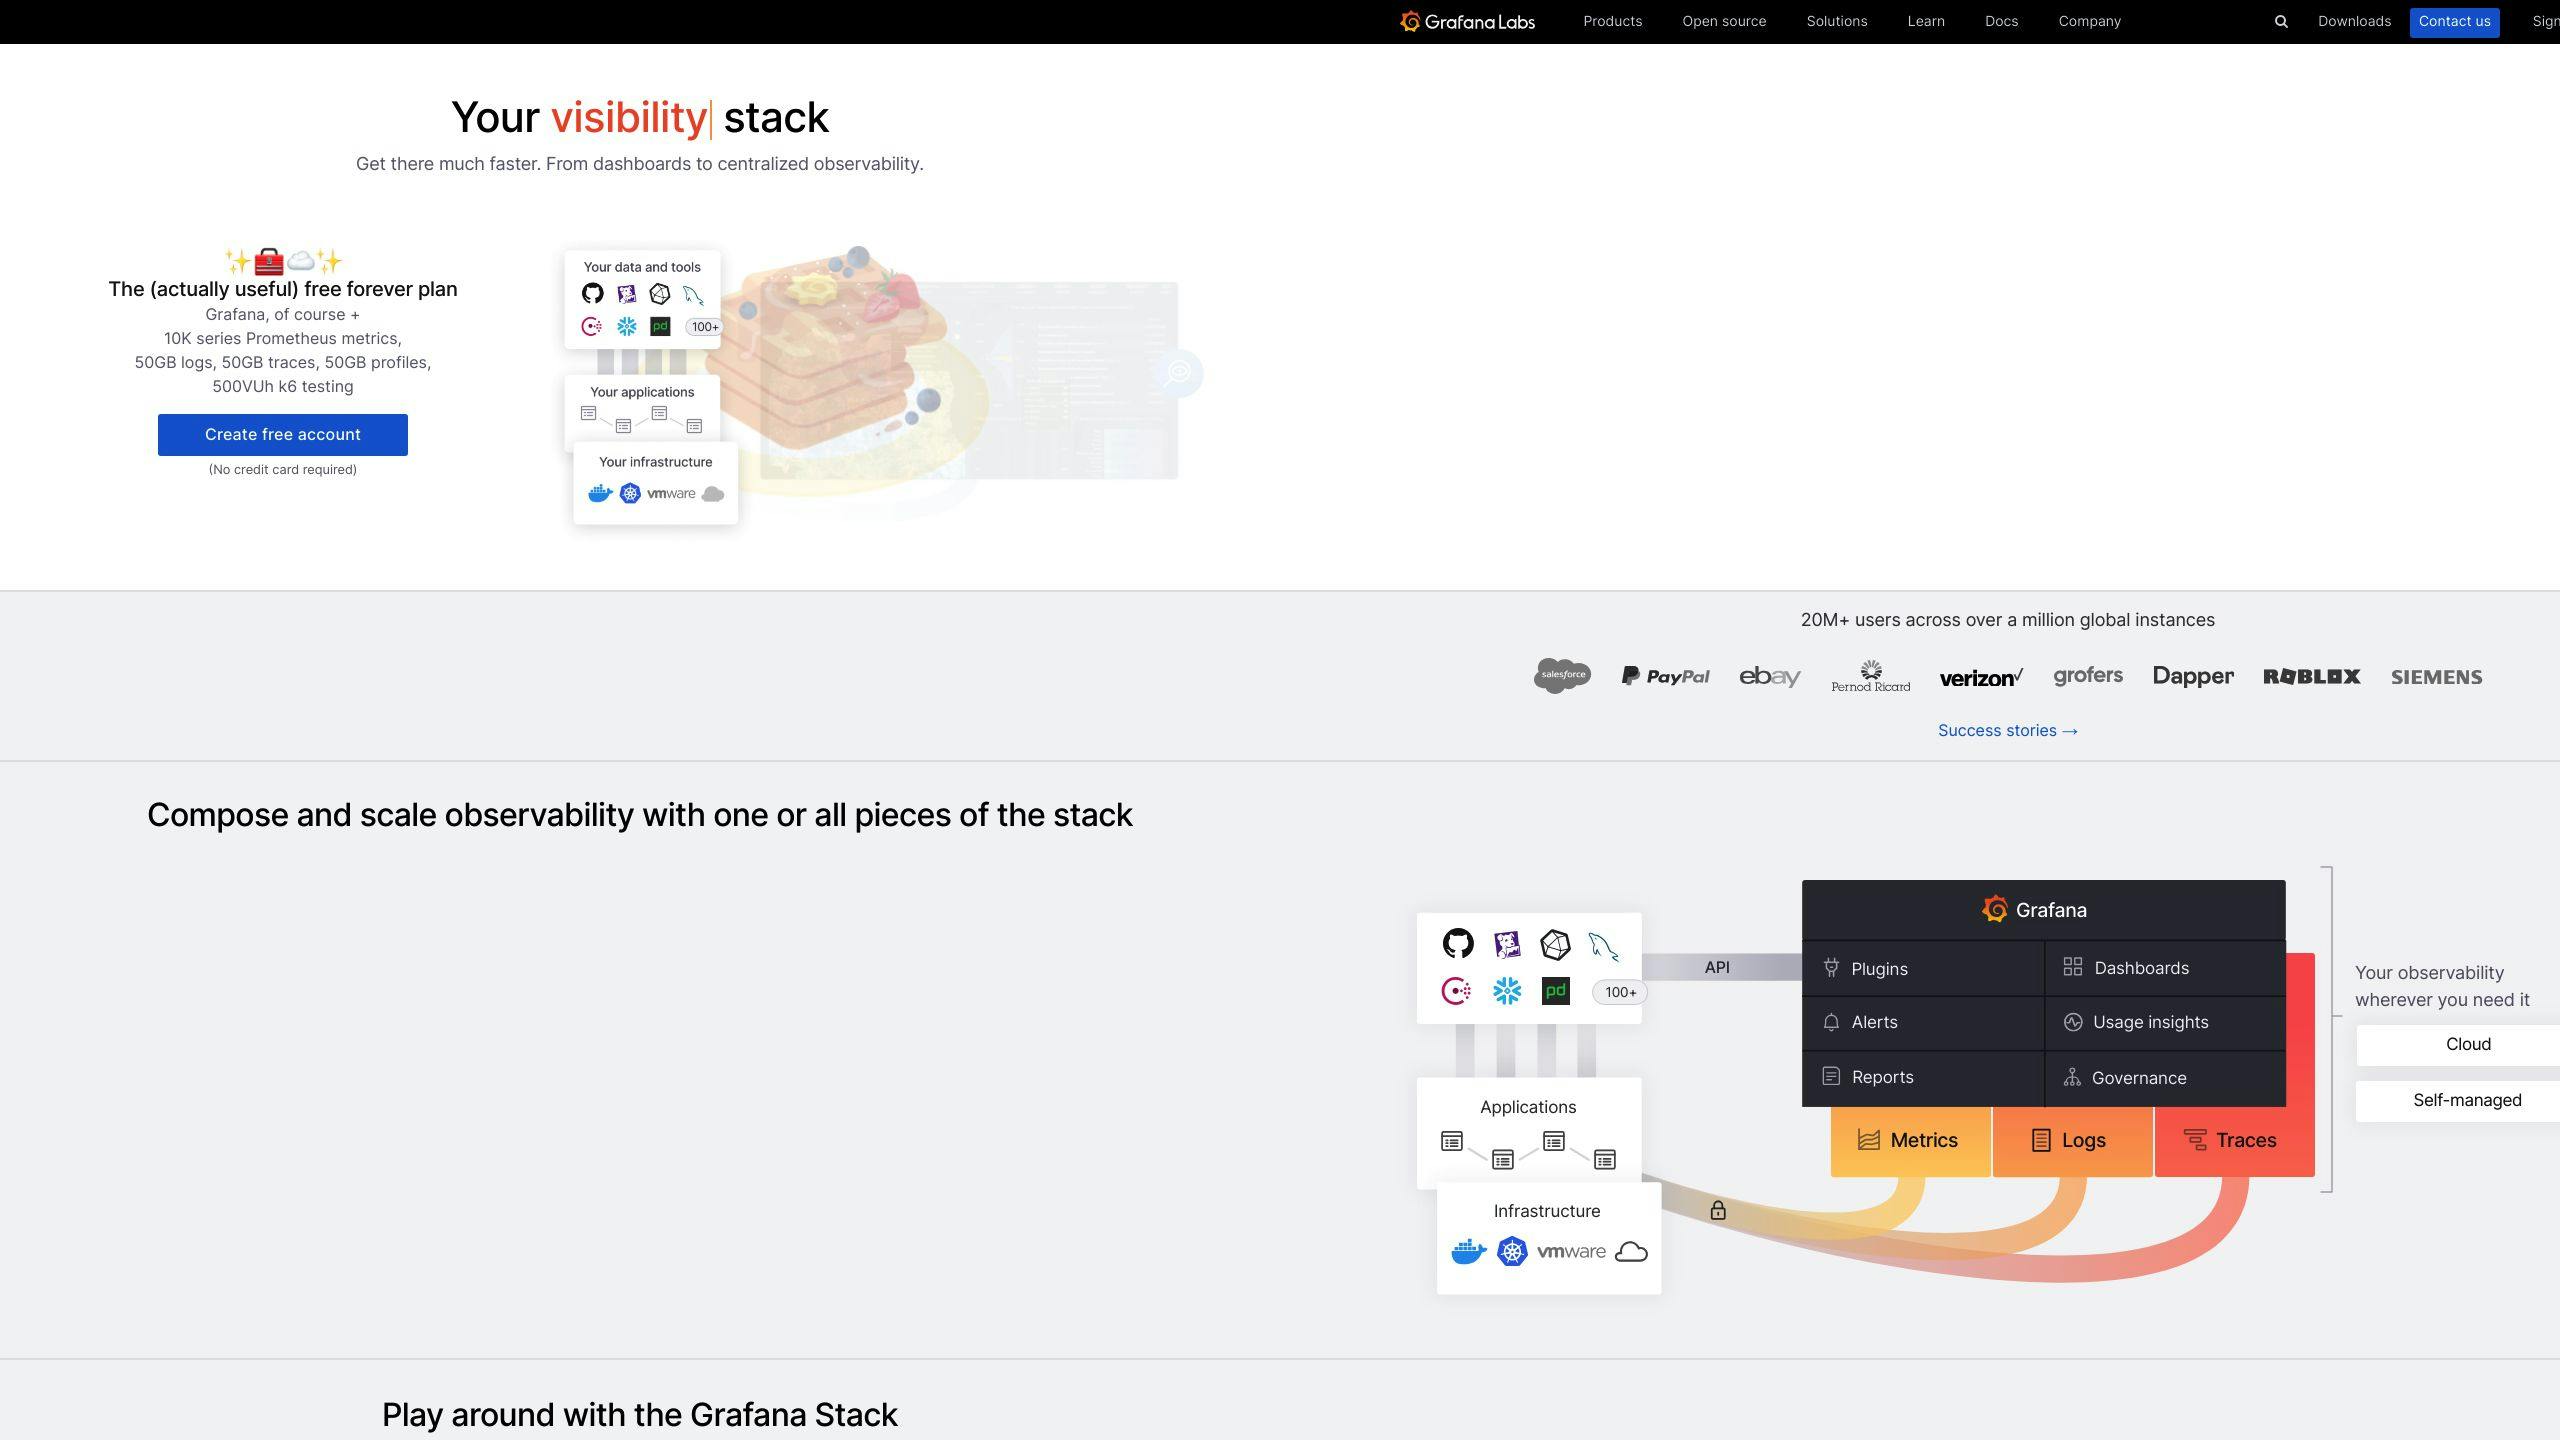
- Grafana: Open-source platform for creating observability dashboards
Quick Comparison:
| Feature | Eyer | Grafana |
|---|---|---|
| Type | Analytics and monitoring platform | Open-source observability dashboard |
| Main focus | Comprehensive data analysis | Data visualization |
| Target users | Organizations seeking data-driven decisions | DevOps, IT operations, business intelligence |
| Key strength | AI-powered analytics | Flexible integration with multiple data sources |
| Pricing | Custom quotes | Clear options, including free version |
| Scalability | Limited | High |
| Data sources | Built-in connections | Many add-ons and plugins |
| User interface | Requires technical knowledge | More user-friendly |
| AI capabilities | Strong | Basic |
Choose Eyer for custom monitoring solutions with AI-driven automation. Opt for Grafana if you need a highly customizable tool that grows with your needs and offers clear pricing options.
Related video from YouTube
2. Eyer overview
2.1 Main features
Eyer is a data analytics and monitoring platform with these key features:
| Feature | Description |
|---|---|
| Data collection and processing | Gathers data from various sources and turns it into useful information |
| Data visualization | Offers charts, graphs, and dashboards to show data clearly |
| AI-powered analytics | Uses AI to spot unusual patterns, find anomalies, and predict trends |
| Cloud-based system | Allows users to adjust their usage as needed, suitable for different company sizes |
2.2 Users and common uses
Eyer is for organizations that want to use data to make decisions. Its users include:
- Business leaders (CEOs, CFOs)
- Data analysts and scientists
- IT professionals
Common uses of Eyer:
| Use | Description |
|---|---|
| System monitoring | Keeps track of how well systems, apps, and infrastructure are working |
| Business analysis | Looks at customer behavior, market trends, and sales performance |
| Problem prevention | Finds potential issues early to reduce downtime and improve efficiency |
3. Grafana overview
3.1 Main features
Grafana is an open-source platform for data visualization and monitoring. Its key features include:
| Feature | Description |
|---|---|
| Data source support | Works with many data sources like Prometheus, InfluxDB, and Elasticsearch |
| Query editor | Lets users write custom queries to get and change data |
| Dashboard builder | Helps users make custom dashboards with different ways to show data |
| Alerting | Sends alerts and notifications about important events |
| Plugin library | Offers many plugins to add more functions |
3.2 Users and common uses
Grafana is used in many fields, such as IT, finance, and healthcare. Its users include:
- DevOps teams
- Data analysts
- IT operations teams
Common uses of Grafana:
| Use | Description |
|---|---|
| Infrastructure monitoring | Checks server performance, network traffic, and how apps are working |
| Application performance monitoring (APM) | Tracks how fast apps respond, how often they have errors, and how users behave |
| Business intelligence | Makes dashboards to show business numbers and key performance indicators |
| IoT monitoring | Watches and shows data from IoT devices and sensors |
4. Key feature comparison
4.1 Spotting unusual patterns
Both Eyer and Grafana help users find odd patterns in their data:
| Feature | Eyer | Grafana |
|---|---|---|
| Detection method | AI-powered anomaly detection | Custom alert rules |
| Timing | Real-time | Based on set conditions |
| User action | Allows for quick response | Notifies users of critical events |
4.2 Data sources and connections
| Aspect | Eyer | Grafana |
|---|---|---|
| Focus | Cloud-based sources, real-time analytics | Wide range of sources |
| Supported sources | Various data sources | Cloud providers, databases (relational, time series) |
| Popular connections | - | Prometheus, InfluxDB, Elasticsearch |
| Flexibility | Good | High |
4.3 Charts and dashboards
Both platforms offer ways to show data clearly:
| Feature | Eyer | Grafana |
|---|---|---|
| Customization | Customizable charts and dashboards | Highly customizable with plugin library |
| Real-time updates | Dynamic dashboards that change with data | Static dashboards with manual updates |
| Ease of use | User-friendly interface | Requires more technical knowledge |
| Extra features | AI-powered analytics | Extensive plugin options |
5. System setup and scaling
5.1 Eyer's cloud-based system
Eyer uses a cloud-based system, which means:
- It's easy to use from anywhere
- It can handle more data as your needs grow
- You don't need to manage servers or software updates
This setup allows for quick data processing and sharing between teams.
5.2 Grafana's setup options
Grafana offers two main setup choices:
| Setup Option | Description |
|---|---|
| Self-hosted | You run Grafana on your own servers |
| Grafana Cloud | Grafana manages the system for you |
Self-hosting gives you more control but requires more work. Grafana Cloud is easier to use but offers less customization.
5.3 Scaling comparison
Here's how Eyer and Grafana handle growth:
| Aspect | Eyer | Grafana |
|---|---|---|
| Ease | Grows automatically | Needs manual work (if self-hosted) |
| Speed | Quick to add resources | Can be slower to scale |
| Cost | Pay for what you use | May need to buy more servers |
| Management | Handled by Eyer | You manage (if self-hosted) |
Eyer's cloud system makes it easier to grow, while Grafana gives you more options but may need more work.
When choosing between Eyer and Grafana, think about:
- How much control you want over your system
- How much time you can spend on setup and management
- How quickly you need to grow your system
Both tools can handle lots of data, but they do it in different ways. Pick the one that fits your needs best.
6. Working with other tools
6.1 Eyer's built-in connections
Eyer comes with ready-to-use connections to many tools and data sources. This means:
- You can quickly link to your data
- You don't need to set up complex connections
- Data processing and sharing happen in real-time
6.2 Grafana's add-ons
Grafana offers many add-ons and plugins you can install. These let you:
- Connect to more data sources (like MongoDB and Redis)
- Show your data in different ways
- Add new features to your dashboard
6.3 Connecting to outside tools
Both Eyer and Grafana can work with outside tools, but they do it differently:
| Aspect | Eyer | Grafana |
|---|---|---|
| Connection type | Built-in | Add-ons and plugins |
| Ease of use | Quick to set up | May need more setup |
| Options | Limited | Many choices |
| Best for | Fast integration | Custom setups |
When picking between Eyer and Grafana, think about:
- How important outside tools are for your work
- If you need more control over your data sources
- How much time you can spend on setup
Eyer is good for quick setups, while Grafana gives you more options if you're willing to spend time on it.
sbb-itb-9890dba
7. AI and automation features
7.1 Eyer's AI abilities
Eyer uses AI to help users find unusual patterns in their data. While not as advanced as Grafana's, Eyer's AI can:
- Spot outliers in data
- Predict future trends
7.2 Grafana's AI features
Grafana offers more AI and automation features than Eyer. Its Machine Learning tools help users:
- Create alerts
- Predict future needs
- Find odd activities
Grafana's AI learns from data to help make better choices.
| Feature | Description |
|---|---|
| Predicting the future | Uses past data to guess what will happen next |
| Showing how sure it is | Tells users how likely its guesses are to be right |
| Smart alerts | Changes alerts based on new patterns in data |
Both Eyer and Grafana use AI to help users understand their data better. Grafana has more advanced features for predicting what might happen next.
8. User-friendliness
8.1 How the interfaces compare
Eyer and Grafana have different approaches to their user interfaces:
| Aspect | Eyer | Grafana |
|---|---|---|
| Target users | Those familiar with data analysis | Users of all skill levels |
| Interface focus | Data analysis tools | Visual customization |
| Ease of use | Requires some technical knowledge | More user-friendly |
| Visuals | Standard charts and graphs | Pre-built and customizable visuals |
Grafana's interface is easier for beginners, while Eyer's interface suits those with data analysis experience.
8.2 Getting started
Both Eyer and Grafana offer ways to help new users:
| Feature | Eyer | Grafana |
|---|---|---|
| Setup | Cloud-based, quick to start | Flexible setup options |
| Tutorials | Provided | Provided |
| Documentation | Available | Available |
| Infrastructure | Managed by Eyer | User-managed or cloud-based |
Eyer's cloud system makes it quick to set up, while Grafana offers more setup choices.
8.3 Help and support
Eyer and Grafana both provide support for their users:
| Support type | Eyer | Grafana |
|---|---|---|
| Documentation | Complete guides | Complete guides |
| Customer support | Quick responses | Community and paid support |
| Security features | Standard | LDAP/Active Directory integration |
Both tools offer good support, but Grafana has more advanced security options for businesses.
9. Cost and licensing
9.1 Eyer's pricing
Eyer doesn't share its prices publicly. To get a price, you need to talk to their sales team. This lets Eyer set prices based on what each customer needs.
9.2 Grafana's pricing
Grafana is more open about its prices. It offers different options for different users:
| Version | What you get | Cost |
|---|---|---|
| Grafana OSS | Use as much as you want | Free |
| Grafana Cloud Free | 3 users, no limits on dashboards and alerts | Free |
| Grafana Cloud Pro | 10 users, no limits, extra features | $5 per user each month (yearly bill) |
| Grafana Cloud Advanced | Choose user count, no limits, more features | Ask for price |
| Grafana Enterprise | Extra features, help, and training for big companies | Ask for price |
Grafana's pricing works for small and big groups. You can start small and pay more as you grow.
9.3 Comparing costs
Here's how Eyer and Grafana costs stack up:
| Aspect | Eyer | Grafana |
|---|---|---|
| Price info | Not public | Clear options |
| Free version | Not mentioned | Yes (OSS and Cloud Free) |
| Paid options | Custom quotes | Set prices and custom quotes |
| Best for | Companies wanting tailored pricing | Users who like clear pricing choices |
When picking between Eyer and Grafana, think about:
- How much you're willing to spend
- If you need a free option to start
- Whether you want set prices or custom quotes
Eyer might work better if you want a price that fits your exact needs. Grafana could be good if you want to know prices upfront or if you want to start for free.
10. Best uses for each tool
10.1 When to use Eyer
Eyer works well when you need:
- A monitoring solution made just for you
- Pricing that fits your exact needs
- AI and automation to make monitoring easier
10.2 When to use Grafana
Grafana is a good choice when you want:
- A tool that can grow with your needs
- Many ways to connect to different data sources
- Clear pricing options, including a free version
- To make custom dashboards and share them with your team
10.3 Strengths comparison
Here's a quick look at what each tool does best:
| Tool | What it's good at |
|---|---|
| Eyer | - Custom pricing - AI features - Automation |
| Grafana | - Can grow with your needs - Works with many data sources - Clear pricing - Good at showing data - Alerts - Team sharing |
When picking between Eyer and Grafana, think about:
- What you need to monitor
- How much you can spend
- How much you want to change the tool
- How big your needs might get
11. Wrap-up
11.1 Main differences
Here's a quick look at how Eyer and Grafana compare:
| Feature | Eyer | Grafana |
|---|---|---|
| Pricing | Custom quotes | Clear options, including free |
| AI features | Strong | Basic |
| Automation | Advanced | Standard |
| Scalability | Limited | High |
| Data sources | Built-in connections | Many add-ons and plugins |
11.2 Which to choose
Pick the tool that fits your needs best:
| Choose Eyer if you want | Choose Grafana if you want |
|---|---|
| A custom monitoring solution | A tool that grows with you |
| AI-driven automation | Many data source options |
| Pricing tailored to your needs | Clear pricing, including free version |
| Quick setup with built-in connections | Highly customizable dashboards |
Think about:
- Your budget
- How complex your monitoring needs are
- How much you want to change the tool
11.3 Looking ahead
Both Eyer and Grafana will keep changing. To stay up-to-date:
- Check their websites for new features
- Join user groups to learn from others
- Try free versions or demos when possible
FAQs
What are some other tools like Grafana?
Here's a list of tools similar to Grafana:
| Tool | Key Feature |
|---|---|
| Datadog | Cloud monitoring |
| Amazon Web Services (AWS) | Cloud services and monitoring |
| New Relic | Application performance monitoring |
| Elastic | Log and metrics analysis |
| Cisco (Splunk) | IT and security operations |
| Dynatrace | AI-powered observability |
| Microsoft | Azure Monitor for cloud resources |
| Cloud Monitoring for Google Cloud |
How are Grafana and Prometheus different?
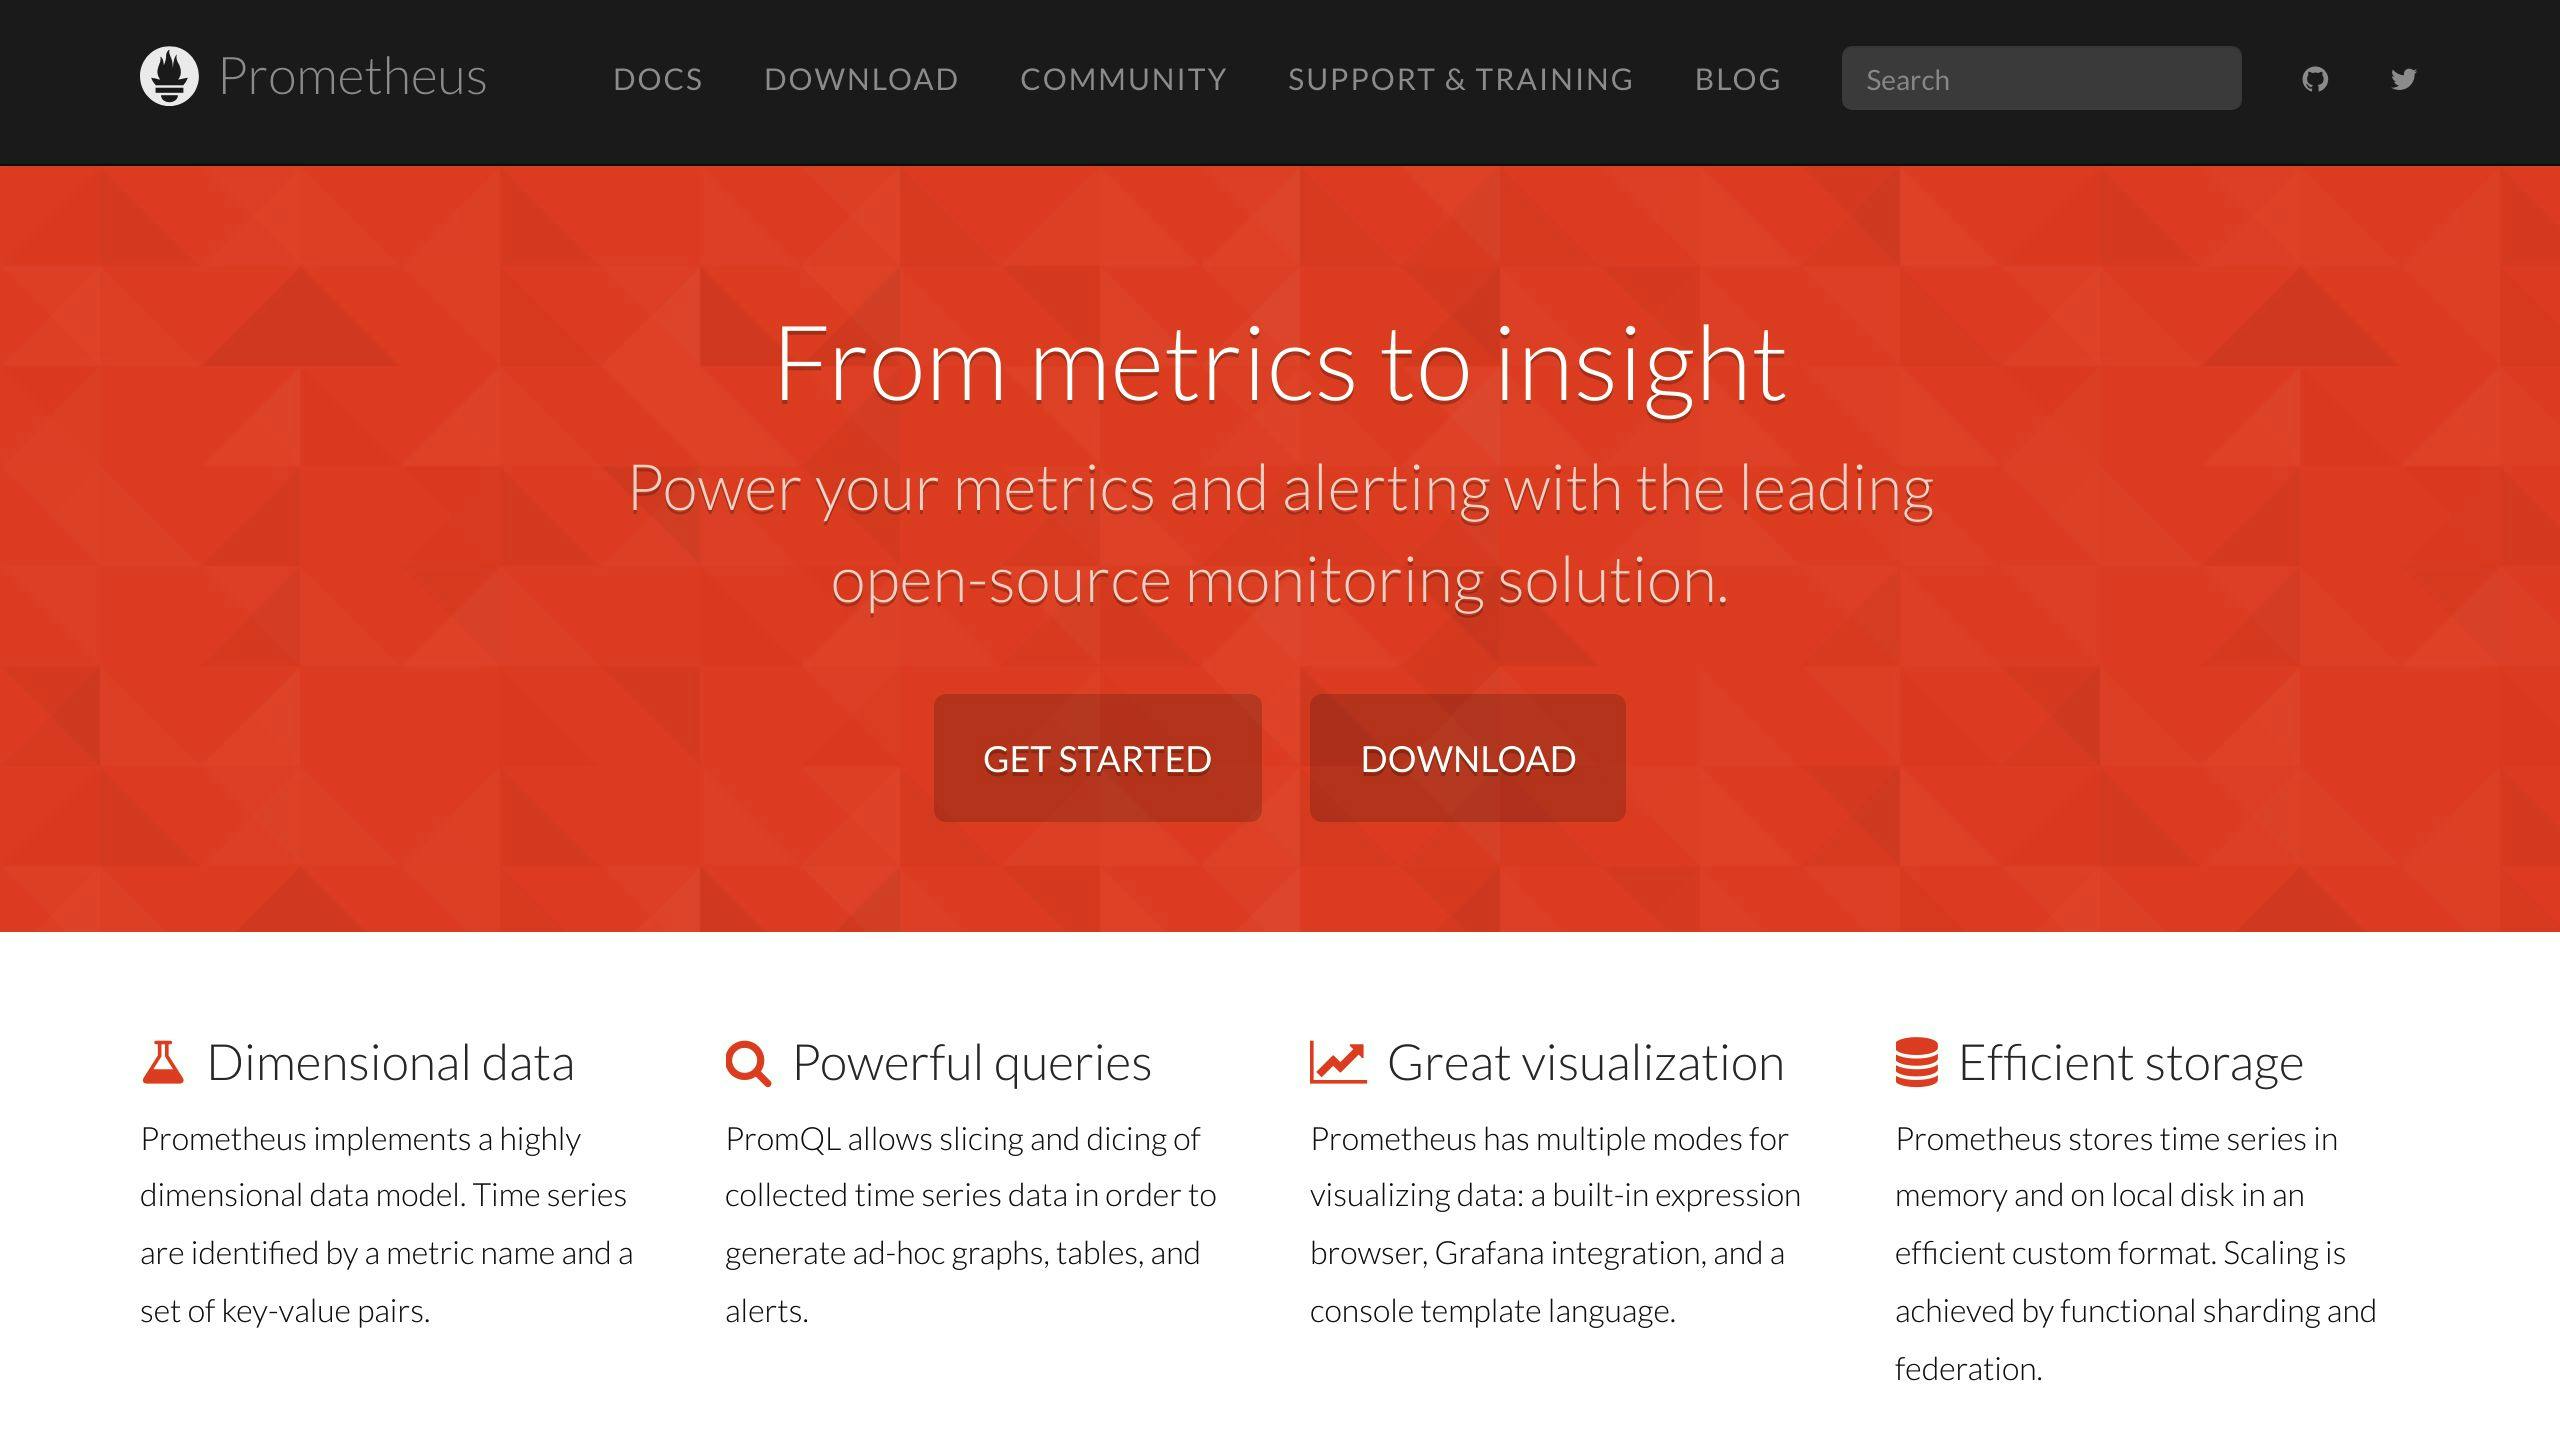
Grafana and Prometheus serve different purposes:
| Tool | Purpose | Main Function |
|---|---|---|
| Prometheus | Monitoring system | Collects and stores data |
| Grafana | Visualization tool | Creates dashboards and graphs |
Grafana can use data from many sources, including Prometheus. It can work without Prometheus, using other data sources as needed.