Anomaly detection, also known as outlier detection, is the practice of identifying data points that deviate significantly from the rest of a data set. Traditionally, this was the domain of statisticians and analysts who spent hours poring over data to find these anomalies. However, like many fields, anomaly detection has evolved over time, leading to the development of solutions like Eyer.
With the rise of machine learning (ML) and artificial intelligence (AI), ML algorithms can now automatically learn underlying patterns within vast datasets, process the data, and effectively identify anomalies that might escape even the most trained human eye.
This article introduces Eyer as the AI-powered anomaly detection tool under review and demonstrates how it can be used to identify anomalies in CPU and memory metrics in a host server or machine.
Prerequisites
To get started with the tutorial, you must have the following:
- The Eyer connector agents installed on production or production-like hosts. If you have not installed these agents, refer to the Eyer documentation for installation instructions.
- The installed agents must be running continuously for at least a week. This allows the Eyer machine learning pipeline to learn the normal behavior of your Boomi integrations. For more information, refer to the official documentation on Onboarding, preprocessing, and filtering data.
- A Boomi Atom installed locally.
Understanding what Eyer is and how it works.
Eyer is an AI-powered observability tool that provides deep insights into your Boomi integrations. It utilizes machine learning to analyze various metrics and identify unusual patterns or data points that deviate significantly from the norm. This anomaly detection capability helps you proactively address potential issues before they impact your integrations.
To gather and deliver data to Eyer's machine learning pipeline, the connector employs a range of agents, including web servers (like Jetty or Tomcat), Jolokia, and Telegraf. Each agent plays a crucial role in this process, for example:
- The web server hosts and serves the Jolokia agent. During installation, you can choose to use Apache Tomcat to serve the Jolokia agent instead of Jetty or any other preferred server.
- The Jolokia agent helps monitor and manage Java applications through a web browser. It acts as a bridge, allowing you to access and control parts of your Java program using simple web requests, and returns the information in an easy-to-read format (JSON).
- The Telegraf agent collects and sends metrics and events from various sources to different databases and systems. It will be responsible for collecting data from your Boomi Atom and sending it to the machine learning pipeline.
Eyer’s anomaly detection works because of the continuous data stream from your Boomi Atom to Eyer’s machine learning pipeline. It is important to note that the remaining events in this tutorial, which involve querying and visualizing anomalies, occur after anomaly detection has been enabled on the Boomi Atom, requiring at least 7 days of a steady data stream.
Simulating stress for the servers holding the Boomi Atom
Once the Eyer team confirms your anomaly detection enablement, you can begin querying for anomalies in your environment.
This guide simulates a production environment by running a Windows virtual machine continuously (24/7) for at least a week. It also injects anomalies by increasing the CPU load on the virtual machine hosting the Boomi Atom you're monitoring.
Since this guide uses a Windows operating system virtual machine, it utilizes the Windows tool CpuStress v2.0 to maximize CPU utilization.
While maximizing CPU load offers a valuable way to understand Eyer's capabilities, you can introduce anomalies across different Boomi Atom metrics, including memory, disk usage, and system load.
Getting started with CpuStres
To get started with CpuStres, download the executable file from the CpuStres v2.0 download page. Once the download is complete, extract the CPUSTRES.zip file and run it to open the CPU Stress modal.

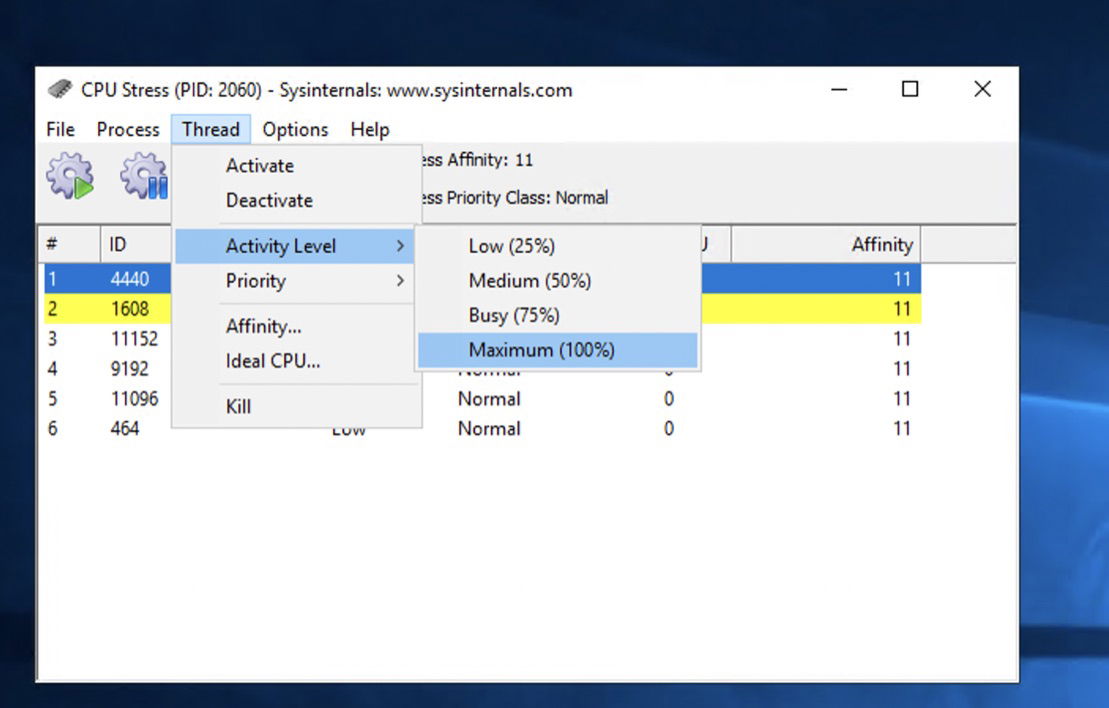
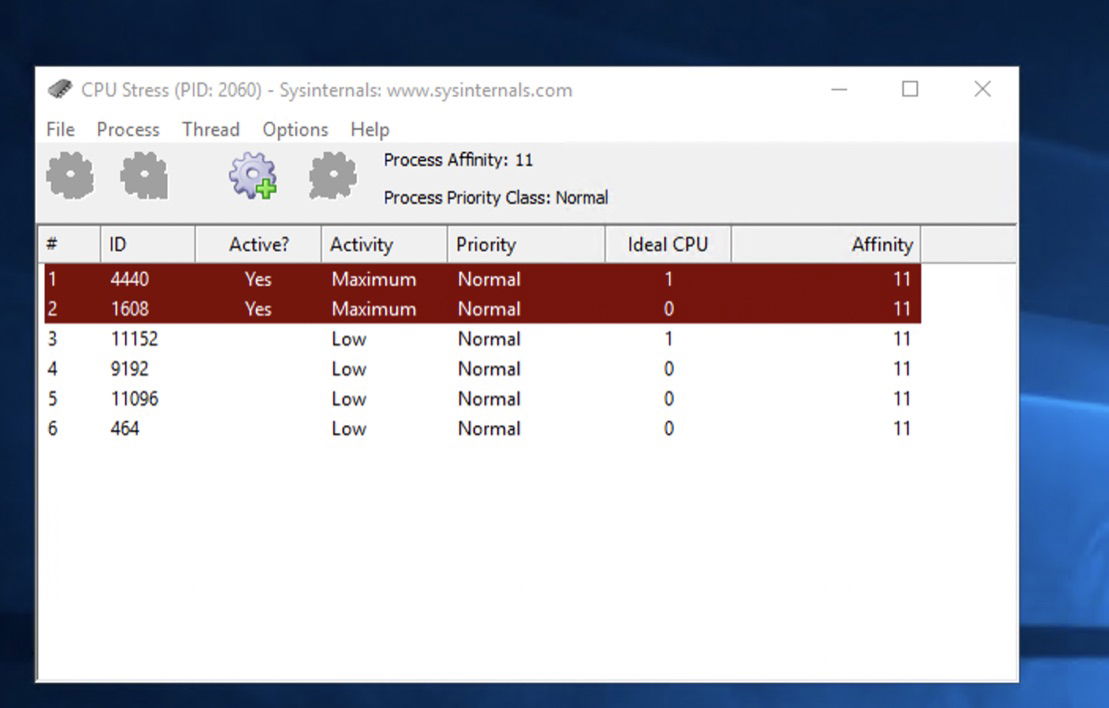
You will see your CPU cores in this modal. To activate three or four of these cores, click on each one, navigate to the Thread tab, and select the Activate button from the Thread dropdown.
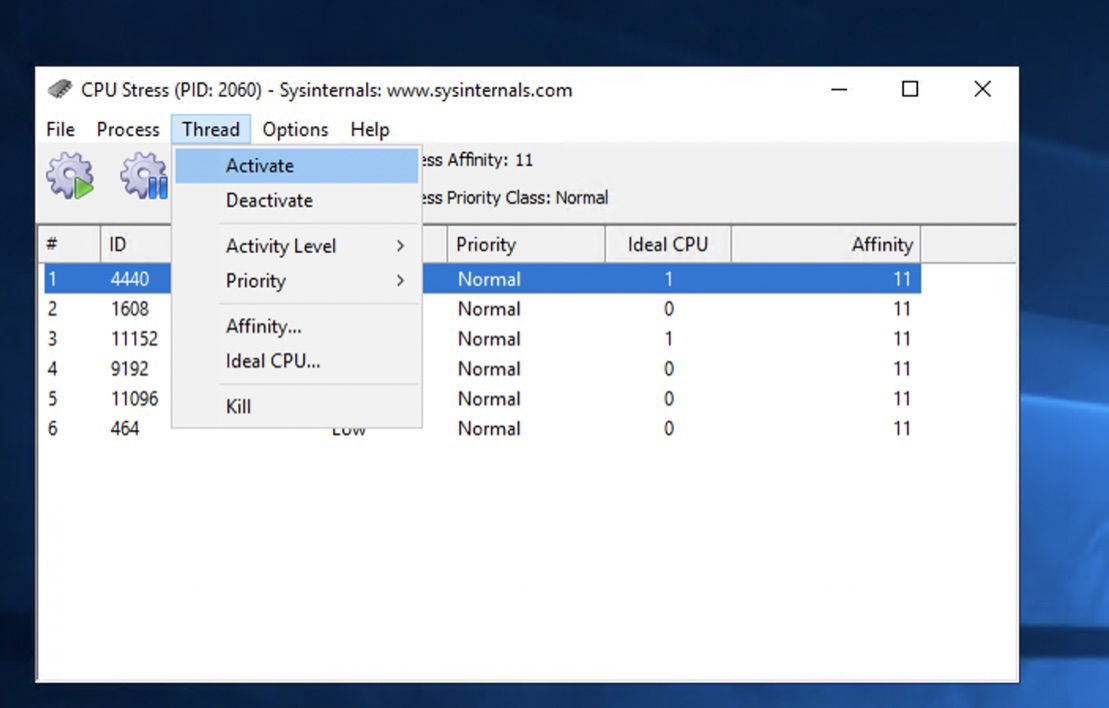
Additionally, set the Activity level to high to increase the load on the CPU cores. To ensure these CPU load stress tests are registered as an anomaly, keep CpuStres running for at least 8 minutes.
How to use Eyer and Grafana to query and visualize anomalies in CPU and memory metrics
Configuring the Eyer connector to query the data on anomalies
After simulating anomalous behavior in your host machine, use the Eyer connector to query the information on these anomalies.
To query this data on anomalies, log into your Boomi Atmosphere account. Go to the Integration page, click Create New, and select Process from the dropdown menu.
This action will open the Start Shape sidebar. Choose the Connector radio button. Next, in the Connector field, search and select the Eyer-Partner connector.

Next, click the + button in the Connection field to open the connection page.
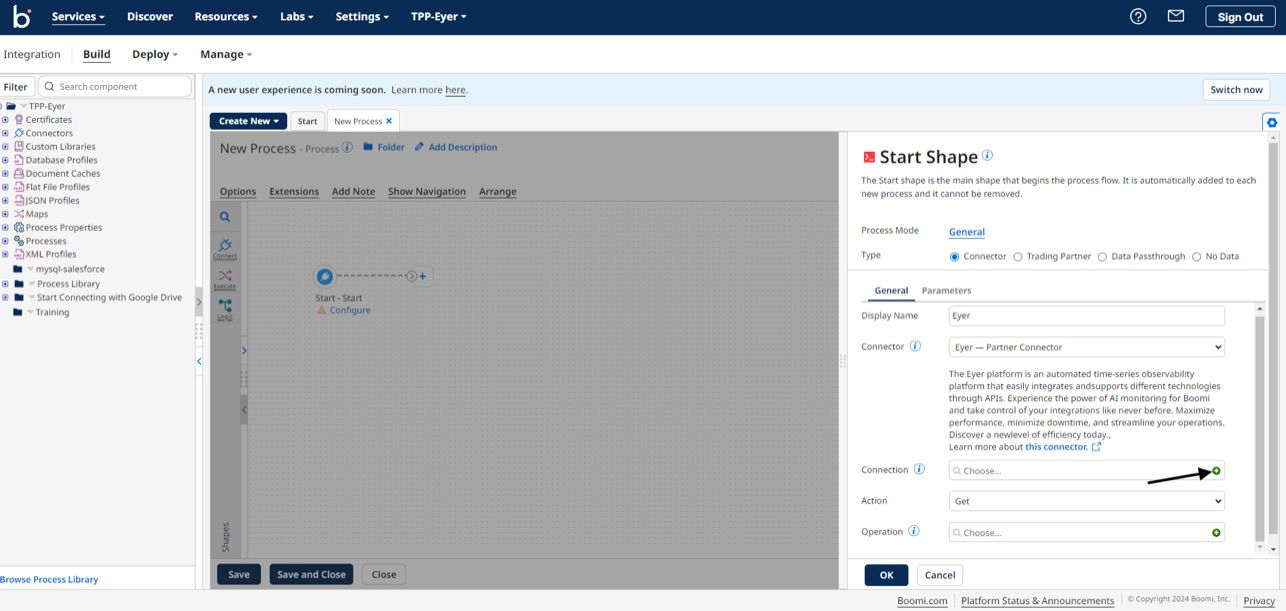
Leave the Server and the Eyer authentication key fields as their default values.
In the Custom Authentication Credentials field, click the Encrypted button and fill it out with your Eyer authentication key.
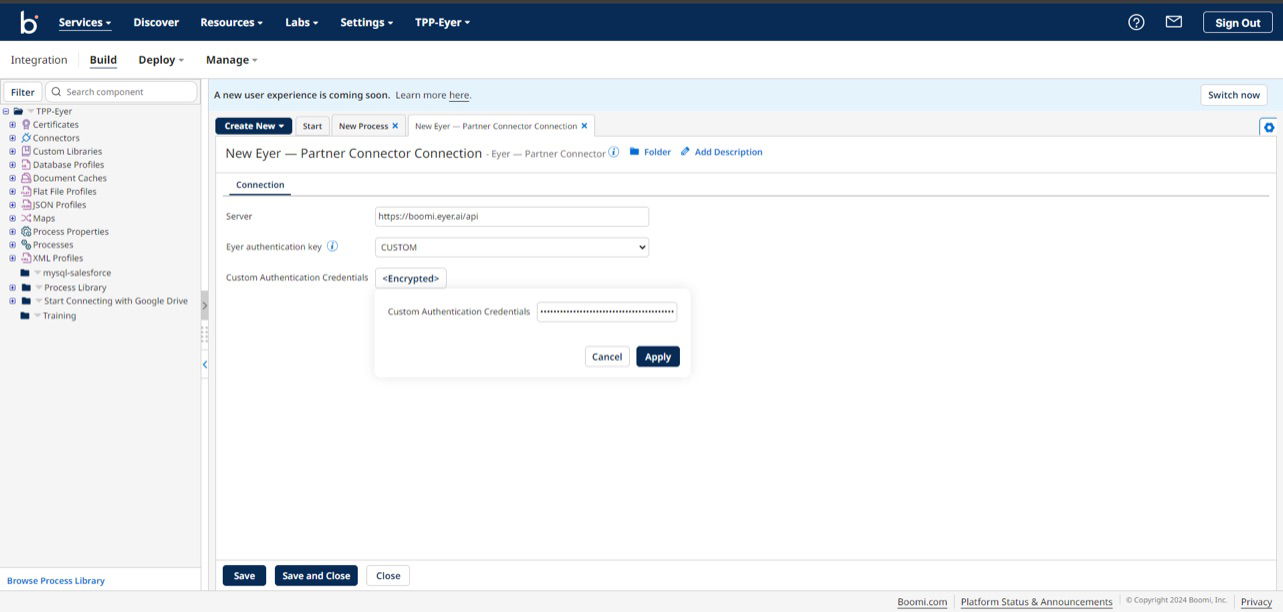
Click the Save and Close button to return the Eyer connector sidebar.
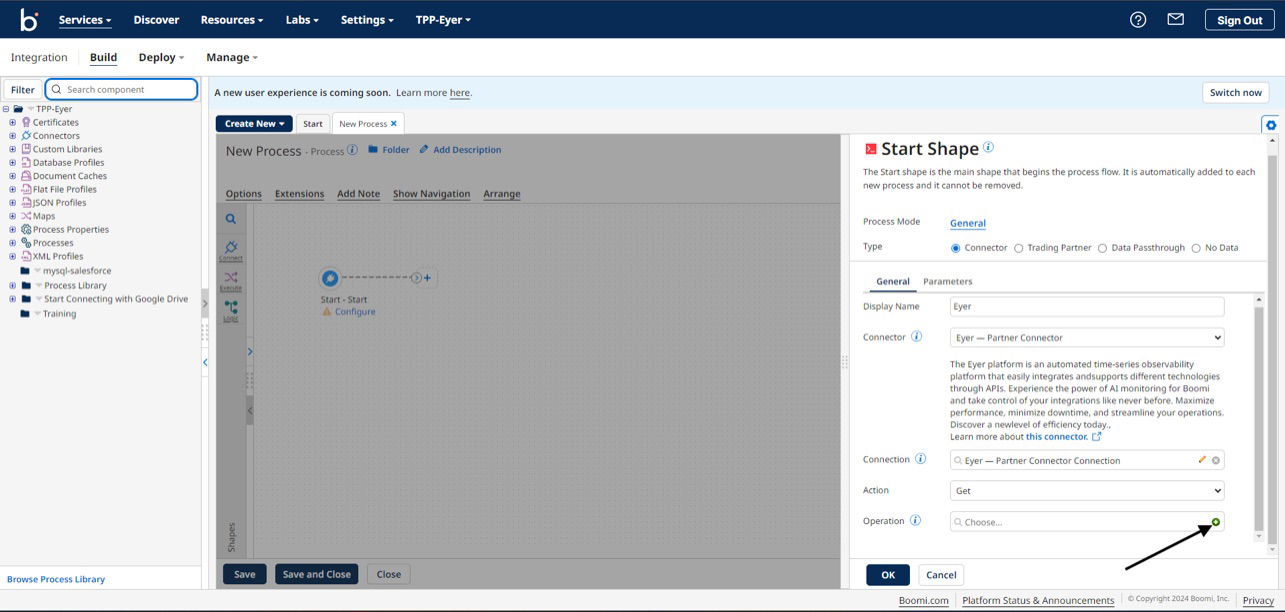
Creating Eyer-Partner operation
In the sidebar, select a Get action and then click the + button on the Operation field to create a new Eyer operation.
Clicking the + button opens up the Eyer operation’s page. On this page, click the Import Operation button to create a new operation.
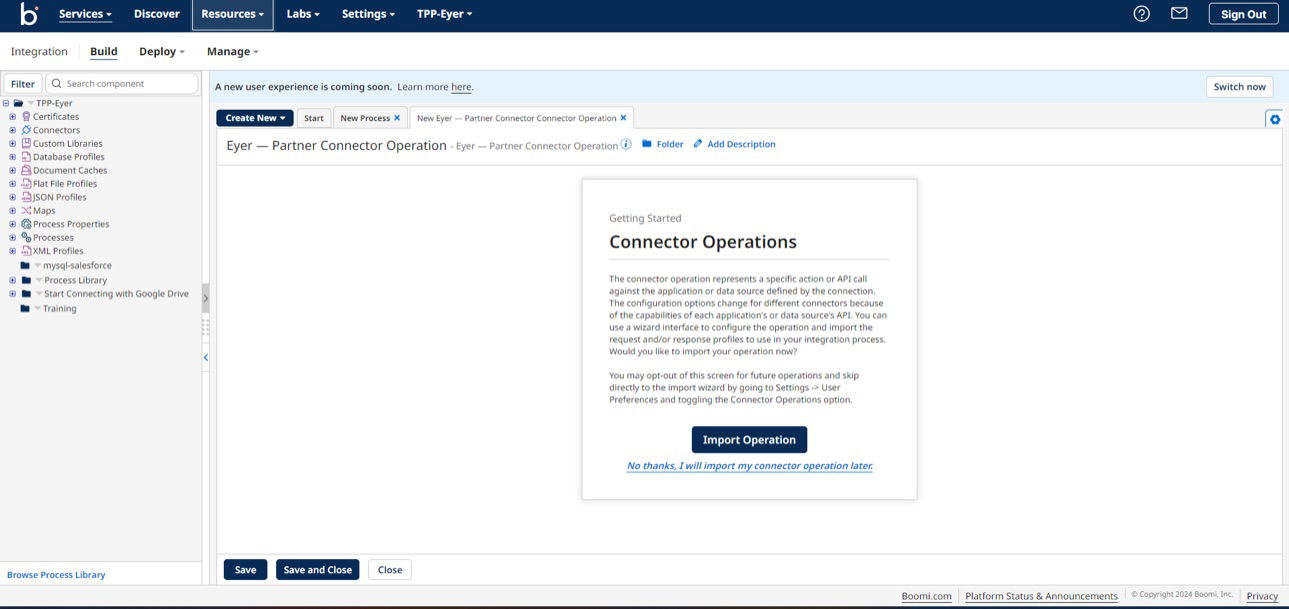
This action opens up the Eyer-Partner Connector Operation Import modal. Fill out this modal with the following information:
- Atom: Select the Atom you are running the process in from your dropdown
- Connection: Select the Eyer connection you made for this process

Click on the Next button to save your operation. Then, select the Object Type that fits your purpose:
- Anomalies returns a list of anomaly alerts grouped by correlation
- Anomalies with metrics return a list of anomaly alerts grouped by correlation metrics, including their respective values and baseline values at the time of the alert (new/updated)
In this example, we select the Anomalies with metrics object type. Click on the Next button to save your Object Type preference, and click the Finish button to see your Eyer response profile loaded on your Operation page.
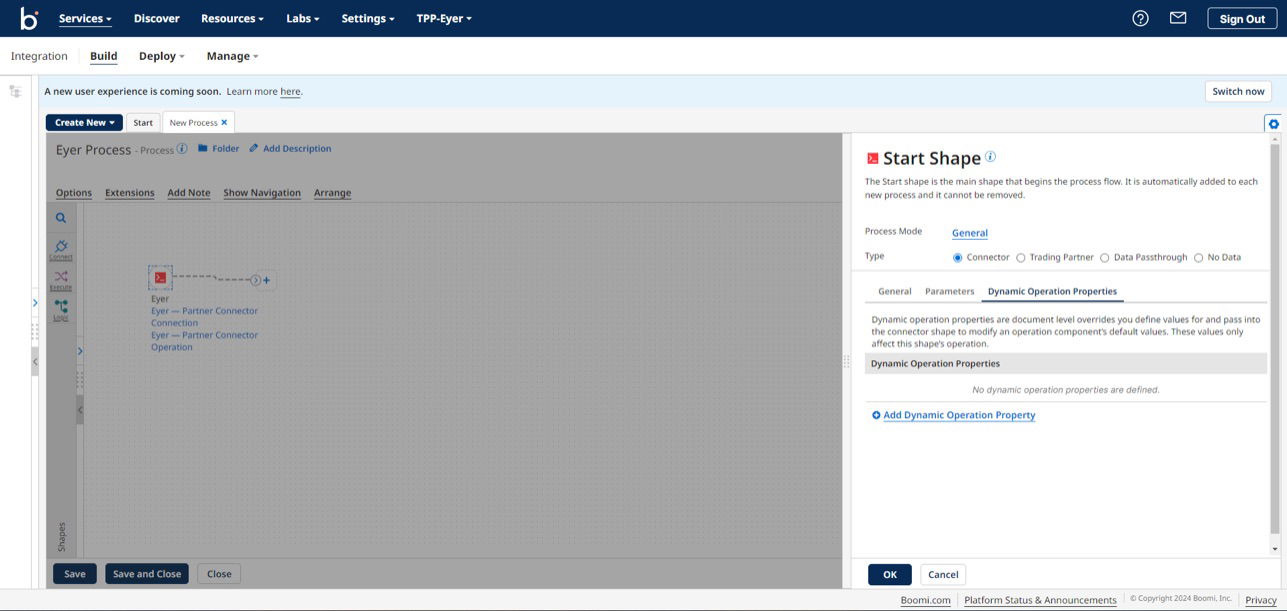
Next, you need to define the operation values. These values define the information required in anomaly alerts. For the Eyer-Partner connector, you can define operation values using either the Options or Dynamic operation property.
- Options are great for static operation values.
- Dynamic operation properties are better when the start and end values are always changing. To learn more about the distinction between options and dynamic operation properties, check the official documentation on Configuring the Eyer connector.
This guide will use Dynamic Operation properties to determine the Operation’s value.
Setting operation value with Dynamic operation properties
To set up the Dynamic Operation properties, navigate to the Dynamic Operation Properties tab and click the Add Dynamic Operation Property.
This action opens up a Parameter Value modal; in this modal, select the following options:
- Input → Query from
- Type → Date/Time
- Date Mask → yyyy-MM-dd’T’HH:mm:ssZ
- Date Type → Last Successful Run Date
These Parameter Value options tell the Eyer-Partner Connector to start the query for anomalies since the last test.

Click the OK button to return to the Dynamic Operation Properties tab.
Next, create a new Dynamic Operation Property, filling in the Parameter Value with the following information:
- Input → Query to
- Type → Date/Time
- Date Mask → yyyy-MM-dd’T’HH:mm:ssZ
- Data Type → Current Date
These values tell the Eyer-Partner Connector to query the current date for anomalies.

Click the OK button to save the parameter value and return to the sidebar.
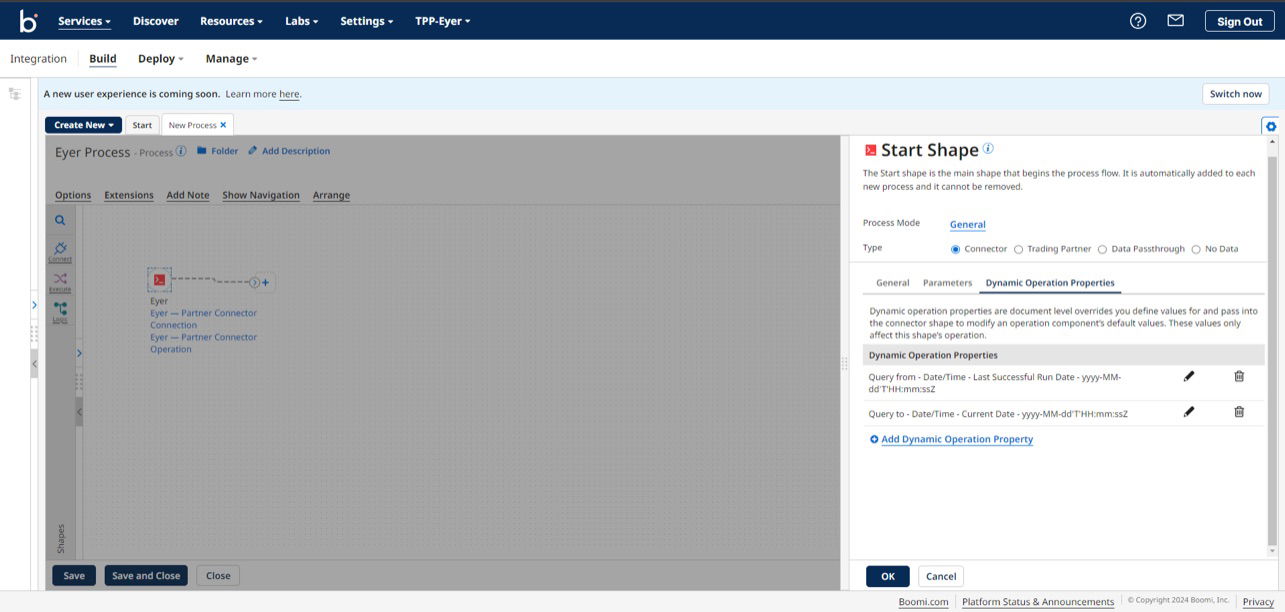
Click the OK button to save the Dynamic Operation Property configuration and return to the Boomi process canvas.
Sending out the email
With Boomi, you have multiple options for receiving these anomalies. This guide uses the Boomi Mail connector. To learn how to configure the Mail connector, check out the Boomi Mail connector documentation.

Here are the anomalies from the CPU stress test received in the mail.
{
  "new": [],
  "updated": [
    {
      "severity": "medium",
      "started": "2024-06-26T18:43:00Z",
      "ended": null,
      "updated": "2024-06-26T19:27:00Z",
      "id": "667c6193d58419f64f4cb403",
      "items": [
        {
          "node": {
            "id": 64,
            "name": "Operating System. undefined",
            "system": {
              "id": 1,
              "name": null
            }
          },
          "metrics": [
            {
              "id": "2ce746c5-1ee3-45d1-b23f-bae56bc5d51a",
              "name": "Committed Virtual Memory Size",
              "metric_type": "int",
              "aggregation": "avg",
              "severity": "severe",
              "started": "2024-06-26T18:42:00Z",
              "updated": "2024-06-26T19:12:00Z"
            },
            {
              "id": "5523ee20-2af2-4b8e-8390-3d2cb4410018",
              "name": "System CPU Load",
              "metric_type": "double",
              "aggregation": "avg",
              "severity": "medium",
              "started": "2024-06-26T19:25:00Z",
              "updated": "2024-06-26T19:26:00Z"
            },
            {
              "id": "a59df24a-e9ec-4c4c-a087-ea1375d4b9c7",
              "name": "Process CPU Load",
              "metric_type": "double",
              "aggregation": "avg",
              "severity": "medium",
              "started": "2024-06-26T19:26:00Z",
              "updated": "2024-06-26T19:27:00Z"
            }
          ]
        }
      ]
    }
  ],
  "closed": [
    {
      "severity": "low",
      "started": "2024-06-26T18:49:00Z",
      "ended": "2024-06-26T19:37:00Z",
      "updated": "2024-06-26T19:37:00Z",
      "id": "667c62f7d58419f64f4cb426",
      "items": []
    }
  ]
}
This alert has anomalies whose values have been updated. This is because the environment used in this tutorial has been running for a while and has experienced different anomalies and changes to these anomalies. In your environment, these anomalies might appear in the new object.
The anomalies are in the Operating System node. A node is a group of metrics that work together. Refer to the official documentation to understand the list of nodes and the metrics underneath these nodes.
This node has a couple of anomalies on the following metrics:
- Committed Virtual Memory Size: This metric is flagged as severe, indicating that the Committed Virtual Memory size metric significantly deviates from past observed behavior and has the highest likelihood of being a disruptive anomaly. To learn more about the severity property, check out the official documentation on Alerting.
- System CPU Load: This metric indicates the overall CPU load on the system. It has a medium severity, meaning that the metric occasionally deviates from the previously observed and learned behavior. A medium severity indicates a moderate probability that this is an anomaly.
- Process CPU Load: This metric indicates the CPU load of a specific process and has a severity value of medium.
Additionally, you can see a Closed Anomalies array containing a previously detected low severity anomaly that has been resolved.
Deciphering the data using Grafana
Now that you have received the alert about the anomalies in the host system let's view these alerts on a Grafana dashboard.
Grafana is fantastic for many reasons, one of which is that it simplifies the visualization of your JSON data and aids in monitoring system metrics. To learn more about how Grafana can benefit you, check out this article on Observability with Grafana and Eyer.
Setting up Grafana with Eyer
To set up and connect Grafana to visualize your Eyer data, follow these steps:
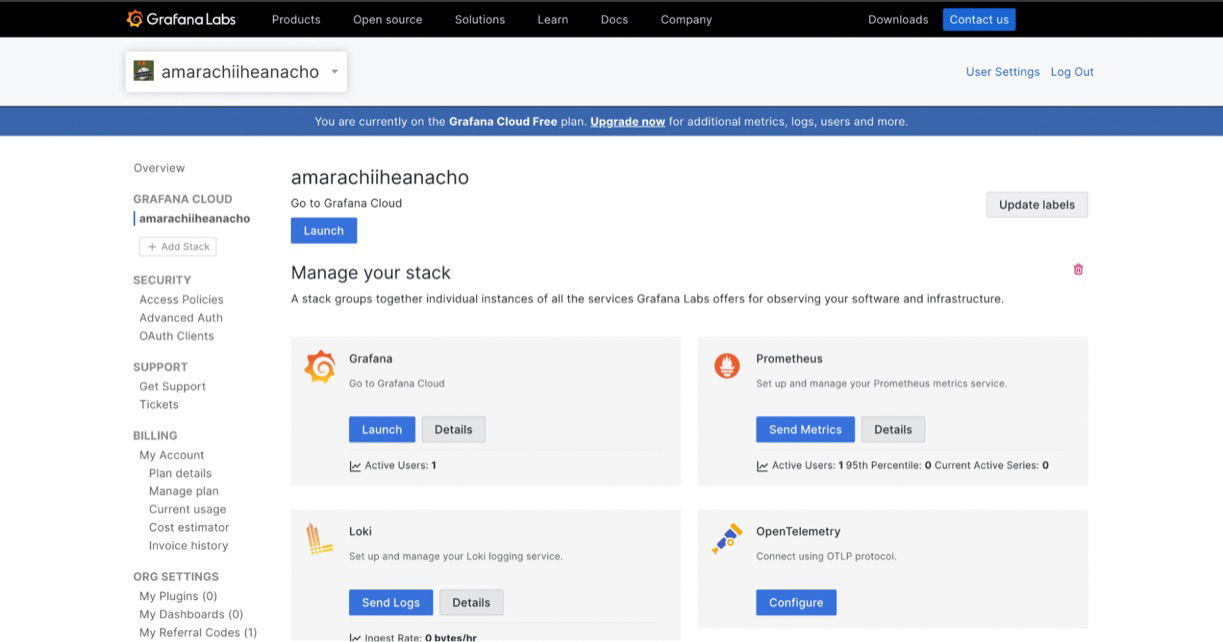
- Log in to your Grafana account.
- Launch Grafana Cloud:
- In the Grafana Cloud portal page, click the "Launch" button. This will take you to your Grafana Cloud page. Click the "Launch" button again to go to the Dashboard page.
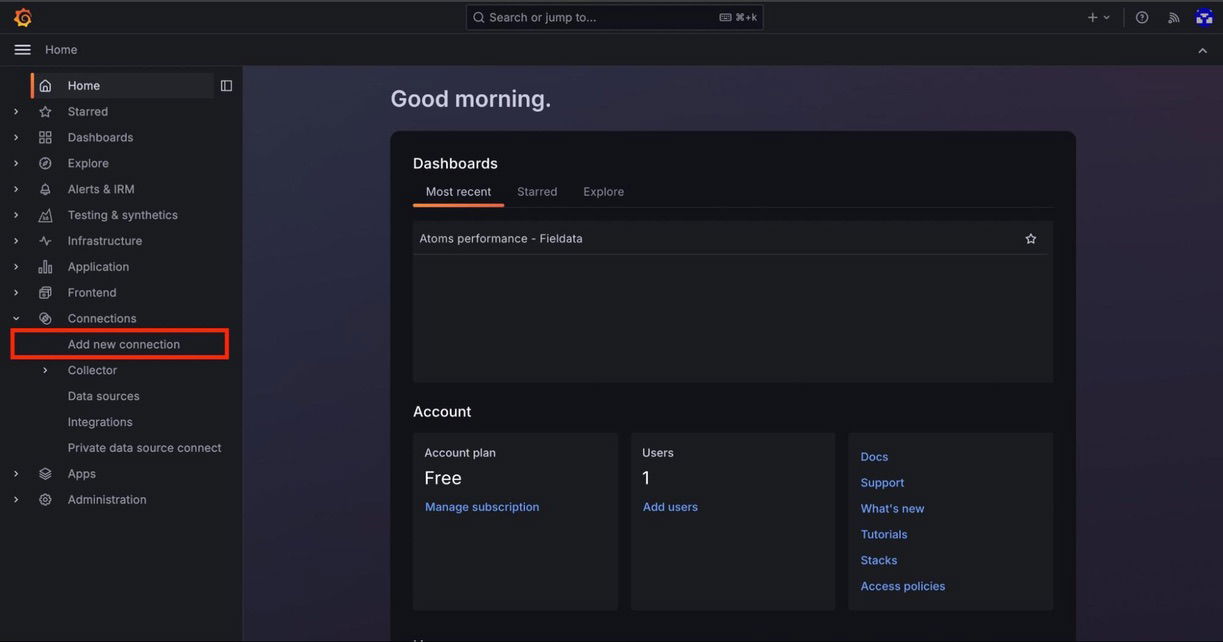
3. Add a new connection:
- On the Dashboard page, navigate to the left-hand side menu and select the "Add new connection" tab.
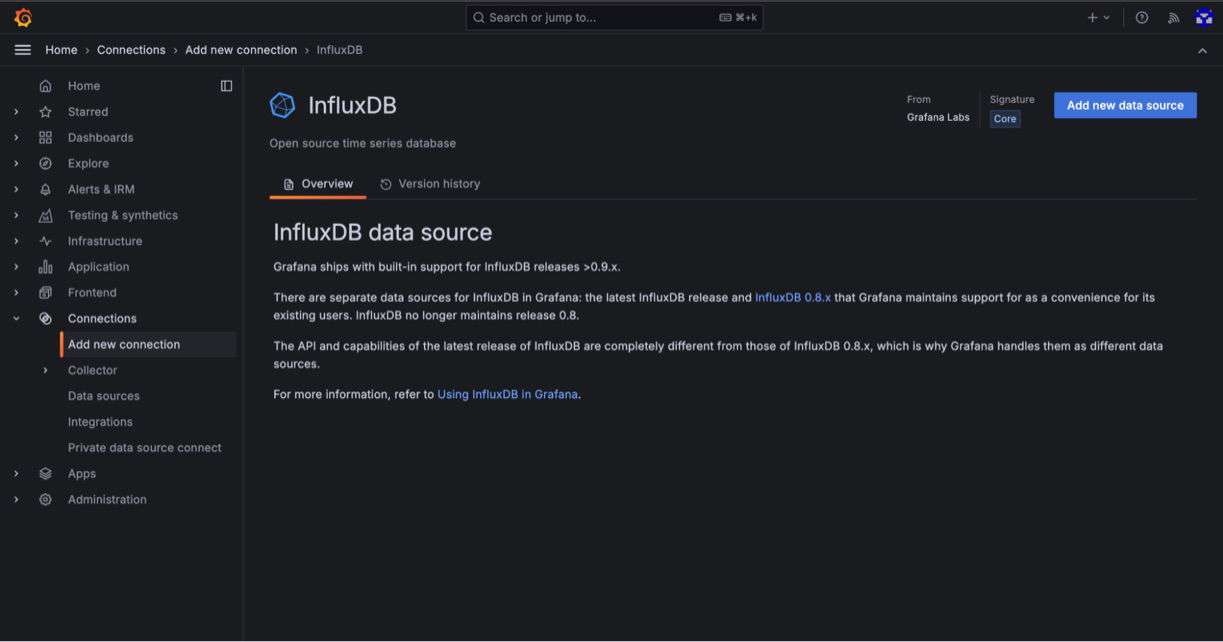
- In the "Add new connection" page, select "InfluxDB."

4. Add a new data source:
- On the InfluxDB page, click “Add new data source.”
5. Configure the data source settings: On the settings page, set the following configuration fields:
- Set “Query language” to “Flux.”
- Set “URL” to “https://westeurope-1.azure.cloud2.influxdata.com.”
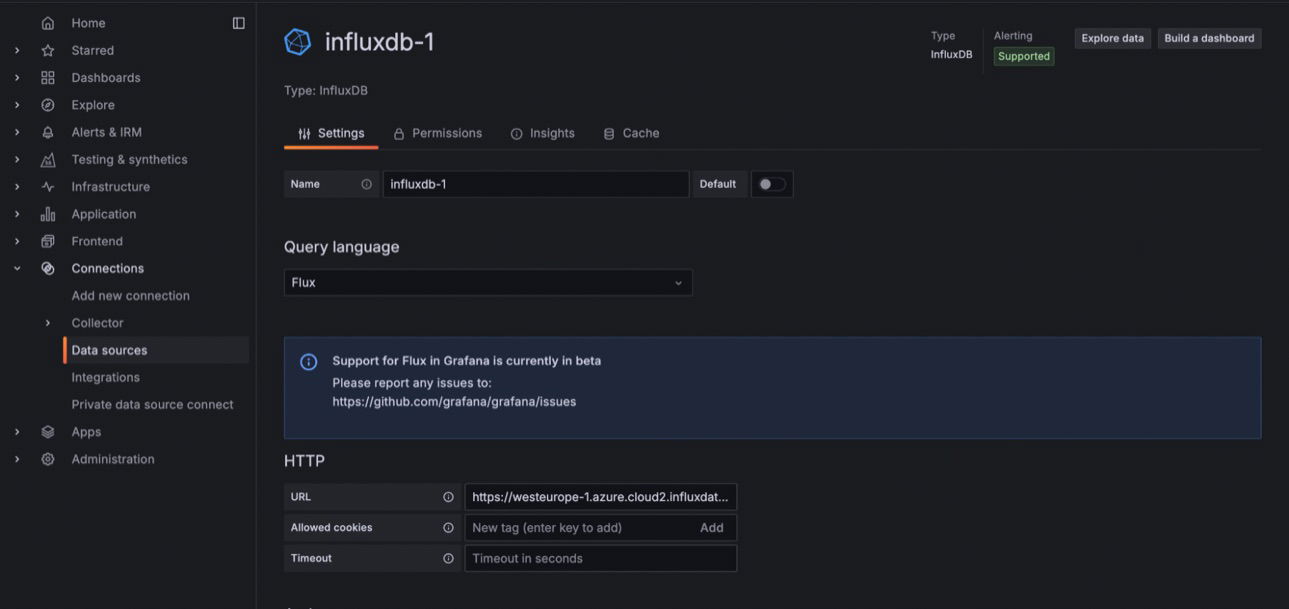
- In the “Auth” section, turn off basic auth.
- Under “InfluxDB Details,” enter the “Organization” and “Token” values you received with your InfluxDB details.

6. Save and test the connection:
- Click “Save and test.” If the connection works, a notification should pop up, and you can proceed to the next step.

If it doesn't work, double-check your settings. If the problem persists, send a support request or contact us on the official Eyer Discord channel.
7. Create a dashboard:
- Click the "building a dashboard" link in this connection pop-up. This will take you to the “Start your new dashboard by adding a visualization” page.

8. Import a dashboard:
- On the next page, click “Import a dashboard” to go to the Import dashboard page.
- Click “Upload dashboard JSON file” on this page and select the JSON file you received with your InfluxDB details.

You should now have a dashboard containing the core metrics monitored by Eyer, including multiple baselines.
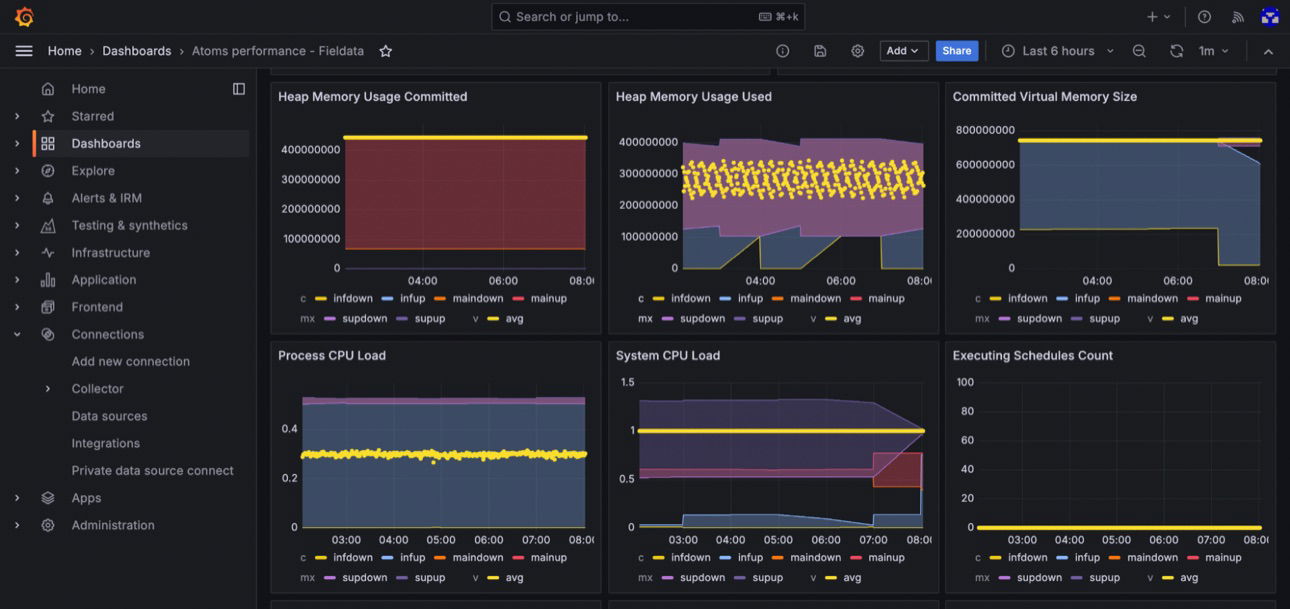
In the image above, you can see some of the core metrics monitored by Eyer, including their data points and primary and secondary baselines, represented in different colors. These data points and baselines are plotted on a time axis (x-axis) and a value axis (y-axis). The different colored lines and shaded areas represent the following:
- Data points on your metrics are in yellow
- The primary baselines, which indicate the main behaviors of your system, are in red.
- The secondary behaviors and baselines are distinguished by two different shades of blue. For more information on baselines and the behaviors they represent, refer to the documentation on Onboarding, preprocessing, and filtering of the data.
It is important to note that the purple shading in the graph results from the overlap between the main and secondary baselines, which are red and blue, respectively.
Understanding the anomalies from the Grafana dashboards
To understand how to recognize anomalies from the Grafana dashboards, this section will look at the Committed Virtual Memory Size, Process CPU Load, and the System CPU Load metrics.

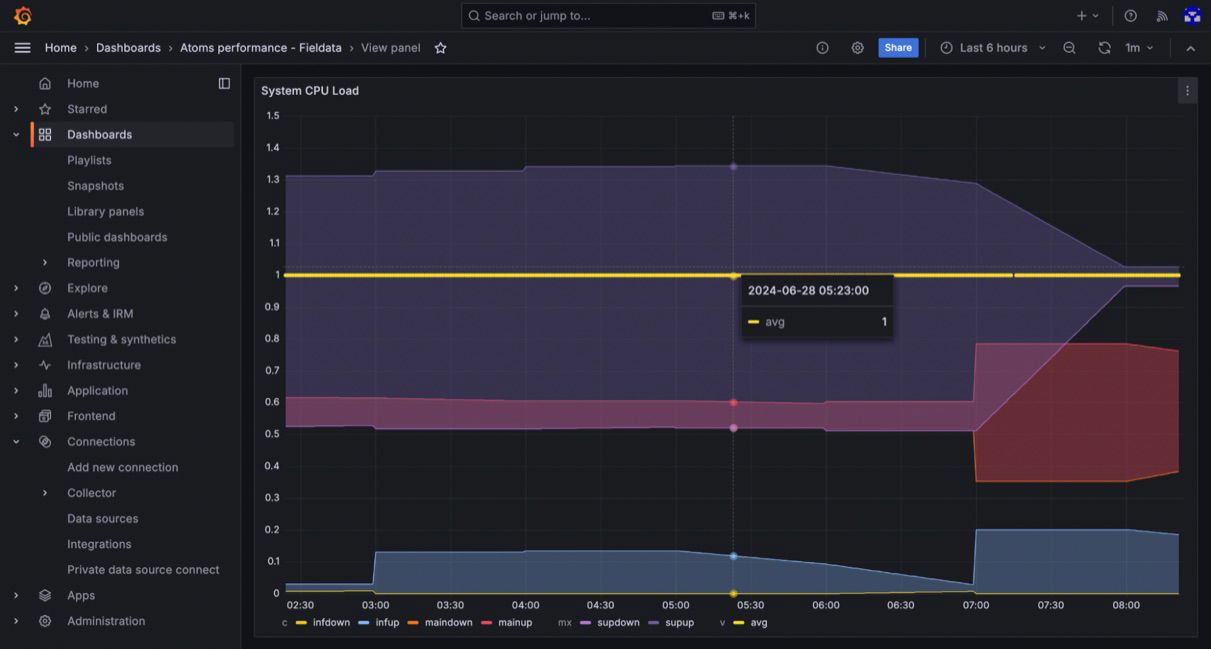
In the images above, the Process CPU Load and System CPU Load data points exist outside the primary baseline (red-shaded areas) but within the secondary baselines, coinciding with their medium severity level.

However, an interesting anomaly observation is the Committed Virtual Memory Size, with data points existing outside the main and secondary baselines. This observation coincides with its severity level.
In summary
Machine learning and artificial intelligence is changing almost everything around us, especially the monitoring and observability space. With modern software development becoming more and more complex, AI-powered insights can be the difference between quickly identifying and resolving issues or experiencing prolonged downtime and performance degradation.
This article demonstrates the power of AI-powered observability by walking through the process of injecting anomalies into a system, querying these anomalies with the Eyer connector, and visualizing them using Grafana.
However, this is just the beginning of what AI-powered insights can do for you. To learn more about Eyer and Grafana and to get started, check out the official Eyer documentation.