Eyer AIOps and Grafana work together to improve IT operations:
- Eyer AIOps: AI-powered platform for automating tasks and predicting issues
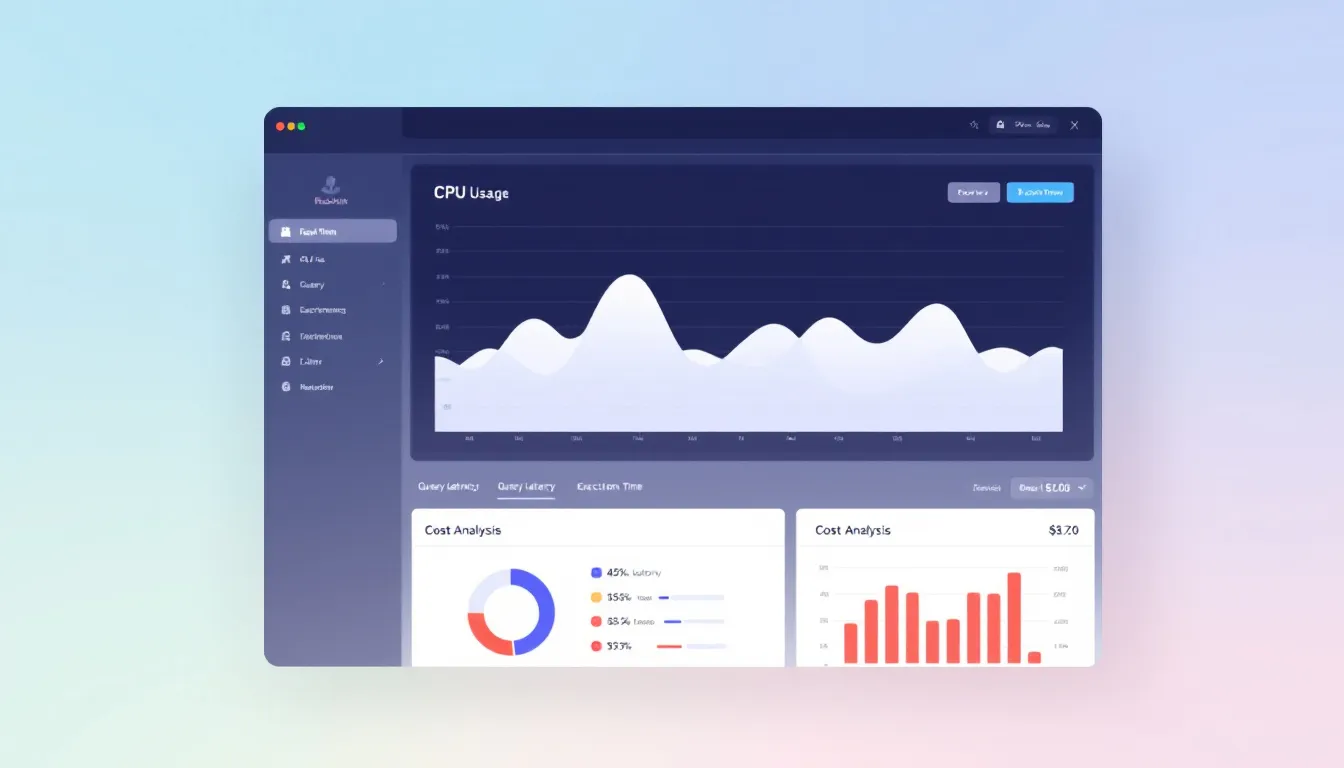
- Grafana: Tool for creating visual dashboards and monitoring systems
Key benefits of integration:
| Benefit | Description |
|---|---|
| Complete view | See all IT system parts at once |
| Faster problem-solving | Find and fix issues quickly |
| Better decisions | Use real-time data to guide choices |
| Improved reliability | Keep systems running smoothly |
Integration steps:
- Prepare hardware and software
- Set up Eyer AIOps API
- Configure Grafana data source
- Link systems and test connection
Advanced features:
- Custom dashboards
- Automated alerts
- AI-powered predictions
This integration helps IT teams work more efficiently, reduce downtime, and make data-driven decisions.
Related video from YouTube
2. Eyer AIOps: Key Features and Benefits

Eyer AIOps is an AI-powered platform that improves IT operations management. It uses machine learning to help IT teams work better and more efficiently.
2.1 Main functions of Eyer AIOps
Eyer AIOps offers four main functions:
1. Spotting Unusual Patterns:
- Uses machine learning to find odd system behaviors
- Warns IT teams about possible problems early
- Cuts down on false alarms, helping teams focus on real issues
2. Automatic Problem-Solving:
- Carries out pre-set actions for common problems
- Reduces the need for manual work, saving time
- Ensures quick and consistent responses to issues
3. Predicting Future Problems:
- Looks at past data to guess future issues
- Helps plan maintenance and resource use
- Tries to stop system downtime before it happens
4. Finding Root Causes:
- Quickly finds the main reasons for IT problems
- Gives detailed information for faster fixes
- Helps stop issues from happening again by fixing their source
2.2 How Eyer AIOps helps IT teams
Eyer AIOps makes IT work easier and better:
| Benefit | How it helps |
|---|---|
| Saves time | Does routine tasks automatically |
| Keeps systems running | Finds and fixes problems before they cause trouble |
| Solves issues faster | Gives instant alerts and automatic responses |
| Helps make smart choices | Provides lots of data and analysis |
| Grows with your needs | Works well even as IT systems get bigger |
By using these features, IT teams can:
- Do less manual work and focus on important tasks
- Make systems work better and more reliably
- Spend less money on running IT systems
- Improve IT services and make users happier
Eyer AIOps is a helpful tool for IT professionals. It makes managing complex IT systems easier and more accurate.
3. Grafana: Functions and Uses
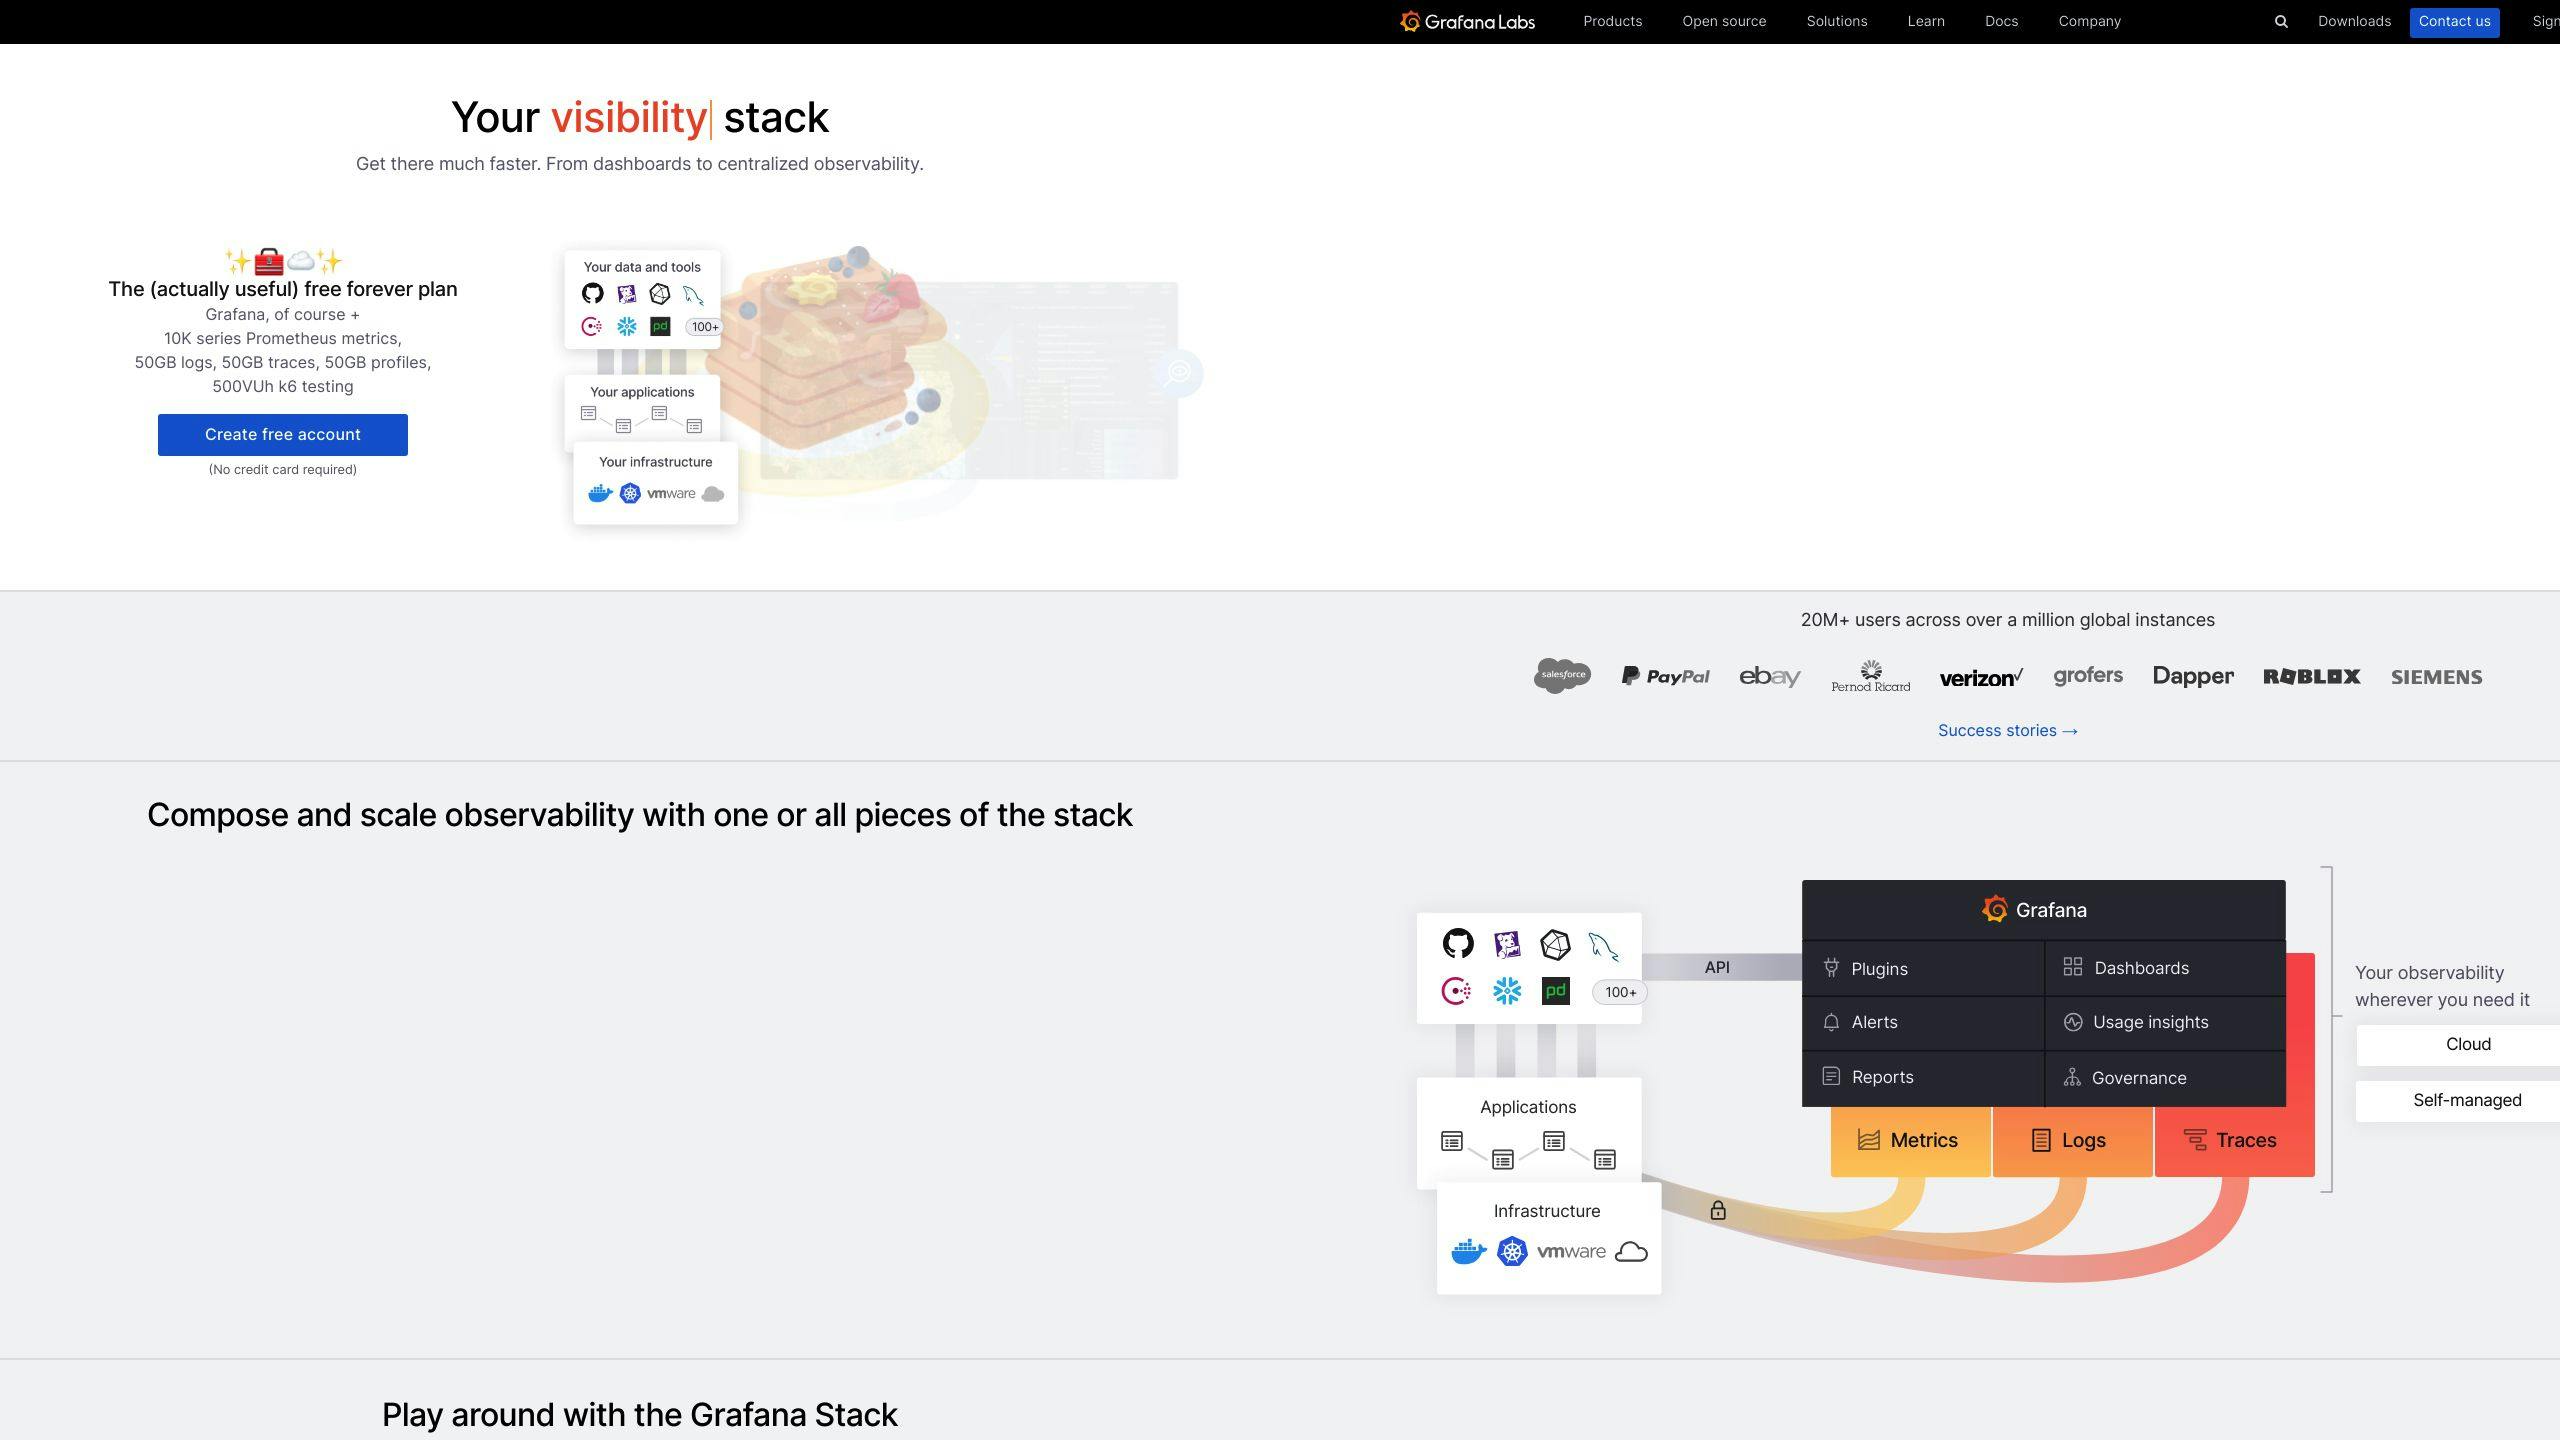
Grafana is a free tool for showing data visually and monitoring systems. It helps IT professionals and data analysts work better.
3.1 Main features of Grafana
Grafana offers these key features:
| Feature | Description |
|---|---|
| Data Source Integration | - Works with many data sources - Combines data from different places in one view |
| Customizable Dashboards | - Easy-to-use interface for making panels - Many ways to show data (graphs, tables, etc.) - Lets you share and export dashboards |
| Alerting System | - Sets up warnings based on data - Sends alerts through email, Slack, and more |
| User Management | - Controls who can see and do what - Organizes dashboards by teams |
3.2 How Grafana helps with data visualization
Grafana makes it easier to understand data:
1. Real-time Monitoring
- Shows live data updates
- Helps spot trends and odd patterns quickly
2. Interactive Exploration
- Lets users zoom in and out of data
- Allows picking specific time ranges to look at
3. Customizable Visualizations
- Offers many types of charts for different needs
- Lets users change how charts look (colors, scales, etc.)
4. Data Aggregation
- Puts data from many sources into one view
- Allows complex data queries for deeper analysis
By using these features, Grafana helps teams:
- See and understand their data better
- Spot problems faster
- Make smarter choices based on up-to-date information
4. What You Need Before Integration
Before you connect Eyer AIOps with Grafana, make sure you have everything ready. This will help you set things up smoothly.
4.1 Hardware and software needs
Here's what you need to run Eyer AIOps and Grafana:
| Item | Eyer AIOps | Grafana |
|---|---|---|
| CPU | 4+ cores | 2+ cores |
| RAM | 16+ GB | 8+ GB |
| Storage | 100+ GB SSD | 20+ GB |
| OS | Linux (Ubuntu 20.04+) | Linux, Windows, or macOS |
| Software | Docker, Kubernetes | Web browser (Chrome, Firefox, Safari) |
Also, make sure you have:
- A good internet connection
- The latest versions of Eyer AIOps and Grafana
- The right APIs and plugins for your data sources
4.2 Access rights you need
You need the right access to set up and manage the connection:
1. For Eyer AIOps:
- Admin rights on the Eyer AIOps system
- API tokens to get data and change settings
2. For Grafana:
- Admin or Editor role
- Ability to make and change dashboards
- Access to data source settings
3. For your network:
- Firewall settings that let Eyer AIOps and Grafana talk to each other
- Open ports for API calls and data transfer (usually port 3000 for Grafana)
4. For your data sources:
- Read/write access to the databases or data streams you need
- Login details for each data source you want to use
Make sure everyone on your team has the access they need. This will make setting up easier and help avoid problems.
5. How to Integrate Eyer AIOps with Grafana
This section shows you how to connect Eyer AIOps and Grafana step-by-step.
5.1 Getting ready
Before you start, make sure you have:
| Item | Requirement |
|---|---|
| Software | Eyer AIOps and Grafana installed and working |
| Access | Right permissions and API tokens for both systems |
| Network | Eyer AIOps and Grafana can talk to each other |
| Extras | All needed plugins and add-ons installed |
5.2 Setting up Eyer AIOps
To get Eyer AIOps ready:
- Log in to Eyer AIOps
- Go to "Integrations" or "API"
- Make a new API key
- Write down the API web address and key
5.3 Getting Grafana ready
To set up Grafana:
- Open Grafana
- Click "Configuration" > "Data Sources"
- Pick "Add data source"
- Choose "JSON API" or something that works with REST API data
5.4 Linking Eyer AIOps and Grafana
To connect the two:
- In Grafana, set up the new data source with Eyer AIOps API address
- Add the API key where it asks for it
- Set up how to get data from Eyer AIOps
- Test to make sure it's working
5.5 Making sure it works
To check if everything's okay:
- Make a new dashboard in Grafana
- Add a panel using Eyer AIOps data
- Set it up to show info from Eyer AIOps
- Refresh and check if data shows up right
- Look for any errors or weird data
If something's not right, check your settings and make sure all network connections are open. Look at the help guides for both Eyer AIOps and Grafana if you need more help.
sbb-itb-9890dba
6. Using Integrated Features
Now that you've connected Eyer AIOps with Grafana, let's look at how to use them together to make your IT work better.
6.1 How data moves between systems
Here's how Eyer AIOps and Grafana share information:
- Eyer AIOps gathers data from your IT systems
- It uses AI to study this data
- The results go to Grafana through the connection you set up
- Grafana shows this information in easy-to-read charts
This helps you see what's happening in your IT systems right away.
6.2 Making custom dashboards
You can now make Grafana dashboards that show Eyer AIOps data. Here's how:
- Pick important numbers to track
| What to Track | Why It's Important |
|---|---|
| System uptime | Shows if systems are working |
| Network speed | Tells you if the network is fast enough |
| How fast apps respond | Helps find slow programs |
| How many errors happen | Spots problems in your system |
- Choose the best ways to show data
- Use line graphs for data over time
- Use gauges to show current status
- Use heat maps to see patterns in lots of data
- Organize your dashboard
- Put related information together
- Arrange things in a way that makes sense
- Use Grafana's tools
- Use variables to change what data you see
- Mark important events on your charts
- Set up visual warnings when something's wrong
- Keep improving
- Ask others what they think
- Change your dashboards as needed
6.3 Setting up alerts
You can set up warnings to tell you when something's wrong. Here's how:
- Decide when to send alerts
| What to Watch | When to Alert | How Urgent |
|---|---|---|
| CPU Use | Over 90% for 5 minutes | Very |
| Error Rate | Over 5% for 15 minutes | Medium |
| Disk Space | Less than 10% free | Not very |
- Choose how to send alerts
- Email for small problems
- Text messages for big problems
- Connect to your ticket system to make tickets automatically
- Set up alert rules in Grafana
- Go to the alerts section
- Make new rules based on what you decided
- Test your alerts
- Make sure they work before you need them
- Plan for big problems
- Decide who to tell if the first person doesn't fix it
7. Tips for Best Performance
Here's how to make your Eyer AIOps and Grafana setup work better and stay safe.
7.1 Keeping systems up to date
Update Eyer AIOps and Grafana often to:
- Fix security problems
- Get new features
- Make the systems work better
Update when fewer people are using the systems. Always test updates before using them for real work.
7.2 Managing data effectively
Handle data well to keep your systems fast. Try these:
| What to do | Why it helps |
|---|---|
| Delete old data | Saves space, makes searches faster |
| Group old data | Finds trends faster, uses less space |
| Organize data better | Gets info quicker, puts less stress on the system |
Check how these work and change them if needed.
7.3 Keeping data safe
Protect your data to keep your AIOps setup working well. Do these things:
- Scramble data when it's stored and sent
- Use strong passwords and two-step login
- Check who can see what data
- Make plans for if something goes wrong
Use Grafana's tools to control who sees what. Follow the rules about keeping data safe in your industry.
8. Fixing Common Problems
When you connect Eyer AIOps with Grafana, you might run into some issues. Here's how to spot and fix common problems:
8.1 Connection issues
If you're having trouble connecting the two systems, try these fixes:
| Problem | How to Fix It |
|---|---|
| Wrong API address | Check and fix the API web addresses in both systems |
| Login problems | Make sure your API keys and passwords are right |
| Network issues | Check if your firewall is blocking the connection |
| Security certificate problems | Update old certificates, make sure they're set up right |
Always test the connection after you make changes to see if it's working.
8.2 Data doesn't match
Sometimes the data in Eyer AIOps and Grafana might not be the same. Here's what to do:
- Find where the data is different
- Make sure both systems are getting data from the same place
- Check if the data is being changed in either system
- Make sure both systems use the same time settings
- Set both systems to update data at the same time
8.3 System is slow
If things are running slowly after you connect the systems, try these steps:
- Check how much computer power and memory you're using
- Make your data searches simpler and faster
- Save common data to make it load faster
- Get a stronger computer or cloud service if needed
- Don't keep old data you don't need anymore
9. Advanced Integration Methods
After you've connected Eyer AIOps and Grafana, you can use more complex methods to make your work even better. These methods let you change things more, predict issues, and do routine tasks automatically.
9.1 Changing data flows
You can adjust how data moves between Eyer AIOps and Grafana to get better insights:
| Method | Description |
|---|---|
| Custom data routes | Make specific paths for data that fit your needs |
| Add extra info | Put more details into raw data before showing it in Grafana |
| Smart data sorting | Send different types of data to specific Grafana dashboards |
| Adjust update speed | Change how often different data updates to balance speed and system load |
9.2 Using AI to predict issues
AI can help you spot problems before they happen:
| AI Use | What it Does |
|---|---|
| Find odd patterns | Spot unusual data to fix issues quickly |
| Guess when things might break | Use old data to predict future problems |
| Plan for growth | Figure out what resources you'll need later |
| Find why problems keep happening | Use AI to find the main reasons for issues |
9.3 Doing tasks automatically
Letting computers do some jobs can save time and make work more consistent:
| Task | How it Helps |
|---|---|
| Make reports on a schedule | Set up automatic reports using data from both systems |
| Smart alerts | Change alert levels based on past data and current trends |
| Auto-fix some problems | Set up actions that happen when certain issues come up |
| Keep improving | Regularly check how things are working and make them better |
10. Checking Integration Success
Here's how to see if connecting Eyer AIOps and Grafana is working well for your IT team.
10.1 Important numbers to watch
Keep an eye on these key numbers:
| Number to Watch | What It Means | Why It Matters |
|---|---|---|
| System Uptime | How often systems are working | Shows if things are stable |
| Time to Answer Alerts | How fast you deal with warnings | Shows how quick you fix problems |
| Wrong Alerts | How many alerts are mistakes | Shows if the system spots real issues |
| Computer Use | How much of your computers you're using | Helps save money on equipment |
| Time to Fix Problems | How long it takes to solve issues | Shows how good you are at fixing things |
| People Using It | How many team members use the new setup | Shows if people find it helpful |
Check these numbers often to see how well Eyer AIOps and Grafana are working together.
10.2 How to check and improve
Try these ways to keep an eye on your setup:
1. Make easy-to-read screens
Use Grafana to show all the important numbers in one place.
2. Look at the numbers regularly
Check your numbers every month or three months to spot trends.
3. Ask your team what they think
Talk to the people using the system to see if it's helping them.
4. Test how much it can handle
Sometimes, make the system work extra hard to see if it can cope.
5. Compare old and new
Keep old records to see if things are better now than before.
11. Wrap-up
11.1 How connecting Eyer AIOps and Grafana helps
Putting Eyer AIOps and Grafana together makes IT teams work better:
| Benefit | Description |
|---|---|
| See everything | Eyer AIOps' smart analysis + Grafana's charts = full picture of IT |
| Work faster | Auto-alerts and custom screens help teams focus on big problems |
| Make smart choices | Better understanding of complex data leads to good decisions |
11.2 What's coming next
Eyer AIOps and Grafana will keep getting better:
| Future Update | What It Means |
|---|---|
| Smarter problem-spotting | New AI might find issues before they happen |
| More data sources | Can watch and study more parts of your IT setup |
| More auto-fixes | Computers might fix more common problems on their own |
As these tools get better, IT teams will be able to do more with less work using Eyer AIOps and Grafana together.