Looking for Datadog alternatives? Here's a quick overview of 8 strong options:
- Prometheus - Open-source metrics collection
- Grafana - Customizable data visualization
- SigNoz - Open-source with OpenTelemetry support
- New Relic - Full-stack observability
- Dynatrace - AI-powered insights
- Splunk - Powerful log analytics
- AWS CloudWatch - Native AWS monitoring
- Azure Monitor - Comprehensive Azure monitoring
Quick Comparison:
| Tool | Key Strength | Open Source | AI Features | Cloud-Native |
|---|---|---|---|---|
| Prometheus | Metrics collection | Yes | Limited | Yes |
| Grafana | Visualization | Yes | Via plugins | Yes |
| SigNoz | OpenTelemetry | Yes | Yes | Yes |
| New Relic | Full-stack monitoring | No | Yes | Yes |
| Dynatrace | Automated insights | No | Advanced | Yes |
| Splunk | Log analytics | No | Yes | Partial |
| AWS CloudWatch | AWS integration | No | Limited | AWS only |
| Azure Monitor | Azure integration | No | Yes | Azure focused |
These tools offer unique features for different needs. Consider your specific requirements, infrastructure, and budget when choosing. The observability market is growing fast, with options to fit various use cases.
Related video from YouTube
1. Prometheus
Prometheus is an open-source monitoring system popular in cloud-native environments. It excels at collecting and storing time-series data for monitoring infrastructure and applications.
Key features:
- Pull-based model for scraping metrics
- PromQL query language
- Time series database
- Service discovery
- Alerting capabilities
Prometheus works well with Kubernetes and integrates with various tools. While free to use, consider associated costs:
| Cost Category | Description |
|---|---|
| Infrastructure | Servers/cloud resources to run Prometheus |
| Maintenance | Managing and updating the system |
| Scaling | Potential challenges as infrastructure grows |
Cloud providers offer managed Prometheus services. For example, Amazon Managed Service for Prometheus pricing:
| Service | Cost |
|---|---|
| Ingestion | $0.30 per million samples |
| Storage | $0.03 per GB-month |
| Queries | $0.01 per million samples scanned |
Prometheus shines in extensibility, with many community-created exporters and plugins. It focuses on metrics, while Datadog offers more comprehensive monitoring.
2. Grafana
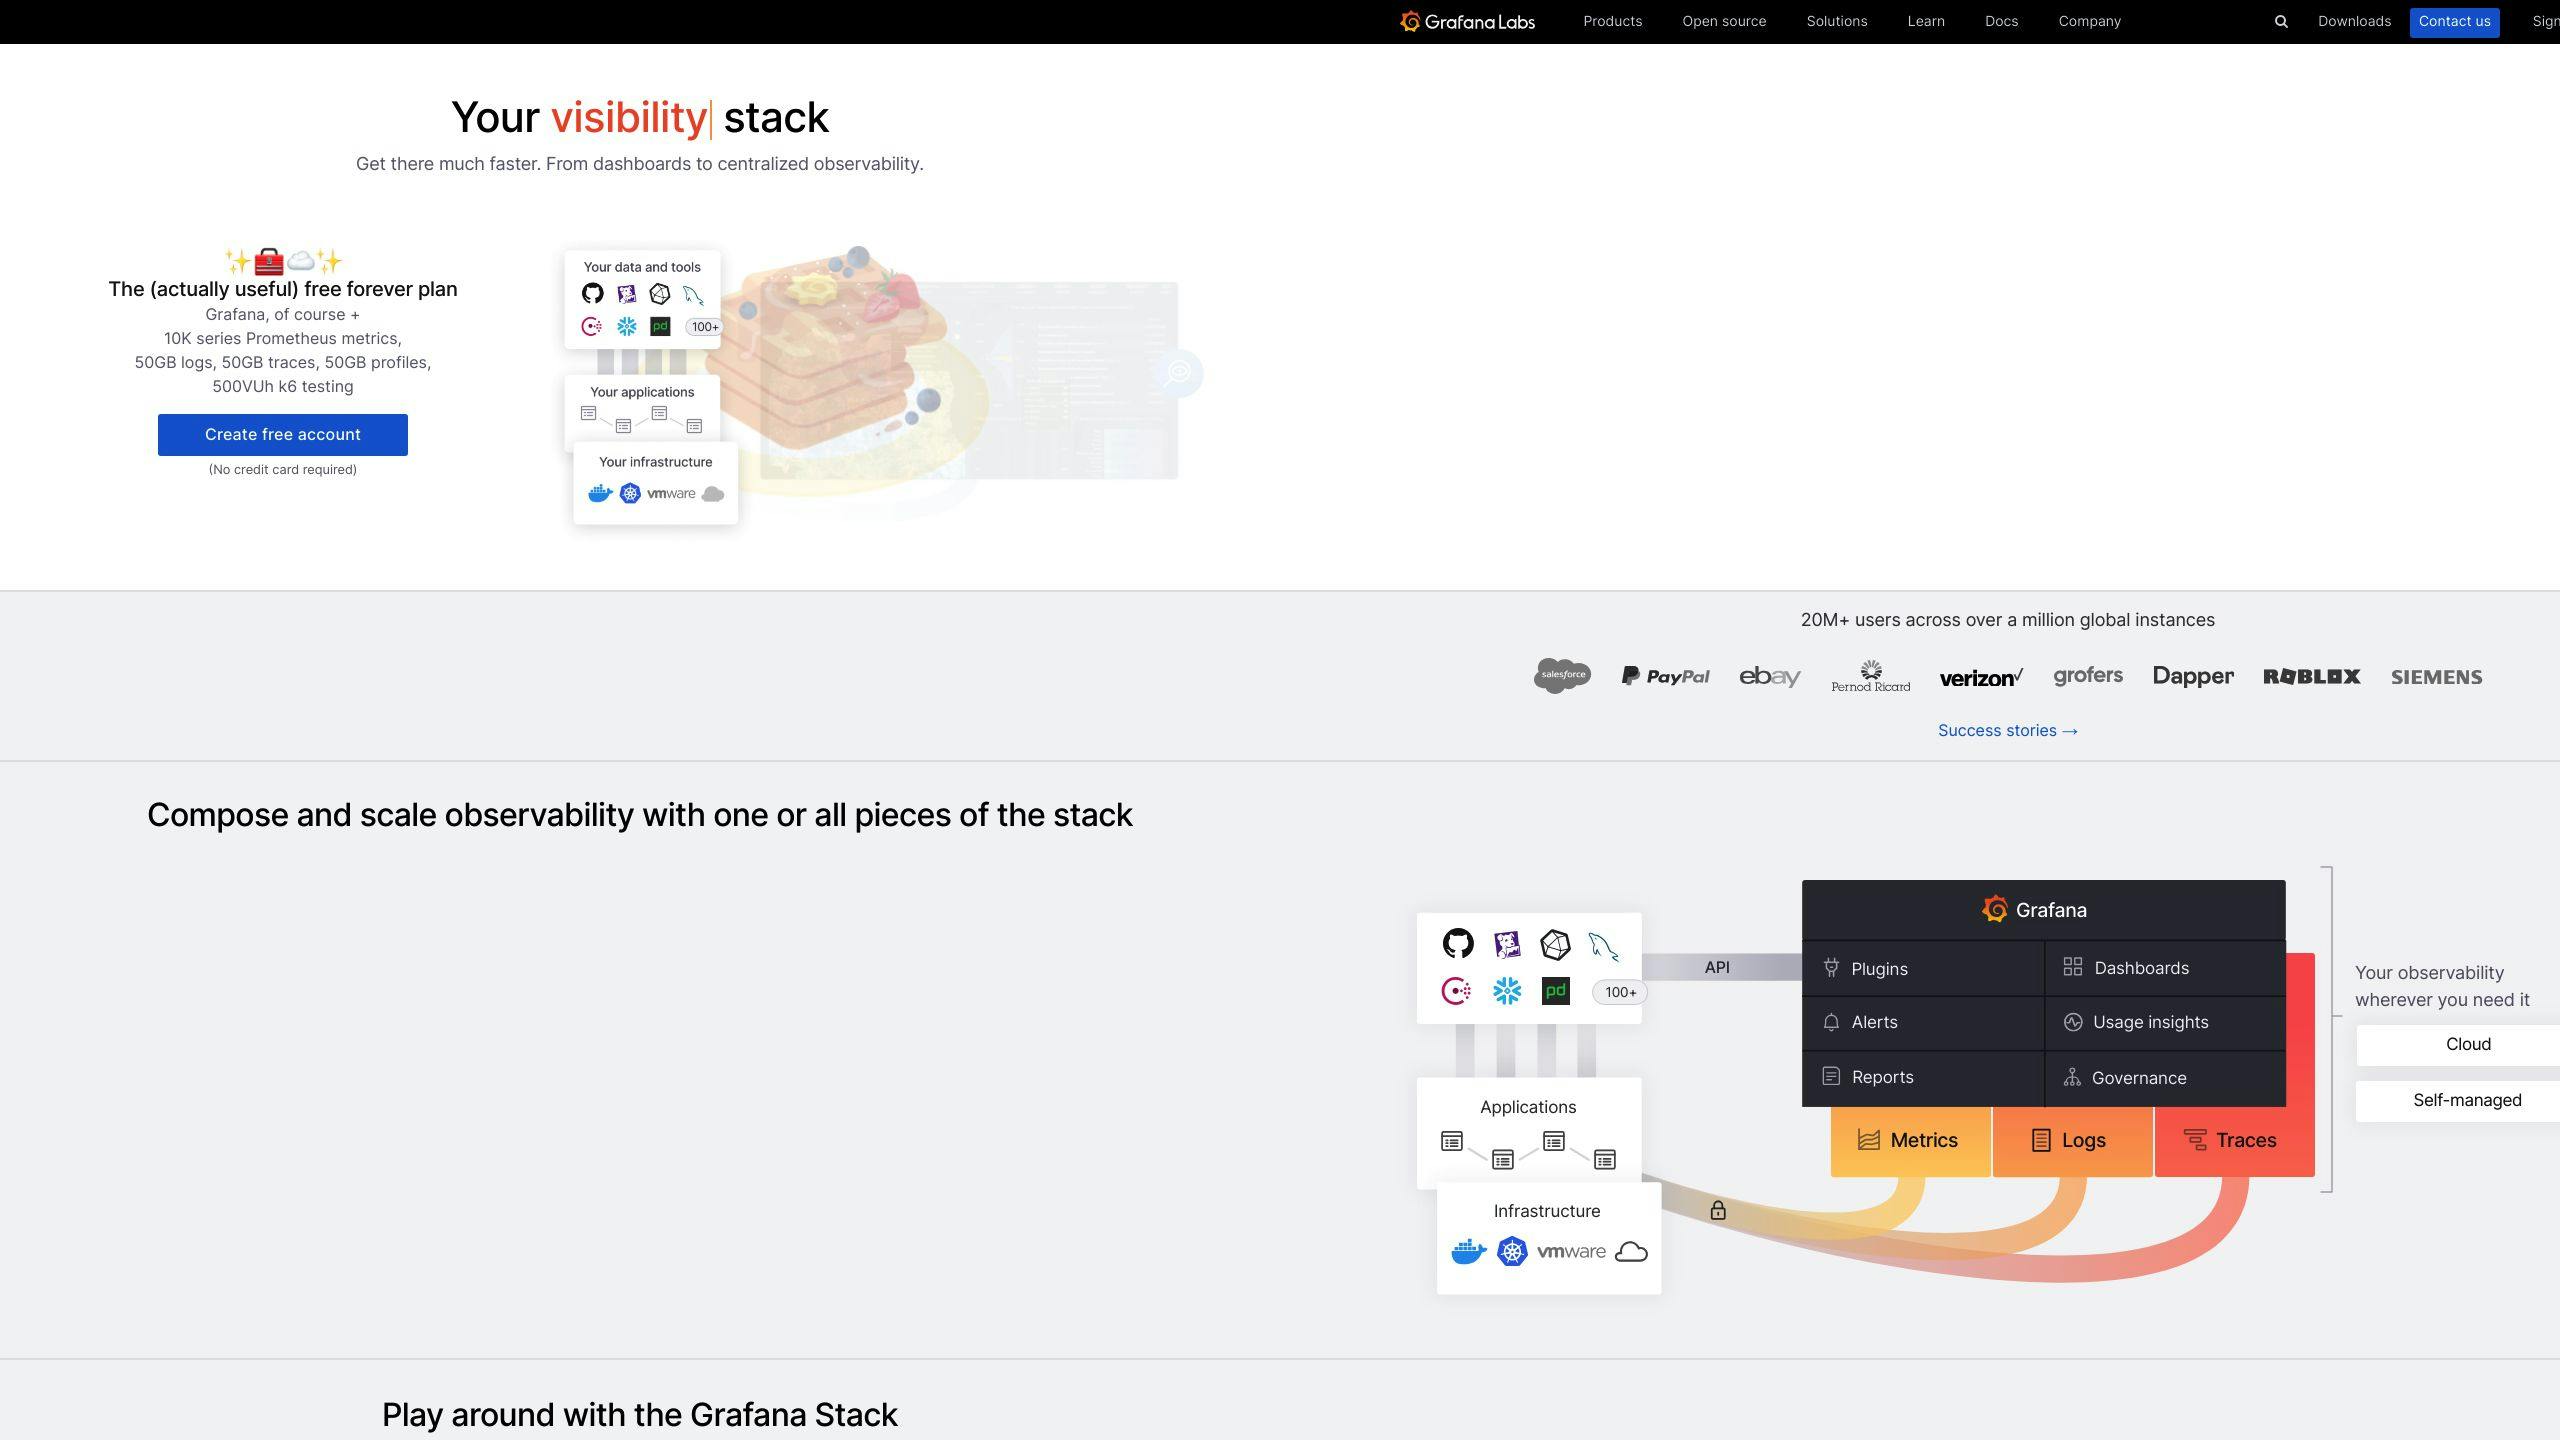
Grafana is an open-source platform for data visualization and analytics. It creates interactive dashboards displaying metrics from various sources.
Key features:
- Customizable dashboards
- Multi-source integration
- Plugin architecture
Grafana offers open-source and cloud versions:
| Version | Description | Cost |
|---|---|---|
| Open-source | Self-managed | Free |
| Grafana Cloud Pro | Managed service | $49/month |
Grafana Cloud Pro includes 15,000 series for metrics, 100 GB logs/traces, and access for 10 team members.
Comparing Grafana to Datadog:
| Aspect | Grafana | Datadog |
|---|---|---|
| Focus | Data visualization | Comprehensive monitoring |
| Setup | More initial configuration | Easier out-of-the-box |
| Customization | Highly customizable | Less flexible |
| Data sources | Wide range via plugins | More limited |
Grafana excels in flexibility and visualization. It's cost-effective but requires integration with alerting tools for full monitoring capabilities.
3. SigNoz
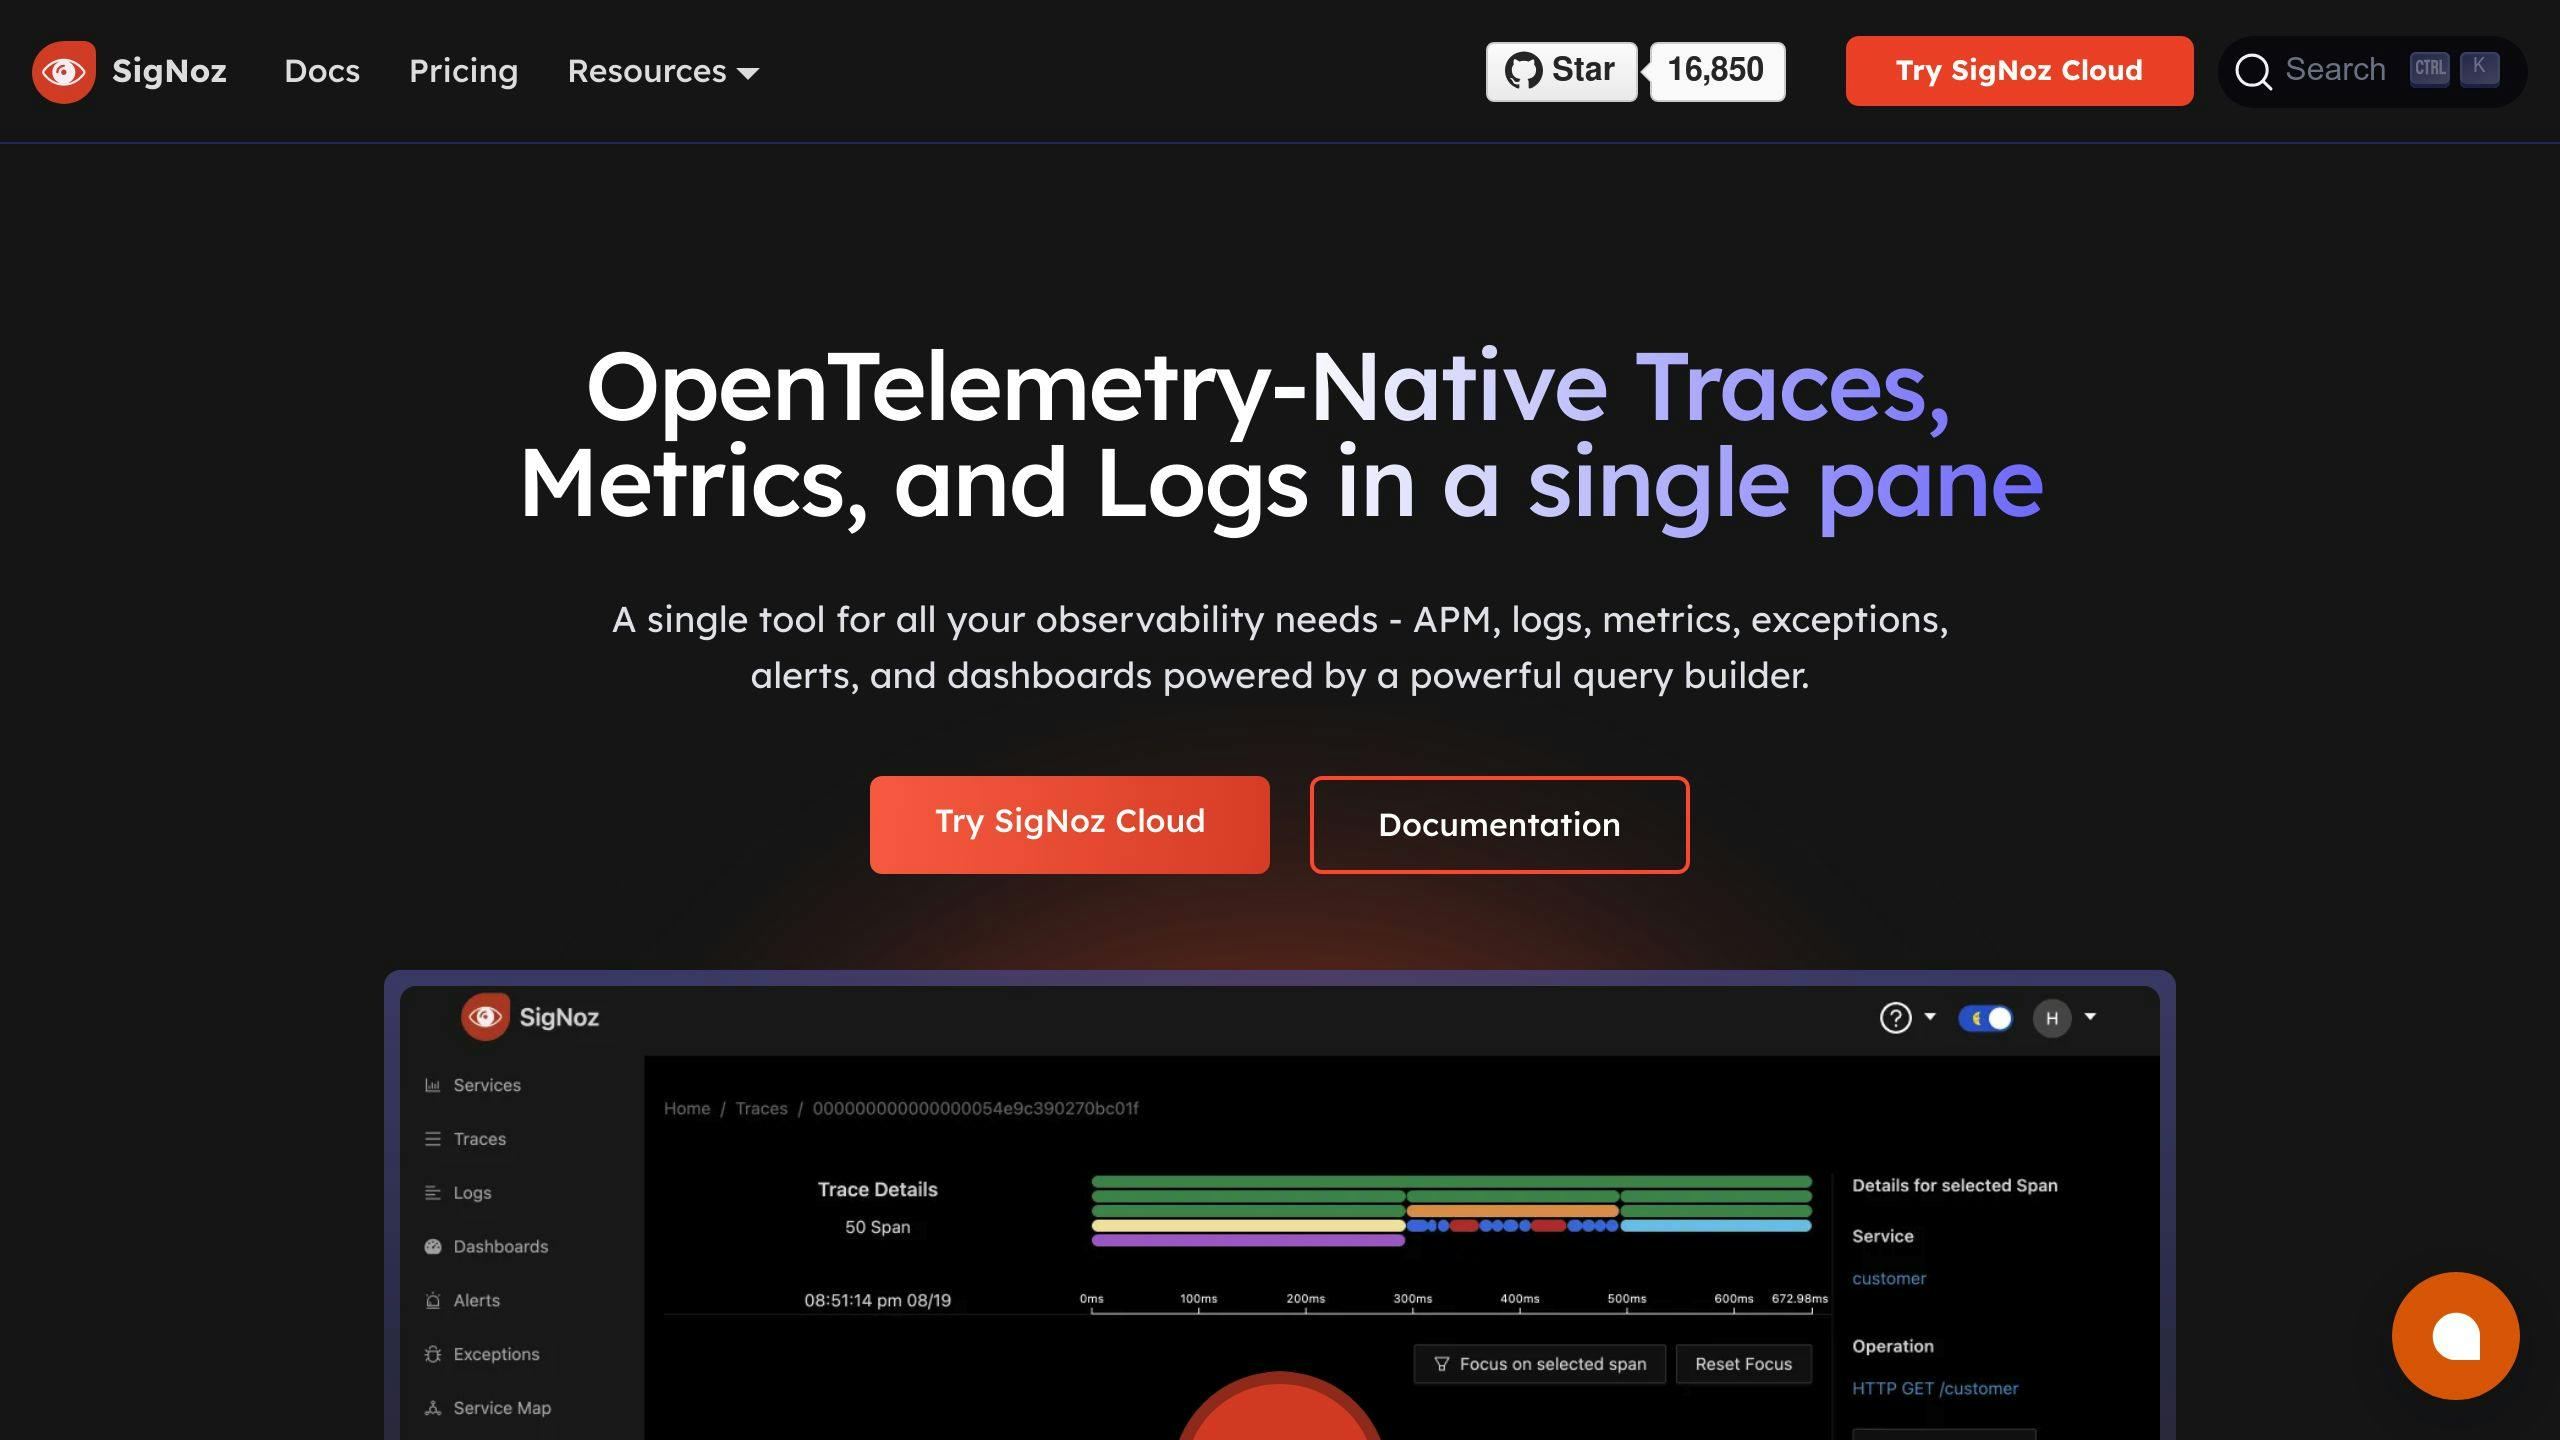
SigNoz is an open-source observability platform offering APM, logs, traces, metrics, and alerts in one interface. It's a cost-effective Datadog alternative with more data control.
Key features:
- OpenTelemetry support
- Flexible deployment
- Advanced querying
- Scalable architecture
SigNoz uses ClickHouse for fast data storage and retrieval. Pricing is based on data volume:
| Pricing Model | Cost |
|---|---|
| Metrics | $0.1 per million samples |
| Users/Hosts | Unlimited |
SigNoz offers a free self-hosted plan and a 30-day cloud trial. Its open-source nature allows for customization and integration with diverse tech stacks.
4. New Relic
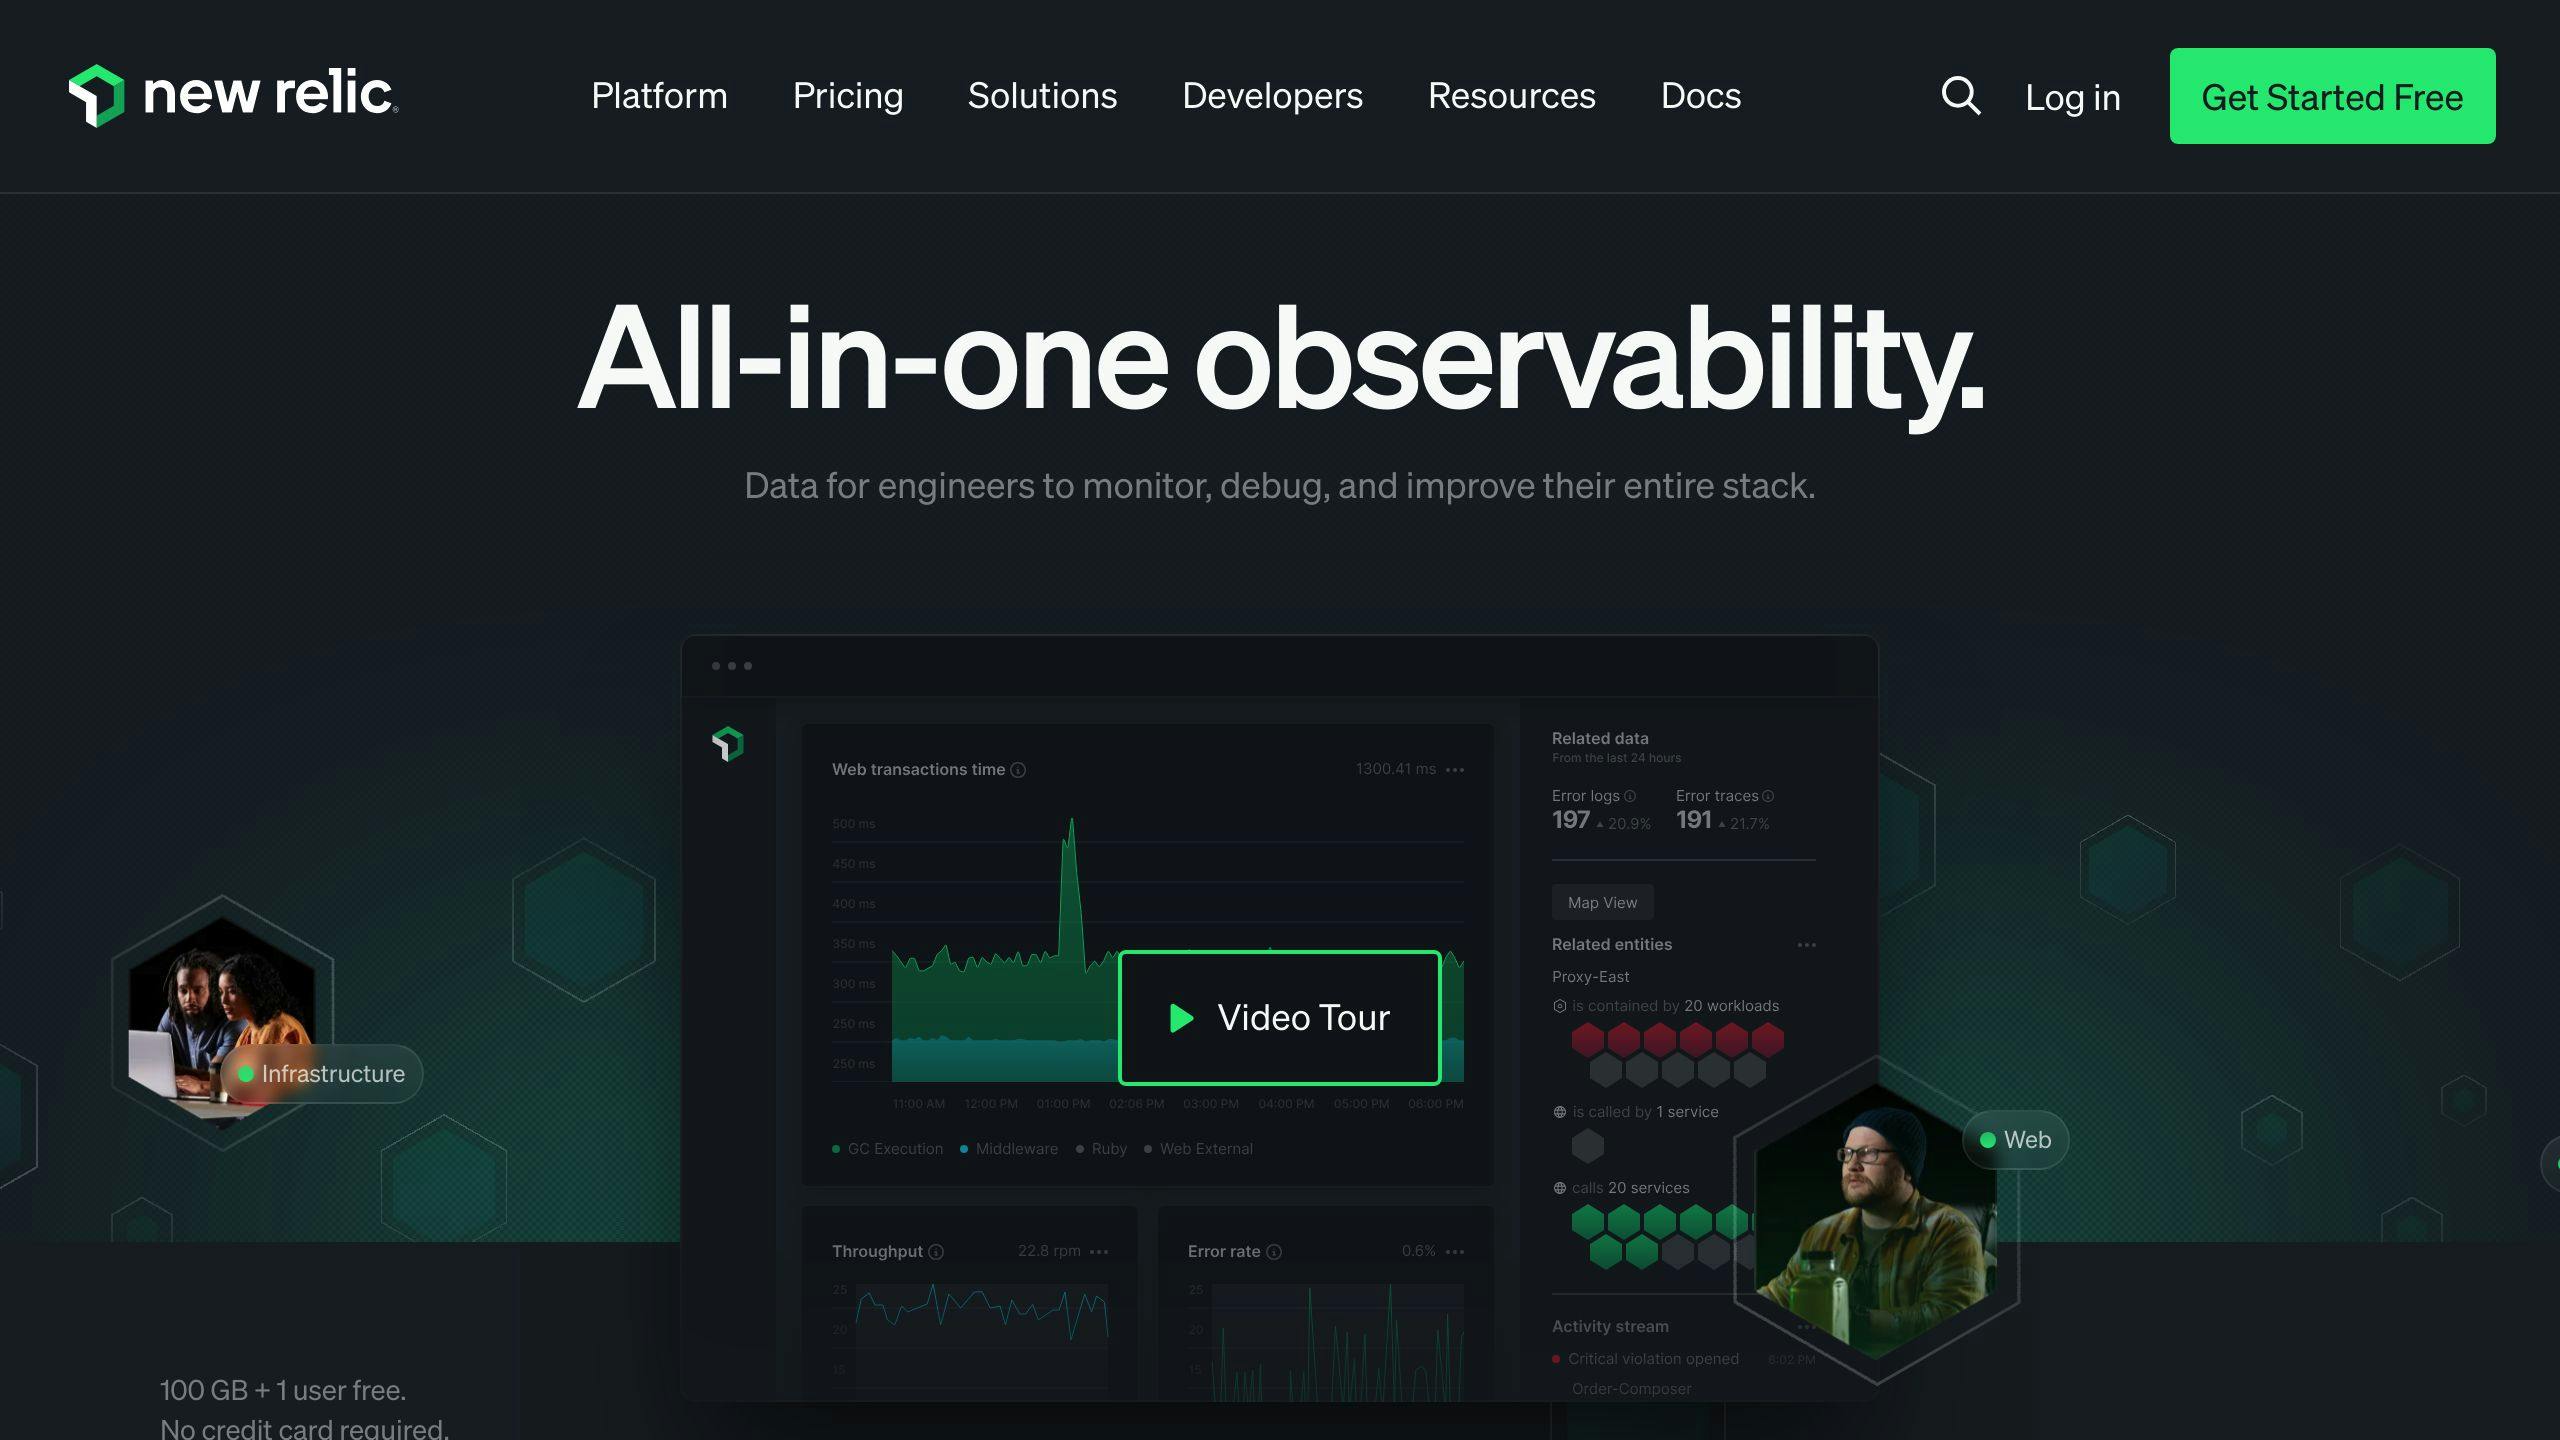
New Relic is a cloud-based observability platform offering tools for monitoring application performance across the entire tech stack.
Key features:
- Application Performance Monitoring (APM)
- Infrastructure monitoring
- Log management
- Real User Monitoring (RUM)
- AI-powered alerts
New Relic's pricing is based on data ingestion and user seats:
| Plan | Data Ingestion | Full Platform Users | Core Users |
|---|---|---|---|
| Free Tier | 100 GB/month | 1 user | Unlimited |
| Standard | $0.30/GB | $99/month/user | $49/month/user |
| Pro | $0.30/GB | Custom | Custom |
New Relic's APM capabilities are strong, with auto-instrumentation for 8 programming languages. However, some users report its log management is less robust than specialized tools.
sbb-itb-9890dba
5. Dynatrace

Dynatrace offers comprehensive monitoring for applications, infrastructure, and user experience. It stands out with AI-driven insights and automated root cause analysis.
Key features:
- Real User Monitoring
- Synthetic Monitoring
- Infrastructure Monitoring
- Application Performance Monitoring (APM)
- AI-powered anomaly detection
Dynatrace's AI engine, Davis, automatically detects issues and provides root-cause analysis. Pricing is based on monitored hosts and applications. While potentially more expensive than alternatives, many find the ROI worthwhile.
Dynatrace integrates well with various systems, allowing for a holistic view of IT environments. However, some users find its UI less intuitive than competitors.
6. Splunk
Splunk focuses on analyzing machine-generated data, offering features for monitoring infrastructure, applications, and user experiences in real-time.
Key features:
- Application Performance Monitoring (APM)
- Infrastructure Monitoring
- Real User Monitoring
- AI-driven incident prediction
- Machine learning for analytics
Splunk's IT Service Intelligence (ITSI) module uses AI to predict and resolve incidents. Pricing is based on data volume and computing capacity, often considered expensive for smaller organizations.
Splunk performs well at scale, making it suitable for large enterprises with complex IT environments. However, it lacks native logging support and has limited code profiling compared to some competitors.
7. AWS CloudWatch
CloudWatch is Amazon's built-in monitoring service for AWS resources and applications. It collects and analyzes metrics, logs, and events.
Key features:
- Metric collection and visualization
- Log aggregation and analysis
- Event monitoring
- Alerts and notifications
- Customizable dashboards
CloudWatch integrates seamlessly with AWS services. Its pay-as-you-go pricing can be both an advantage and potential drawback, as costs can increase rapidly if not managed carefully.
While powerful within the AWS ecosystem, CloudWatch has limitations for multi-cloud or hybrid environments compared to specialized tools like Datadog.
8. Azure Monitor

Azure Monitor is Microsoft's monitoring solution for Azure resources, applications, and infrastructure. It collects, analyzes, and acts on telemetry data from cloud and on-premises environments.
Key features:
- Metrics collection and visualization
- Log data analysis
- Alerting and notifications
- Application performance monitoring
- Infrastructure monitoring
Azure Monitor integrates well with Azure services but may have limitations for multi-cloud environments. Its consumption-based pricing model means users only pay for what they use, but costs can add up quickly for data ingestion and retention.
Azure Monitor offers several tools like Application Insights and Log Analytics to help users understand and optimize their environment. It's continuously evolving, with recent updates including support for OpenTelemetry and extended data archiving.
Wrap-up
The observability market offers numerous alternatives to Datadog, each with unique strengths. Consider your specific needs, infrastructure, and budget when choosing. Start with a small-scale implementation and expand based on your experiences. As the market grows, staying informed about new developments will be key to managing complex IT environments effectively.