Prometheus is a powerful tool for monitoring your computer systems, especially in cloud environments. It's designed to collect and process data, helping you keep an eye on the health of your systems. Here's what you need to know in simple terms:
- What is Prometheus? A tool for monitoring and alerting, used widely for cloud systems.
- Key Features: Collects data over time, uses PromQL for queries, and organizes data with labels.
- How It Works: Regularly checks your systems and collects data, which you can then query or use to set up alerts.
- Getting Started: Download Prometheus, configure it, and start collecting metrics.
- Core Parts: Includes the Prometheus server, Pushgateway, Exporters, Alertmanager, and integration with Grafana for visualization.
- Advanced Features: Alerting, advanced queries, and monitoring Kubernetes systems.
- Best Practices: Includes configuration tips, effective monitoring strategies, and advice on scaling.
- Comparisons and Ecosystem: How Prometheus stacks up against other tools and how it integrates with systems like Grafana and Kubernetes.
Whether you're new to monitoring systems or looking to switch to Prometheus, this guide will walk you through the basics and beyond, helping you get the most out of your monitoring setup.
What is Prometheus?
Prometheus started at SoundCloud in 2012 to help monitor their systems. It's now used by many people and is part of the Cloud Native Computing Foundation since 2016.
Here are some key things about Prometheus:
- It's really good for keeping track of systems that change a lot, like those using Kubernetes.
- It collects data by checking in on your applications regularly over the internet.
- You can use a special language called PromQL to look at your data in different ways.
- Data is organized with names and labels, making it easy to sort through.
- Each Prometheus server works on its own without needing a big, central database.
Prometheus is great for collecting data, but people often use it with other tools for making graphs (like Grafana) or sending out alerts (like Alertmanager).
Core Concepts and Terminology
Metrics are just numbers that Prometheus keeps track of, like how many times something happens or how much of something is being used.
Labels are tags you put on your metrics to help keep them organized. For example, you might have a label for the status of a request or which server it came from.
So, a metric is what you're measuring, and labels help you keep track of different parts of that measurement.
Prometheus Architecture
Here are the main parts of Prometheus:
- Prometheus server - This is where all your data gets collected and stored.
- Pushgateway - This lets temporary jobs send their data to Prometheus.
- Exporters - These tools help Prometheus understand data from other systems.
- Alertmanager - This takes care of your alerts, making sure you only get notified when you need to be.
- Grafana - A tool for making graphs and charts out of your data.
The Prometheus server is the heart of the system. It regularly checks in on your applications to collect data. You'll need to tell it where to look for this data. For making sense of all this data and creating nice visuals, Grafana is a popular choice.
Getting Started with Prometheus
This part of the guide will show you how to get Prometheus up and running, and how to start keeping track of your system's health.
Installation and Setup
Here's how to get Prometheus installed:
- Go to the Prometheus downloads page and get the latest version for your computer.
- Open the downloaded file and move it to where you want it on your computer. For example:
tar xvfz prometheus-*.tar.gz
cd prometheus-*
- To tell Prometheus how to run, you'll need to make or change a file called
prometheus.yml. There's a guide on how to do this on the configuration documentation page. - To start Prometheus, type this into your computer:
./prometheus --config.file=prometheus.yml
Now, Prometheus should be working and you can visit it by going to port 9090 on your computer.
Basic Configuration
To set up what you want to keep an eye on:
- Decide how often you want to check your metrics. Like every 15 seconds:
scrape_interval: 15s
- List the programs or services you want to monitor by telling Prometheus where to find them. Like this:
scrape_configs:
  - job_name: app1
    static_configs:
      - targets: ['localhost:8080']
You can find more about setting this up in the configuration docs.
First Metrics Collection
To start collecting data:
- Make sure the services you're monitoring can share their data in a way Prometheus understands, like the Prometheus format or StatsD.
- Use
prometheus.ymlto list which programs you're keeping tabs on. - Restart Prometheus to apply your changes.
- Visit the Prometheus page on your computer at localhost:9090.
- Try out some queries with PromQL to see your data. You could start with:
http_requests_total
And there you have it, you're now gathering data with Prometheus. It's a good idea to follow best practices for how you name and set up your metrics.
Prometheus Metrics and Labels
Understanding Metrics
Metrics are like the vital signs for your computer systems, telling you how healthy they are. In Prometheus, metrics are numbers that change over time, showing you things like how fast your app responds to requests, how many errors it's making, or how much of your computer's brain (CPU) it's using. Prometheus keeps track of these numbers with timestamps, so you can see how things change and when.
Picking the right metrics to watch is crucial. It helps you understand what's happening with your systems and decide if everything's running smoothly or if there's trouble brewing.
Utilizing Labels
Think of labels as sticky notes you put on your metrics to make them easier to understand and sort through. They're like extra details that help you know more about each number. For example, if you're counting how many times your website gets visited, labels can tell you which pages are most popular or what time of day is busiest.
Here are some tips for using labels wisely:
- Stick labels on metrics you think you'll want to look at later, like which part of your app or which city your users are in.
- Keep your label names consistent to make your life easier when you're searching through your data.
- Don't go overboard with labels. Too many can make things messy and slow down Prometheus.
- Instead of making lots of similar metrics, use labels to keep them grouped together neatly.
Labels help you slice and dice your data however you need, making it simpler to keep tabs on specific parts of your system.
Metric Types Explained
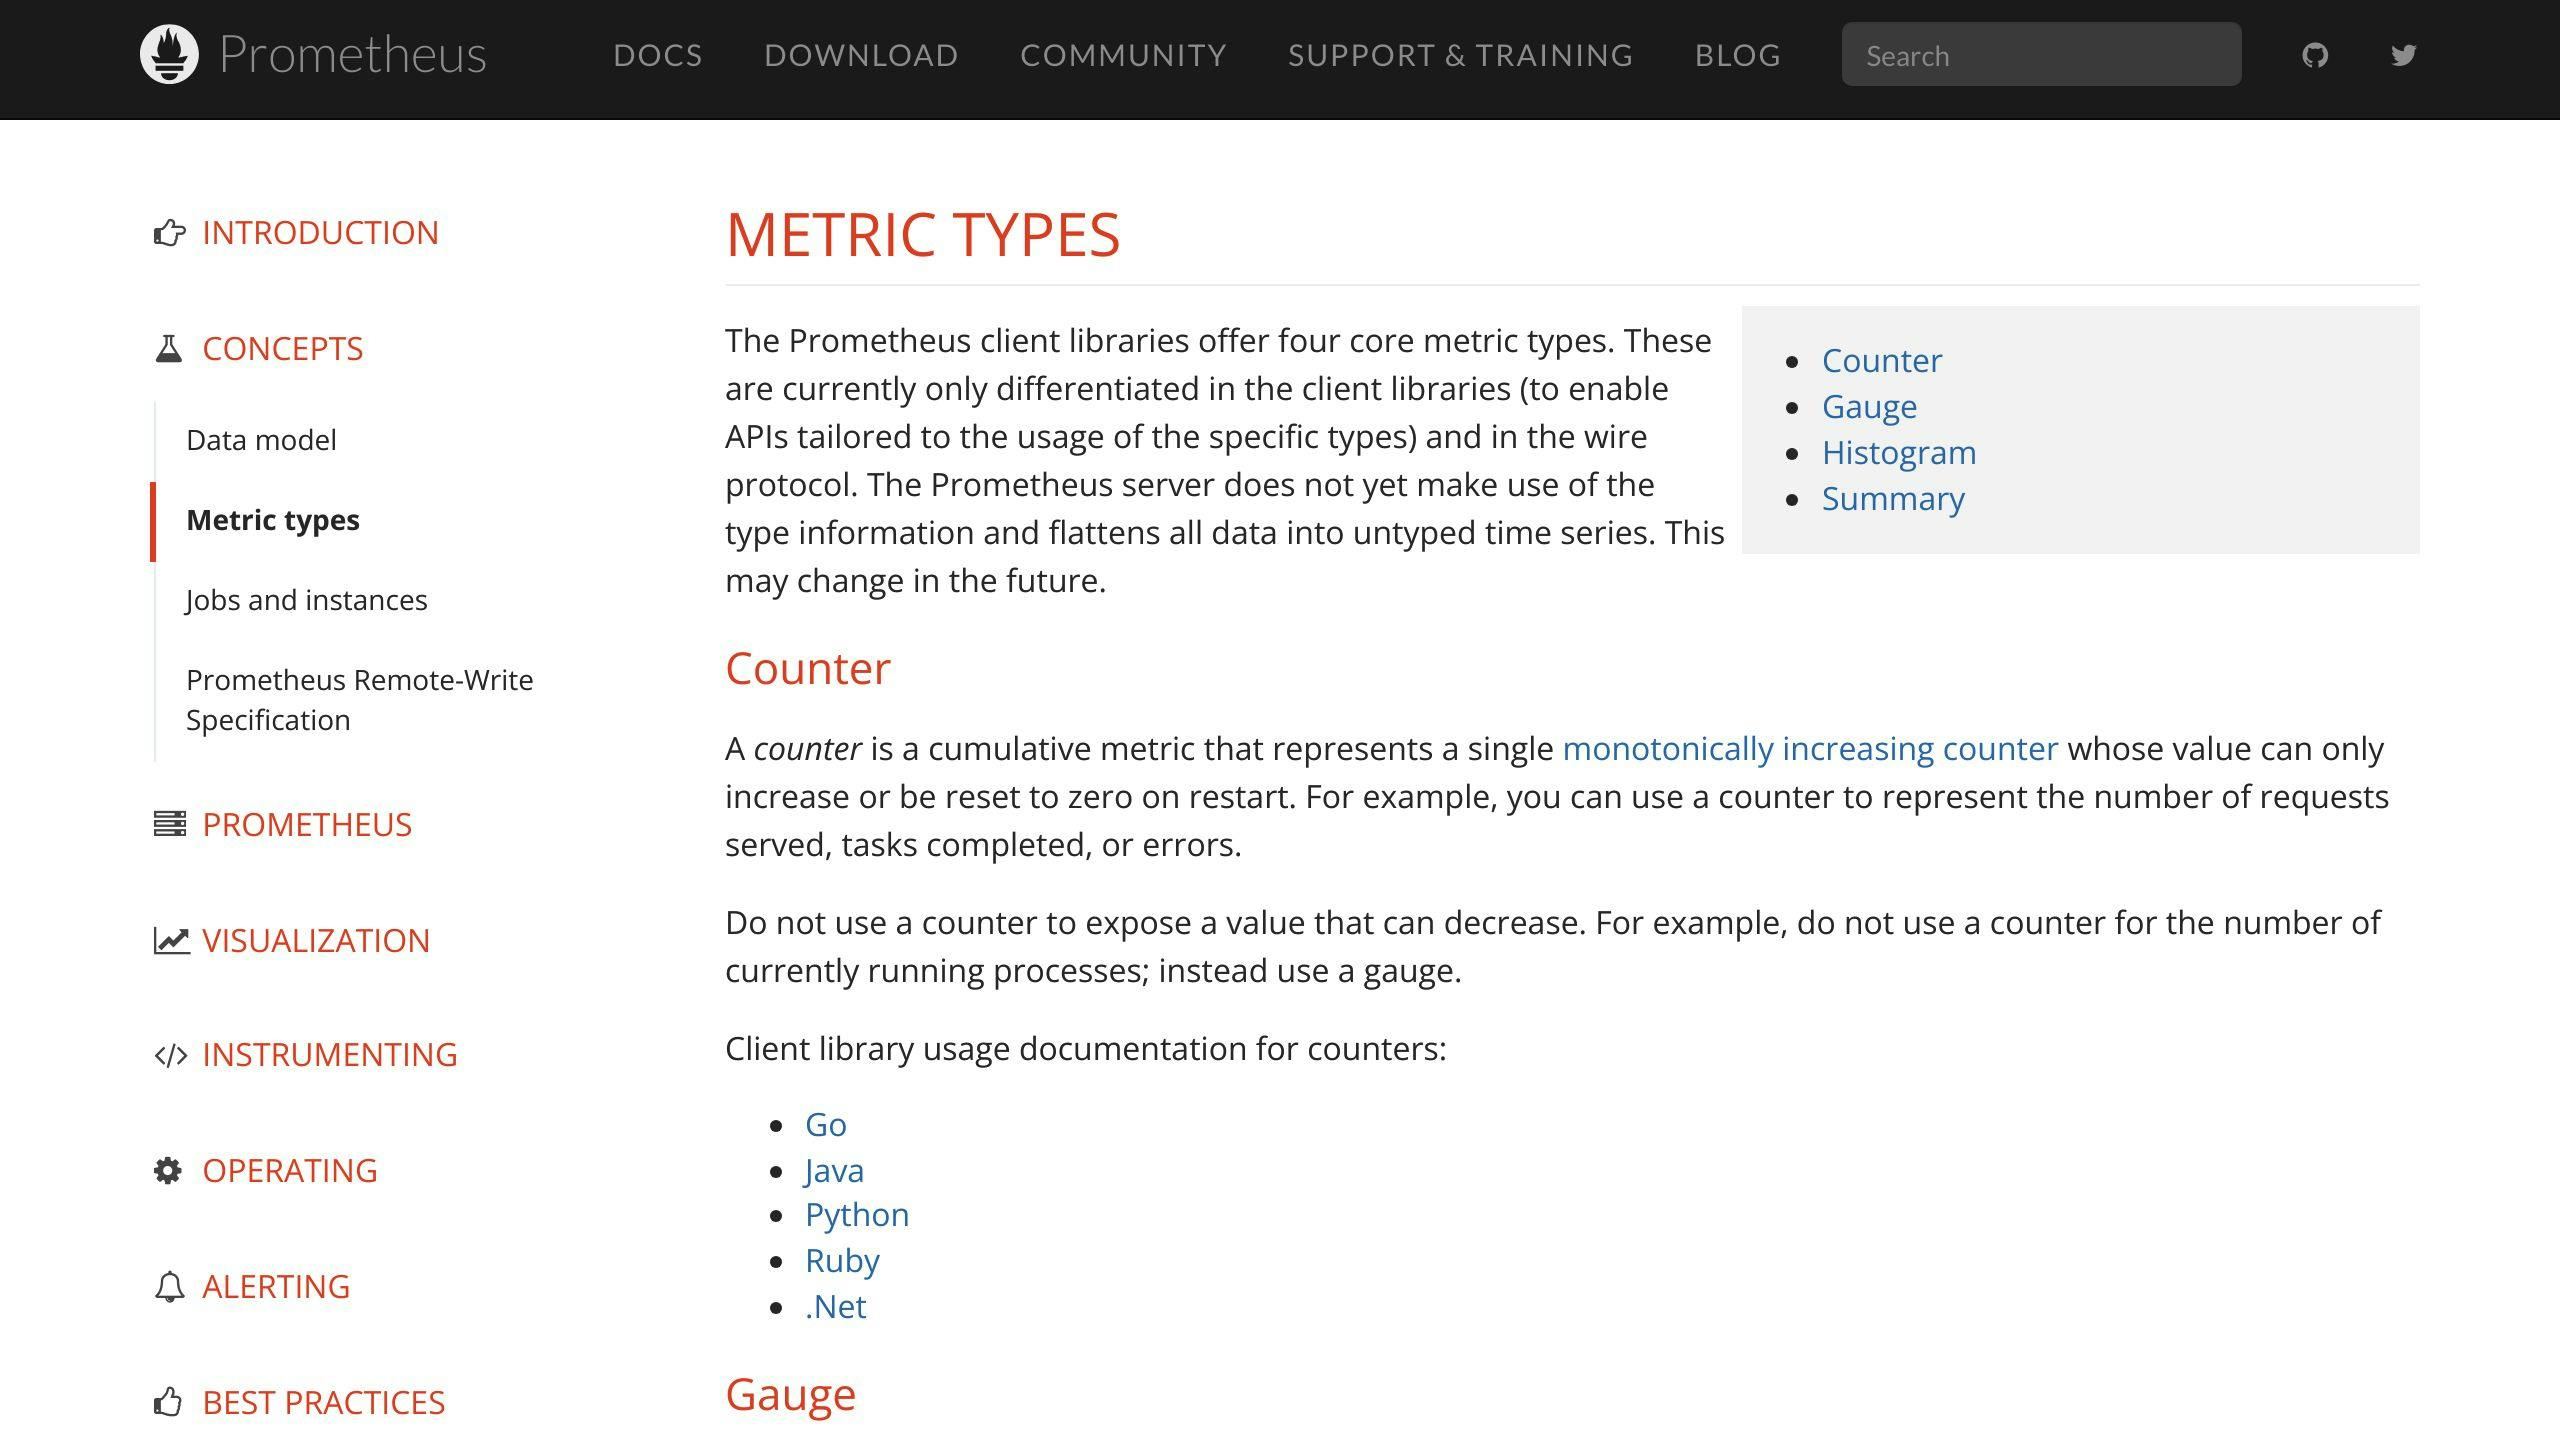
Prometheus uses a few different types of metrics to help you monitor your systems:
Counters
Counters are like those clickers people use to count crowds. They only go up, tracking how many times something happens. For example, counting how many people sign up for your newsletter.
Gauges
Gauges are like thermometers for your system, measuring how much of something you have at the moment, which can go up or down. For example, how many tasks are waiting to be done.
Histograms
Histograms help you understand the spread of things, like how long it takes your website to load for different users. They sort these times into buckets, so you can see if most requests are fast or slow.
Summaries
Summaries are a bit like histograms but focus more on specific points, like the median load time. They're great for getting a quick snapshot of how your system is doing.
Getting to know these metric types helps you set up your monitoring in a way that makes sense for your system.
Advanced Features
In this part, we'll dive into some of the more advanced things Prometheus can do, like sending alerts, making your data look nice, and keeping an eye on Kubernetes systems.
Alerting with Prometheus
Alertmanager is a part of Prometheus that deals with alerts. It makes sure you only get the important messages, without any repeats, and sends them where they need to go, like your email or a messaging app.
To set up alerts, you need to:
- Make rules in Prometheus that say when to send an alert.
- Get Alertmanager ready to handle these alerts and decide how to send them.
- Choose how you want to be notified, like through email or chat apps.
Alerting with Prometheus lets you:
- Use PromQL to write detailed rules for when to send alerts.
- Put alert logic right into your apps with special libraries.
- Quiet alerts when you're fixing things.
- Group related alerts together so you're not overwhelmed.
- Make sure the right team gets the alert by using labels.
Visualization and Tools
Prometheus has some basic tools for looking at your data, but Grafana is often used for a better view. Grafana lets you:
- Create your own dashboards with graphs and charts.
- Look up and explore data on the fly.
- Mark events on your graphs.
- Get alerts.
- Use different data sources easily.
There are also other tools like Console templates and API clients that help you:
- Console templates - Quickly set up views for specific tasks.
- API clients - Use code to talk to Prometheus through its web service.
These tools help you get a full picture of what's happening with your Prometheus data.
Monitoring Kubernetes with Prometheus
Prometheus works really well with Kubernetes, which is a system for running lots of apps in the cloud.
When you use Prometheus with Kubernetes, you can:
- Automatically find and keep track of services.
- Get special metrics from your apps.
- Scale up to monitor big setups.
- Store data for a long time with extra storage options.
- Control who can see or do things based on their role.
To start, you can use a tool called prometheus-operator to set up Prometheus in Kubernetes. This tool makes it easy to:
- Automatically set up and manage Prometheus.
- Use Kubernetes' own language to control Prometheus.
- Work smoothly with Kubernetes parts like nodes and pods.
Using Prometheus with Grafana and special alert rules for Kubernetes gives you a strong toolset for keeping an eye on your Kubernetes clusters.
Prometheus Best Practices
Here are some simple tips to help you set up, keep an eye on, and grow your Prometheus system.
Configuration Best Practices
- Pick the right check times: Check your targets often enough to get useful info, but not so much that you stress them or Prometheus. A good starting point is every 15-60 seconds.
- Keep checks quick: Make sure the time Prometheus waits to collect data (scrape timeout) is just long enough. Usually, 10 seconds is enough.
- Use less data: Turn on data compression to cut down on how much data you send around.
- Use more than one Prometheus server: If you have a lot of data, split it across several Prometheus servers. You can combine the data when you need to look at it all together.
- Be smart with data storage: Only keep data as long as you need it. You can use rules to save only the important bits, which helps save space.
- Keep things secure: Protect your data by making sure Prometheus and the things it checks can trust each other. Also, set up rules on who can see or do what.
Effective Monitoring Strategies
- Start monitoring early: Add monitoring to your apps when you're building them. This makes it easier to keep track of things right away.
- Watch more than just your tech: Turn tech info into business insights. Keep an eye on both the tech stuff and how it affects your business.
- Use Grafana for better views: Make custom Grafana dashboards for different teams, so they see the info that matters to them.
- Set up smart alerts: Make rules for when Prometheus should send out warnings, based on what's important to you. Make sure the right people get these alerts.
- Label wisely: Use labels to make your data easy to sort through later, but don't go overboard. Basic labels like
instanceandjobare very helpful.
Scaling Prometheus
- Divide and conquer: Break your data into chunks managed by different Prometheus servers. You can still pull it all together when needed.
- Grow sideways: Instead of making one server bigger, add more servers. This is usually a better way to handle more data.
- Save data offsite: Move old data to a different place to save space. You can still look at it when you need to.
- Keep an eye on Prometheus: Use tools to monitor how well Prometheus is working, just like you do with other systems.
Following these simple steps from the beginning can help you build a monitoring system with Prometheus that's easy to manage and can grow with your needs.
sbb-itb-9890dba
Prometheus Alternatives and Ecosystem
Prometheus is a well-liked tool for keeping an eye on your computer systems and letting you know when things go sideways. But it's not the only kid on the block. Let's take a look at how it stacks up against other options and how it plays with other tools.
Prometheus Compared to Other Monitoring Tools
Here's what makes Prometheus stand out:
- Pull-based monitoring: Unlike other tools that wait around for data to come to them, Prometheus goes out and grabs the data itself. This is great for keeping tabs on systems that are always changing.
- Multi-dimensional data model: Prometheus lets you use labels to organize your data, making it easier to sift through.
- Powerful query language: With PromQL, you can ask complex questions about your data.
- No need for a big, central database: Prometheus works fine on its own, which makes it simpler to set up and scale.
But, Prometheus is more about checking on your machines and services, not so much about logs or tracking detailed transactions. It also doesn't automatically find new things to monitor.
How does Prometheus compare to others?
- Graphite: Great for storing data over time, but Prometheus can ask more complicated questions. Easier to get up and running than Graphite.
- InfluxDB: Similar to Prometheus, but doesn't come with built-in ways to make graphs or send alerts.
- Nagios: More focused on sending you alerts when things go wrong. Prometheus offers a more detailed way to look at your data.
- Datadog: A service you pay for that can find and monitor things automatically. It can handle logs, metrics, and traces all in one, but you have less control since it's not something you run yourself.
Integrating Prometheus with Other Systems
Prometheus can do a lot on its own, but it's often used with other tools to get a fuller picture:
- Visualization and dashboards: Grafana is a favorite for making detailed charts and dashboards from your Prometheus data.
- Logging: Promtail can send your logs to Loki, which works well with Grafana for keeping all your info in one place.
- Traces: Tempo collects detailed info about transactions and plays nicely with Grafana.
- Alert delivery: Alertmanager takes care of sending out warnings based on what Prometheus finds, to places like email or Slack.
- Auto-discovery: Using something like Consul can help Prometheus automatically find new things to monitor.
So, while Prometheus is pretty cool by itself, it really shines when used with other tools to keep a closer eye on your systems.
FAQs
Here are answers to some common questions people have when starting with Prometheus.
What are some good starting points for monitoring?
Here are a few key things you might want to keep an eye on:
node_cpu- How much CPU is being usednode_memory- How much memory is being usednode_disk- How much disk space you have lefthttp_requests_total- How many times your website or app has been visitedhttp_request_duration_seconds- How long it takes for your site or app to respond
These metrics help you understand if your systems are running smoothly.
How often should Prometheus check on these metrics?
Checking every 15 to 60 seconds is a good balance. Checking more often might slow things down, and checking less often might mean you miss important changes.
What's a smart way to name metrics and labels?
Use simple, clear names. For metrics, stick to snake_case, and for labels, go with camelCase. Start metric names with what part of the system they're about. Use labels to note where or what part of your app the data is coming from, like instance for the computer's name or job for the app's name. Be consistent with your labels.
How do I set up alerts that actually help?
Make alerts for big problems, like if your service stops working. Don't send too many alerts for small issues. Try out alerts in a test environment first. Make sure there's a clear guide on what each alert means and how to fix it.
When should I use more than one Prometheus server?
If you're tracking a lot of data or if your system is really busy, you might need to spread the load across several Prometheus servers. This helps keep things running smoothly.
How can I manage the amount of data Prometheus stores?
Summarize your data with rules so you're not keeping everything. Set rules on how long to keep data. Move older data to cheaper storage. Turn on data compression to save space.
Conclusion
Prometheus is a handy tool for keeping an eye on your cloud systems. By now, you should know:
- What Prometheus is and how it helps DevOps teams keep track of their systems
- The main parts of Prometheus and how they work together
- Steps to get Prometheus set up and start collecting important data about your systems
- Cool extra features like setting up alerts, making graphs, and working with Kubernetes
- Tips for making sure your Prometheus setup is tidy and can handle more data as you need it
Prometheus is even better when you use it with other tools:
- Visualization: Use Grafana for making graphs to dig deeper into your data
- Logging: Send your logs to Loki to keep them safe and easy to find
- Traces: Use Tempo to get a closer look at how well things are running
- Alerting: Make sure important messages get to you through email, Slack, or other ways with Alertmanager
The big idea is to mix together metrics, logs, and traces to get a full picture of how your system is doing, both right now and over time. Prometheus is a key part of that.
To get even better with Prometheus, you might want to check out:
- The official Prometheus docs for more details on how to set things up
- Example code for getting started with exporters and other tools
- Community help on Reddit and Stack Overflow
We hope this guide has helped you see how Prometheus can make it easier to keep an eye on your systems. Using metrics well is key to keeping your infrastructure running smoothly.
Related Questions
What is Prometheus used for?
Prometheus is a free tool that helps you keep track of how your cloud systems and apps are doing. It's really good for watching over systems that use Kubernetes, collecting data like how fast your app is running, and helping you see this info in graphs with a tool called Grafana. You can also set up alerts to let you know when something's not right. With its special query language, PromQL, you can dig into your data in real-time to make sure everything's running smoothly.
How reliable is Prometheus?
Prometheus is made to be very reliable for keeping an eye on your cloud systems. It has some cool features like:
- Checking on your systems regularly and not getting tripped up if something is offline
- You can have more than one Prometheus running the same job for backup
- It saves data on its own disk, so if it restarts, you don't lose info
- You can set it up in a way that even if one part fails, you have a backup
Lots of big companies trust Prometheus for their important systems. Just make sure you set it up correctly to get the most out of it.
Is Prometheus better than Zabbix?
Prometheus and Zabbix are both tools for keeping an eye on how systems are doing, but they're a bit different. Prometheus is really good for newer, cloud-based systems because it's great at handling changes and has a smart way to look at data with PromQL. It's also built to handle lots of data efficiently.
Zabbix might be better for older systems because it can do more than just watch over your systems, and it's good for keeping data for a long time. So, it really depends on what you need.
What is the difference between Grafana and Prometheus?
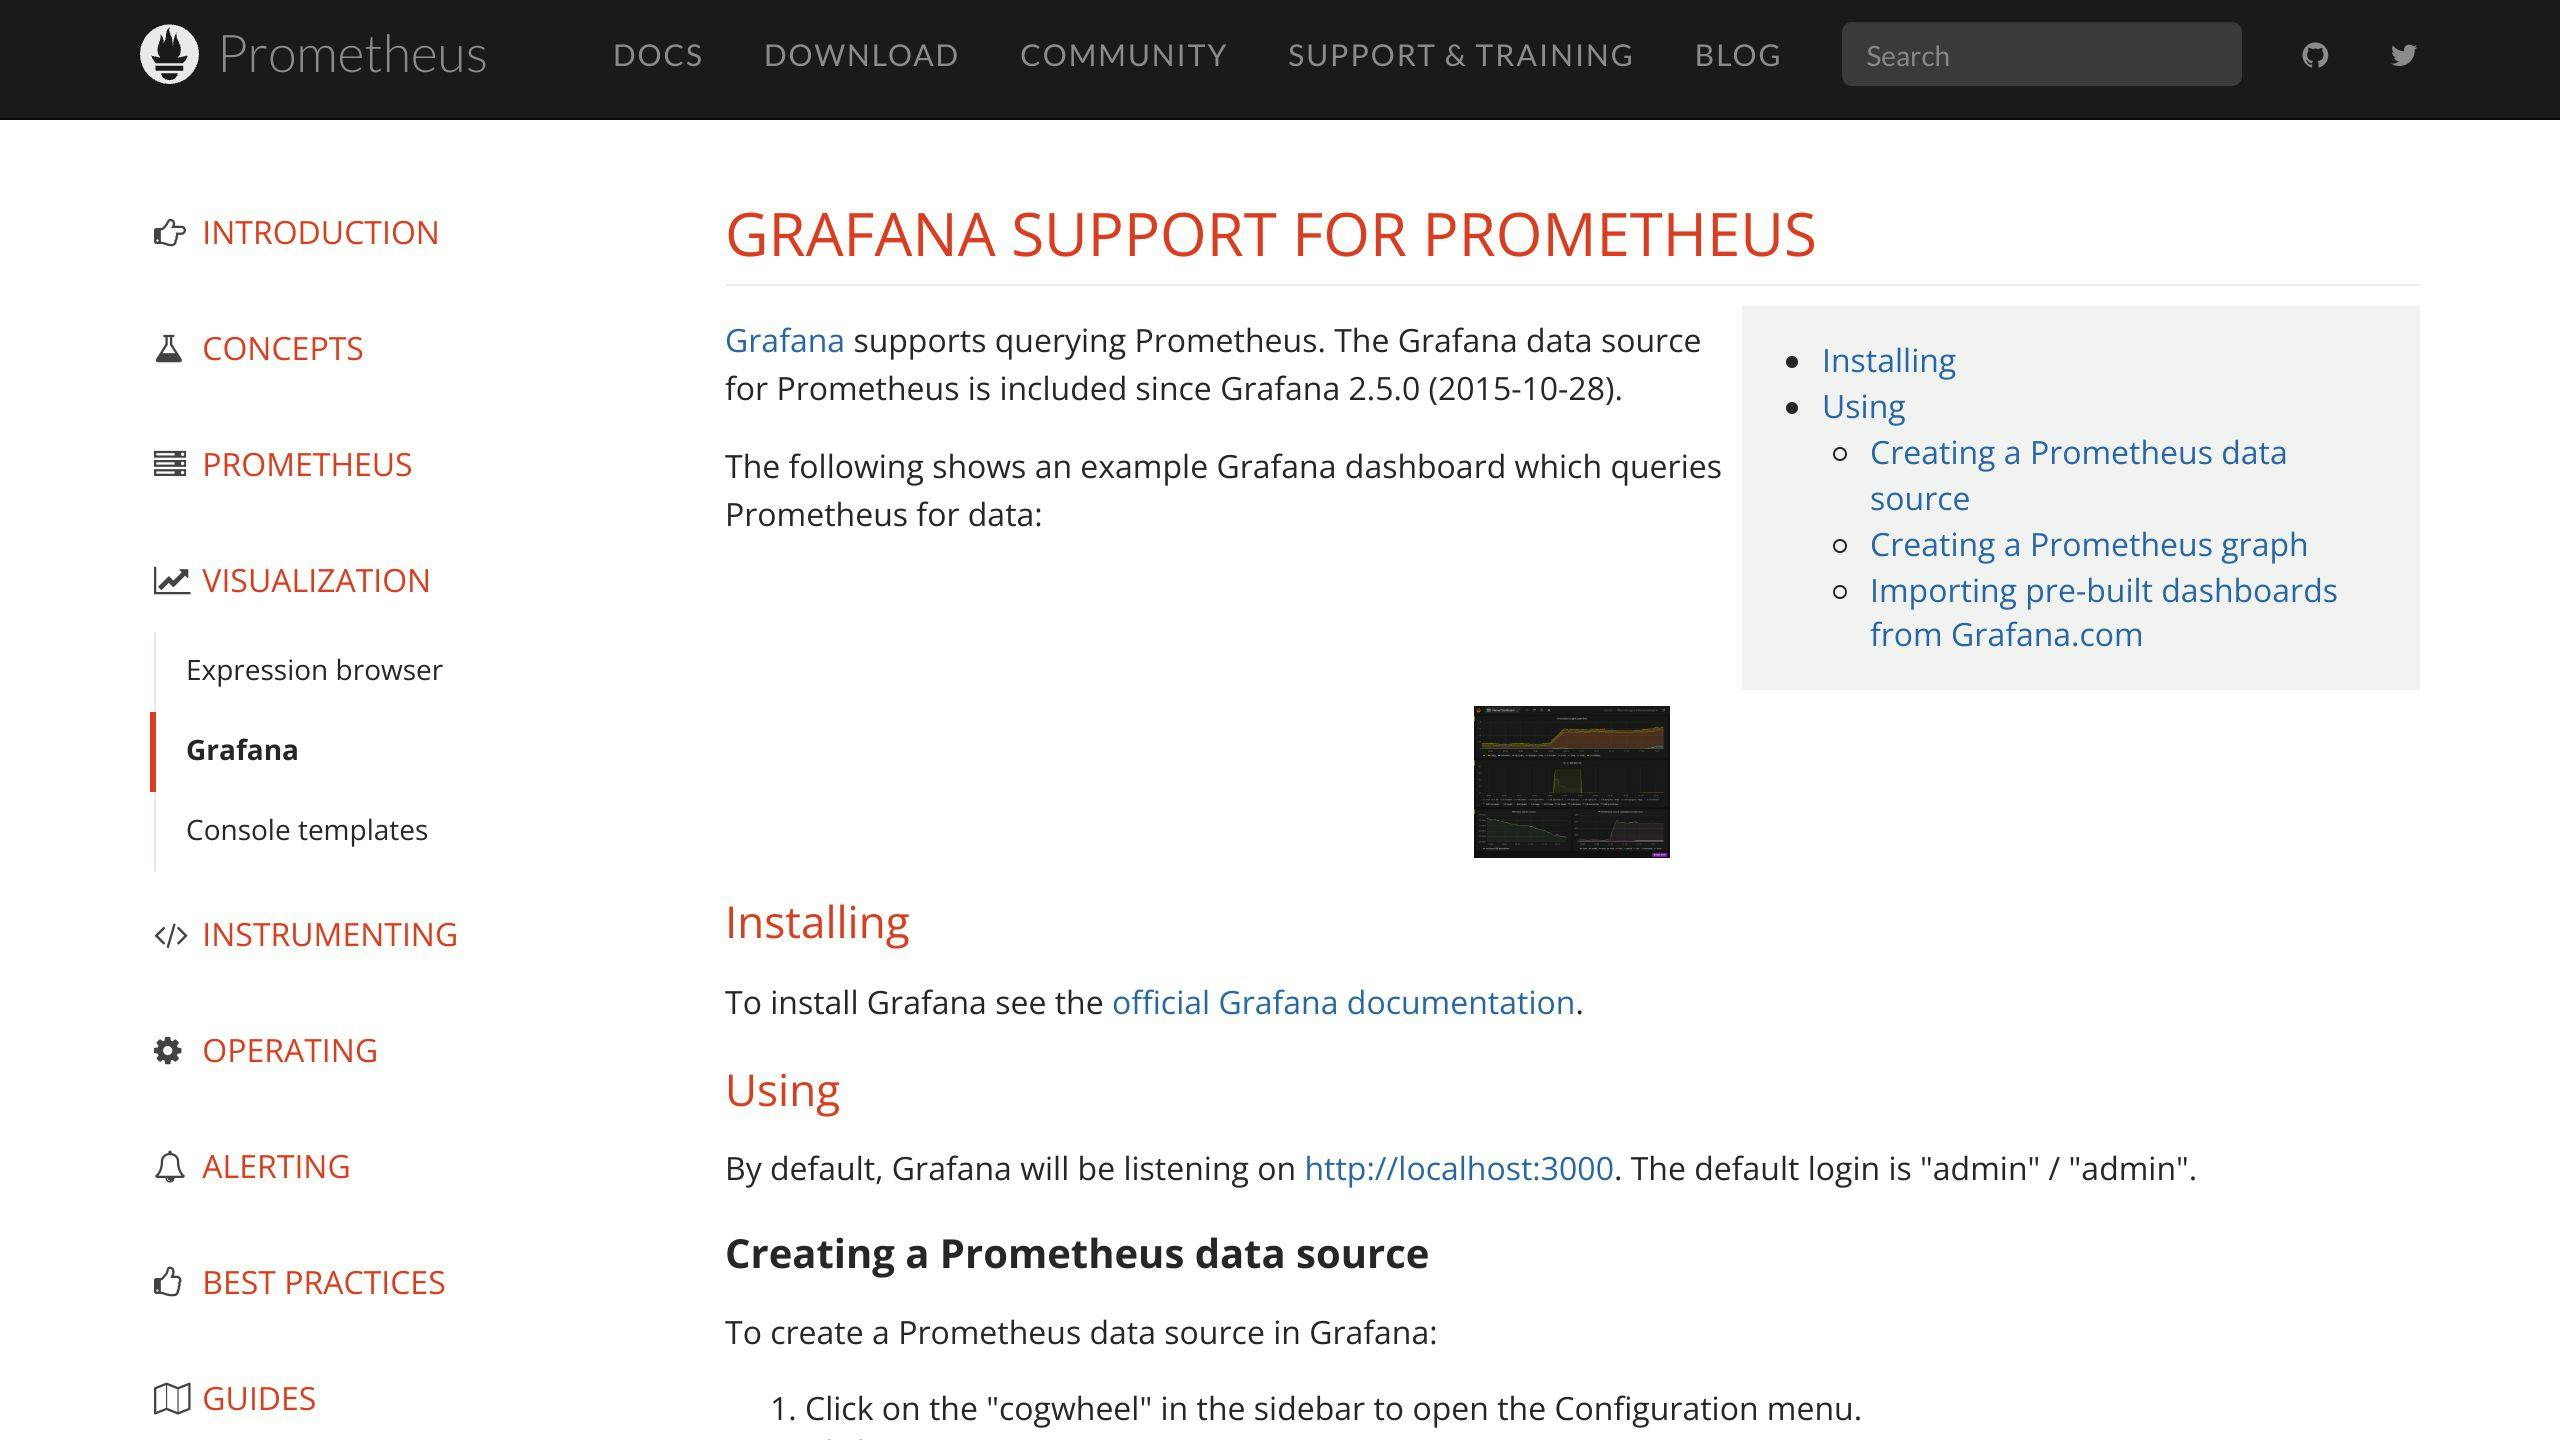
Prometheus is all about collecting and keeping track of data from your systems. Grafana, on the other hand, makes that data easy to understand through charts and graphs.
So, while Prometheus gathers and stores your data, Grafana helps you see and understand it better by making nice visuals. They work really well together to help you keep your cloud systems in check.