Looking for a Datadog alternative? Here's a quick rundown of top options:
- New Relic: Detailed app insights
- Dynatrace: Ideal for complex IT environments
- Prometheus: Perfect for cloud-native setups (free!)
- AppDynamics: Strong in business-centric monitoring
- Splunk: Comprehensive security and IT operations
- Grafana: Flexible, open-source visualization
- Elastic Stack (ELK): Powerful log management
- SolarWinds: Solid network monitoring
- Zabbix: Open-source with extensive customization
- Nagios: Well-established on-premise monitoring
- Better Stack: User-friendly for SMBs
- Coralogix: Cost-effective log analytics
- Instana: Automated APM for microservices
- Sumo Logic: Strong in security analytics
- LogicMonitor: Great for hybrid infrastructure
Quick Comparison:
| Tool | Key Strength | Pricing | Best For |
|---|---|---|---|
| New Relic | APM | Pay-per-use | Detailed app insights |
| Dynatrace | AI-powered observability | Starts at $69/month | Large enterprises |
| Prometheus | Open-source | Free | Cloud-native environments |
| LogicMonitor | Hybrid monitoring | Starts at $20/user/month | Complex hybrid setups |
The best tool depends on your specific needs, budget, and tech stack. Take advantage of free trials to find your perfect fit.
Related video from YouTube
1. New Relic
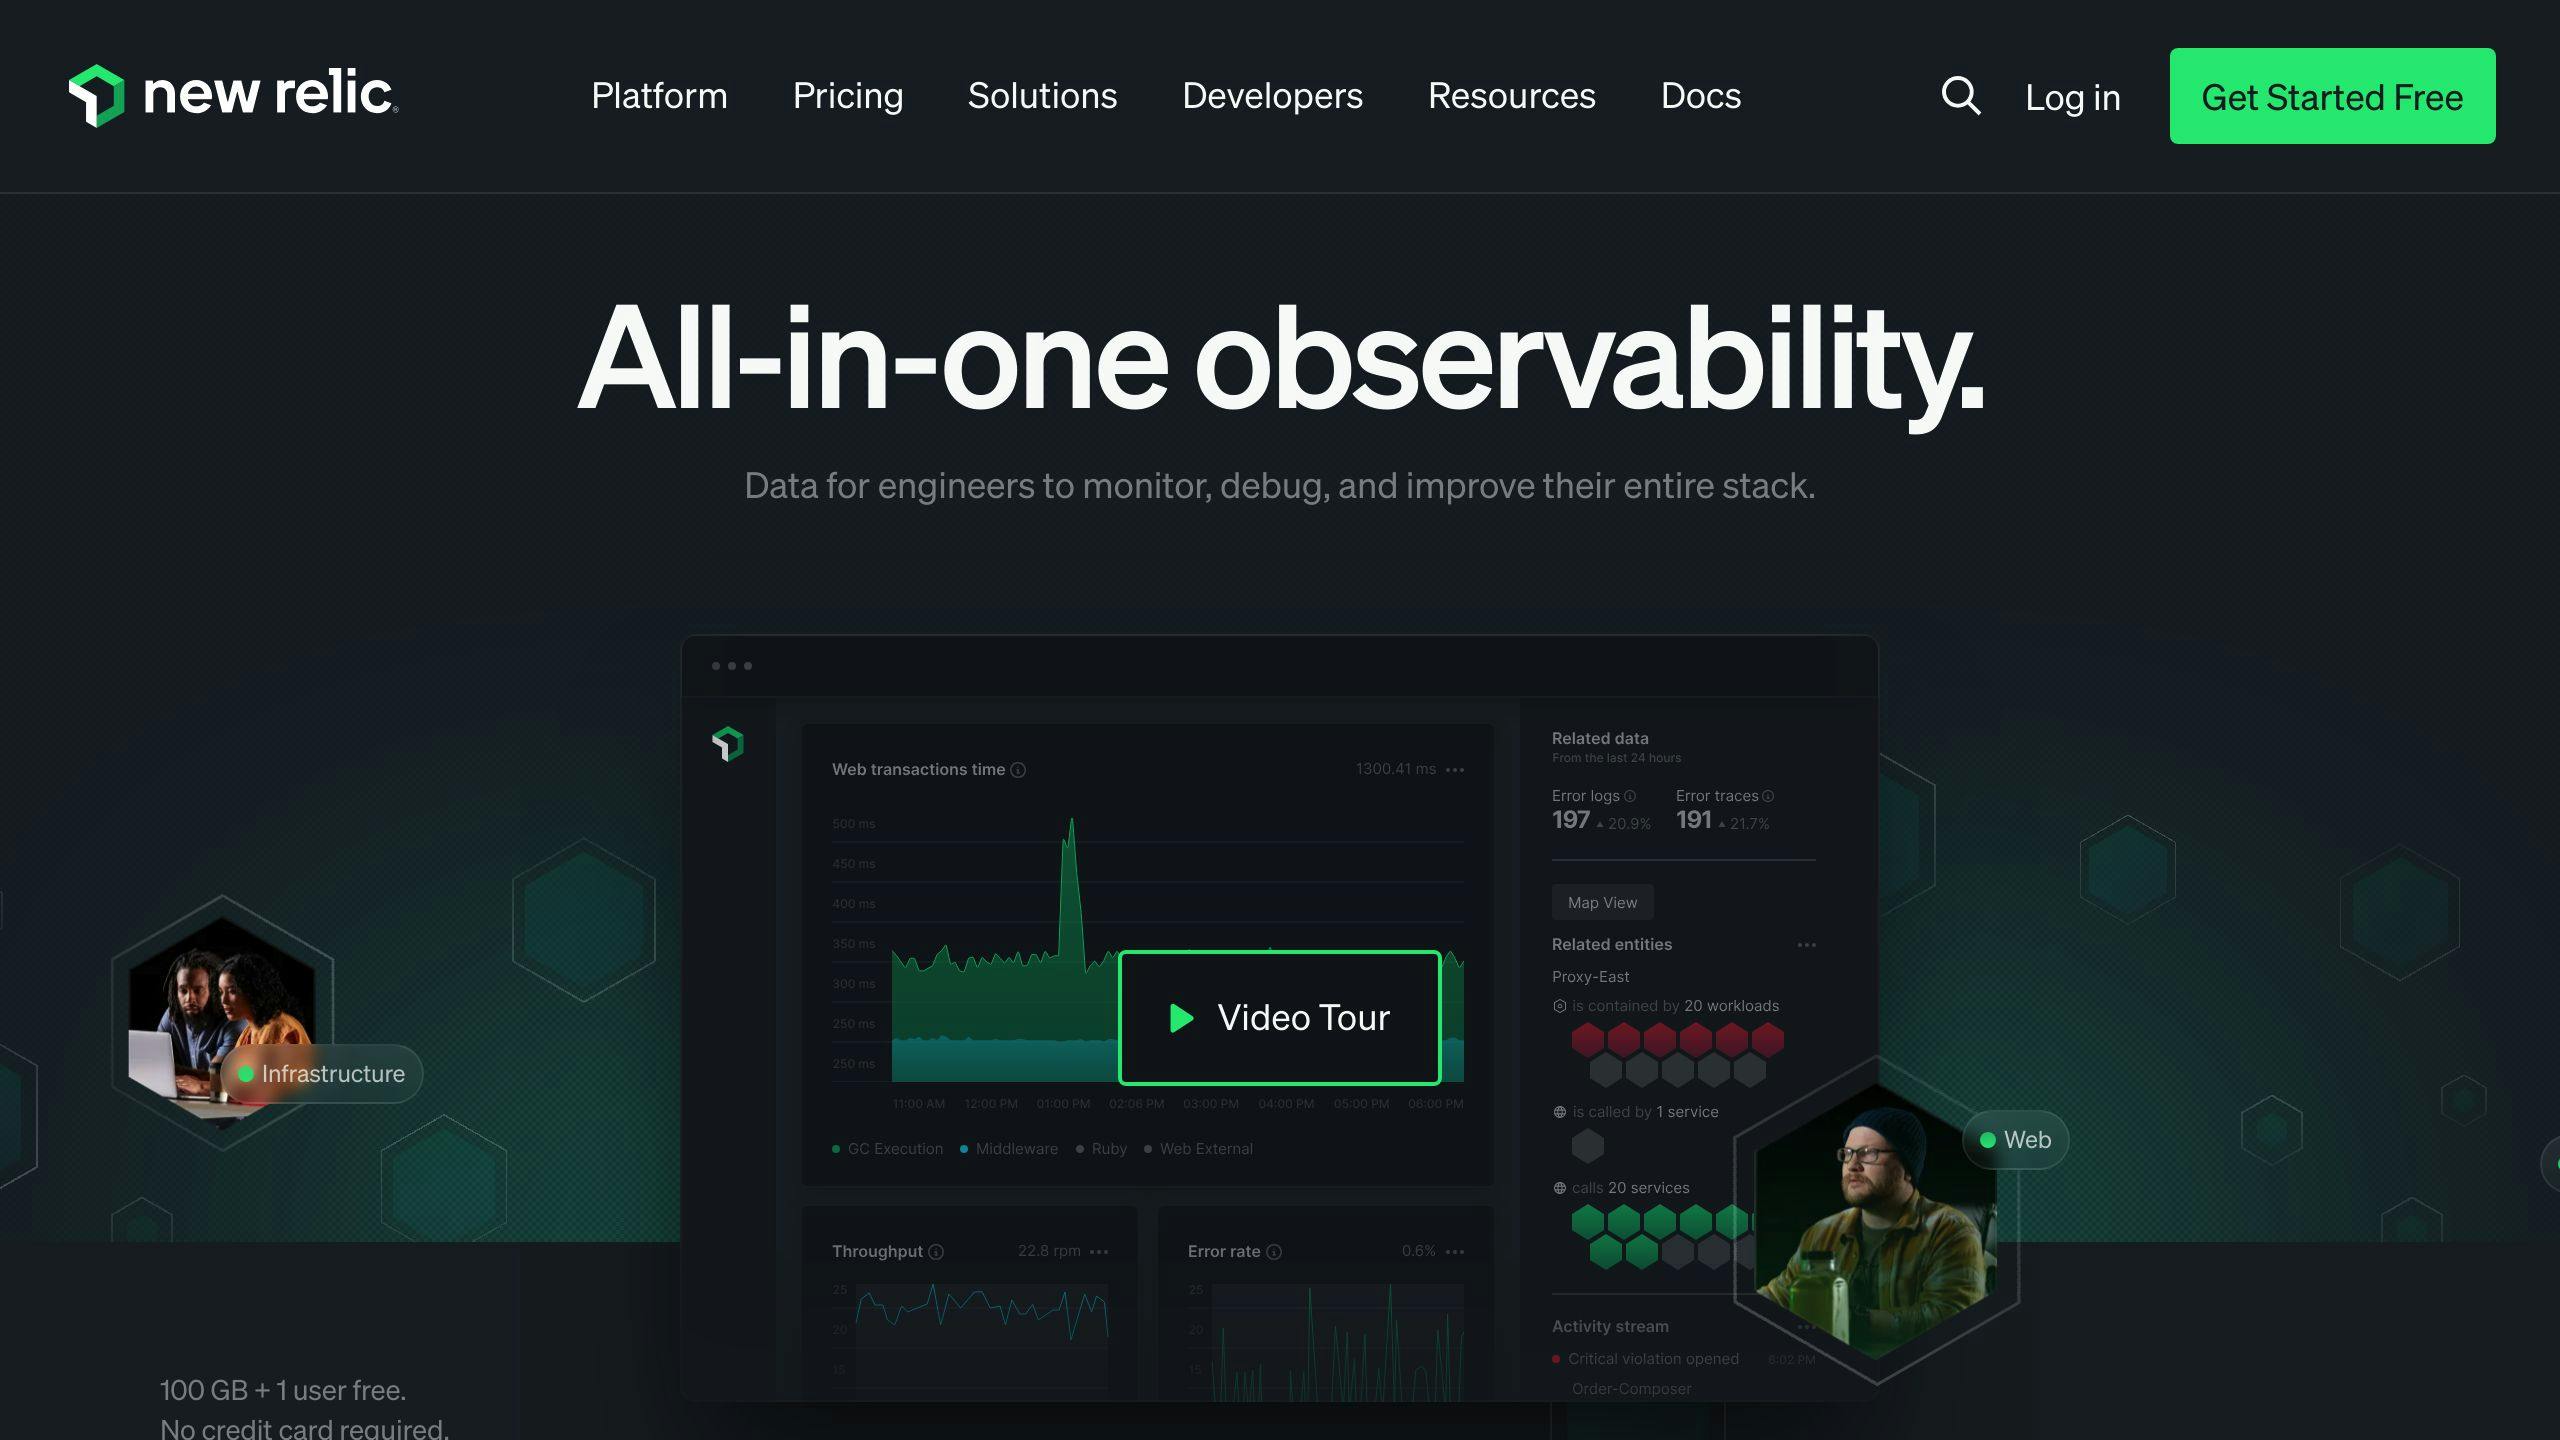
New Relic is a cloud-based observability platform offering full-stack monitoring for your tech infrastructure. It's a strong Datadog alternative, providing real-time insights into applications, systems, and user experiences.
Key Features:
- Application Performance Monitoring (APM)
- Infrastructure monitoring
- Real User Monitoring (RUM)
- Distributed tracing
- Log management
- AI-powered alerting
New Relic's standout feature is its AI-recommended alerts, using machine learning to spot unusual behavior and suggest new alerts.
Pricing: Usage-based model
| Plan | Data Ingestion | User Pricing |
|---|---|---|
| Free | 100 GB/month | 1 Full Platform User |
| Paid | $0.30/GB | $49/month for Core Users |
| ($0.35/GB EU) | $99/month for Full Platform Users |
Pros:
- 500+ integrations
- Unified pricing model
- Free tier available
Cons:
- Complex deployment process
- Buggy agent installations
- Account closure requires moderator assistance
Bottom Line: New Relic is robust with a wide range of features. Its AI-powered alerts and unified pricing model make it attractive for comprehensive observability. However, be prepared for a potentially tricky deployment process.
2. Dynatrace

Dynatrace offers end-to-end observability for AI-powered applications, helping businesses optimize customer experiences and link AI costs to business value.
Key Features:
- Infrastructure monitoring
- Application Performance Monitoring (APM)
- AI-powered root cause analysis
- Real User Monitoring (RUM)
- Automatic discovery and mapping
- Cloud-native and on-premise deployment options
Dynatrace's standout feature is its AI engine, Davis®, which automatically detects issues and provides precise root cause analysis.
Pricing: Consumption-based model, costs depend on monitored data volume.
Pros:
- AI-powered insights
- Comprehensive monitoring
- On-premise deployment option
- Automatic discovery and mapping
Cons:
- Complex user interface
- Higher cost
- Steep learning curve
- Some features require custom plans
Bottom Line: Dynatrace is robust and can handle complex, large-scale environments. While pricier with a steeper learning curve, its comprehensive capabilities and automatic root cause analysis make it strong for businesses needing in-depth insights.
sbb-itb-9890dba
3. Prometheus
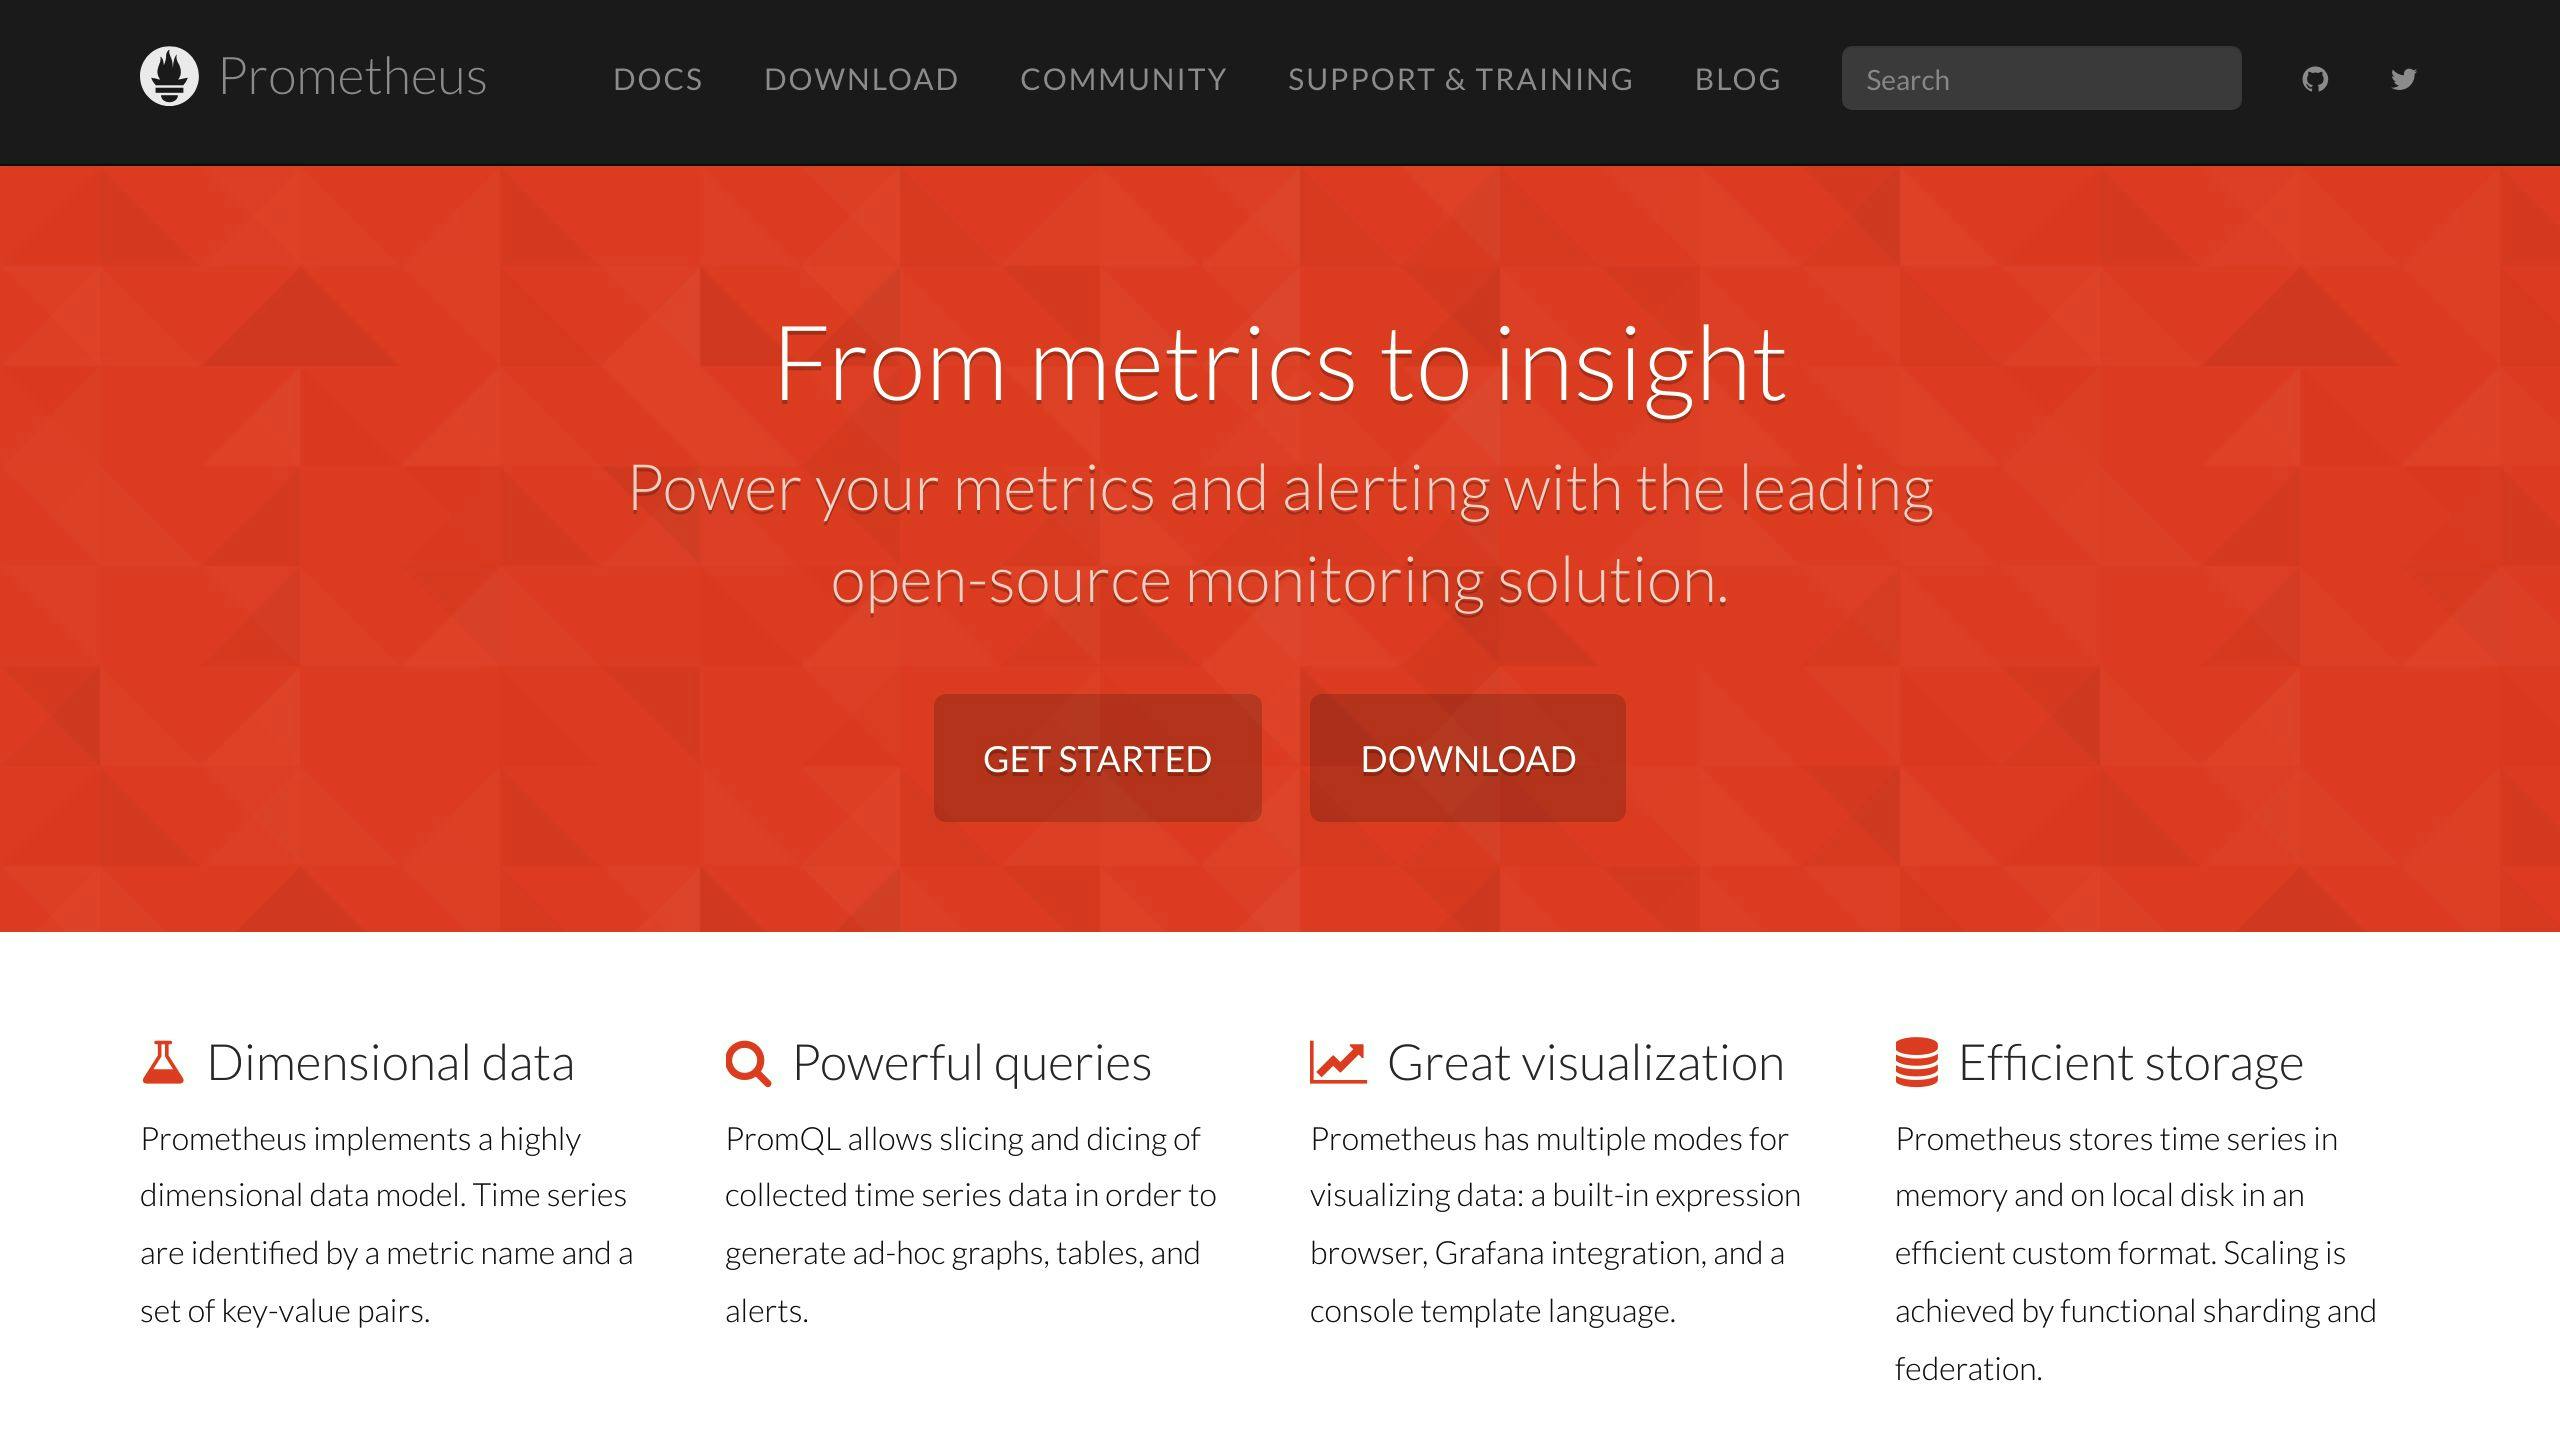
Prometheus is an open-source monitoring and alerting toolkit popular for cloud-native environments.
Key Features:
- Time-series data collection and storage
- PromQL query language for data analysis
- Pull-based model for metrics collection
- Service discovery for dynamic environments
- Built-in alerting system
Prometheus excels in handling large-scale, dynamic environments, particularly for Kubernetes monitoring.
Pricing: Free to use
Pros:
- Free and open-source
- Highly scalable
- Excellent for Kubernetes monitoring
- Active community support
Cons:
- Requires self-hosting and maintenance
- Steep learning curve for PromQL
- Limited long-term data storage
- Requires additional tools for full visualization
Bottom Line: Prometheus is robust and cost-effective, particularly strong for cloud-native environments. It offers powerful querying capabilities and scales well, but requires more hands-on management compared to SaaS alternatives.
4. AppDynamics

AppDynamics is a powerful Application Performance Management (APM) tool offering deep insights into complex software environments.
Key Features:
- Real-time application mapping
- Code-level diagnostics
- Transaction tracing
- Support for legacy systems
- AI-powered anomaly detection and root cause analysis
AppDynamics provides flexibility with SaaS, on-premises, and hybrid deployment options.
Pricing: Traditional licensing model based on monitored agents/servers. Specific prices aren't public.
Pros:
- Comprehensive APM capabilities
- Strong support for legacy technologies
- Advanced analytics and visualization
- Excellent customer support
Cons:
- Complex installation process
- Higher pricing compared to some competitors
- Poor integration with AWS services
- Steep learning curve
Bottom Line: AppDynamics is robust for complex, enterprise-level environments. Its advanced analytics and support for specialized technologies make it strong for large businesses with diverse tech stacks. However, its higher price point and complex setup may not suit smaller companies or those with budget constraints.
5. Splunk

Splunk offers comprehensive data analysis and IT operations capabilities, handling massive amounts of data with in-depth analytics.
Key Features:
- Real-time infrastructure monitoring across on-premise, hybrid, and multi-cloud environments
- Powerful search and correlation for raw log data
- AI-driven analytics and automation
- Over 250 out-of-the-box integrations
- Customizable dashboards and visualizations
Splunk excels in processing huge volumes of machine-generated data, strengthening security posture, and integrating SIEM, ITOM, and ITSM management.
Pricing: Complex structure, can be expensive for larger deployments
Pros:
- Handles petabytes of data per day
- Powerful search and analytics capabilities
- Comprehensive security features
- Flexible deployment options
Cons:
- Complex implementation process
- Steep learning curve
- High cost, especially with additional modules
- Can be resource-intensive
Bottom Line: Splunk is robust for large enterprises with complex data analysis needs and substantial budgets. Its ability to handle massive data volumes and provide deep insights makes it top choice for industries like finance and e-commerce. Smaller organizations or those with simpler monitoring requirements might find its complexity and cost prohibitive.