Looking for a Datadog alternative? Here's a quick rundown of top options:
- New Relic: User-friendly with strong cloud integration
- Dynatrace: AI-driven insights for enterprise environments
- AppDynamics: Detailed transaction tracing for complex apps
- Splunk: Powerful search for large-scale data analysis
- Prometheus: Flexible, open-source monitoring
- Grafana: Customizable visualization platform
- Elastic Stack (ELK): Robust log management and analysis
- SolarWinds: Strong network monitoring capabilities
- Zabbix: Open-source, highly customizable solution
- Nagios: Veteran in IT infrastructure monitoring
- LogicMonitor: Rapid implementation with wide-ranging capabilities
- SigNoz: Open-source APM with OpenTelemetry support
Your choice depends on your specific needs, budget, and tech environment. Let's dive into the details.
Related video from YouTube
Quick Comparison
| Tool | Best For | Key Feature | Pricing Model |
|---|---|---|---|
| Datadog | Unified monitoring | Extensive integrations | Subscription-based |
| New Relic | User-friendly interface | Cloud service integration | Usage-based |
| Dynatrace | Enterprise environments | AI-driven insights | Subscription-based |
| AppDynamics | Complex applications | End-to-end tracing | Per CPU core |
| Splunk | Large-scale data analysis | Powerful search | Data volume-based |
| Prometheus | Open-source enthusiasts | Flexible data model | Free, open-source |
Test before you commit. Most tools offer free trials, so you can see how they perform in your actual environment.
Why Look for Datadog Alternatives
Datadog is popular, but it has issues. Here's why companies explore other options:
1. Sky-high costs
Datadog's pricing can spiral out of control, especially for growing companies. Here's a breakdown of their log management costs:
| Service | Price |
|---|---|
| Log ingestion | $0.10 per GB |
| 3-day retention | $1.06 per million log events |
| 30-day retention | $2.50 per million log events |
These costs add up fast. One cryptocurrency company received a $65 million bill from Datadog.
2. Complex billing
Datadog's SKU-based pricing is hard to predict. Custom metrics alone can make up 52% of your total bill, starting at $0.05 per metric per month.
3. Scaling challenges
As companies grow, Datadog's costs often increase disproportionately. Many startups find themselves priced out as they scale.
4. Limited free tier
Datadog's free offering is restrictive, pushing users towards paid plans sooner than they might like.
5. Setup headaches
Users often face issues with hostname detection and API key configuration when getting started.
6. Slow log analysis
Datadog lacks a query language, which can make exploratory analysis of logs time-consuming and frustrating.
7. Vendor lock-in concerns
Some users report feeling trapped by Datadog's ecosystem, making it hard to switch to other tools.
8. Pushy sales tactics
There have been complaints about Datadog's sales team aggressively pursuing engineers to sign up for services.
Given these challenges, it's no wonder companies are looking elsewhere. As Dave Armlin, VP Customer Success of ChaosSearch, puts it:
"With scale, Datadog becomes both more expensive and harder to use."
Many organizations are now turning to open-source alternatives like Grafana + Loki for more cost-effective and flexible log management. These tools offer similar functionality without the drawbacks of Datadog's proprietary solution.
When considering Datadog alternatives, look for:
- Transparent, predictable pricing
- Scalable solutions that grow with your business
- User-friendly interfaces
- Robust log management and analysis capabilities
- Open-source options to avoid vendor lock-in
What to Look for in Monitoring Tools
When searching for Datadog alternatives, focus on key features that meet your monitoring needs:
Real-time monitoring and alerts: Look for tools that provide up-to-the-minute data on your systems' health and performance. New Relic offers real-time alerts and can ingest up to 100 GB of data for free.
Comprehensive visibility: Choose a solution that covers your entire tech stack. Dynatrace's full-stack monitoring package, priced at $69/month for 8 GB per host, offers a holistic view of your infrastructure.
Scalability: As your business grows, your monitoring tool should grow with you. AppDynamics, starting at $60/month per CPU core, is designed to handle complex, distributed architectures.
User-friendly interface: Opt for tools with clear, customizable dashboards. This allows both technical and non-technical team members to understand system performance at a glance.
Integration capabilities: Ensure the tool can connect with your existing tech stack. Look for integrations with popular platforms like GitHub, Bitbucket, and Slack.
Cost structure: Pay attention to pricing models to avoid unexpected costs. Here's a comparison of some popular tools:
| Tool | Starting Price | Pricing Model |
|---|---|---|
| New Relic | $549/user | Usage-based, 100 GB free |
| Dynatrace | $69/month | 8 GB per host (annual billing) |
| AppDynamics | $60/month | Per CPU core |
| Better Stack | $24/month | Freelancer package |
Open-source options: Consider open-source alternatives like SigNoz for more cost-effective and flexible solutions.
1. New Relic
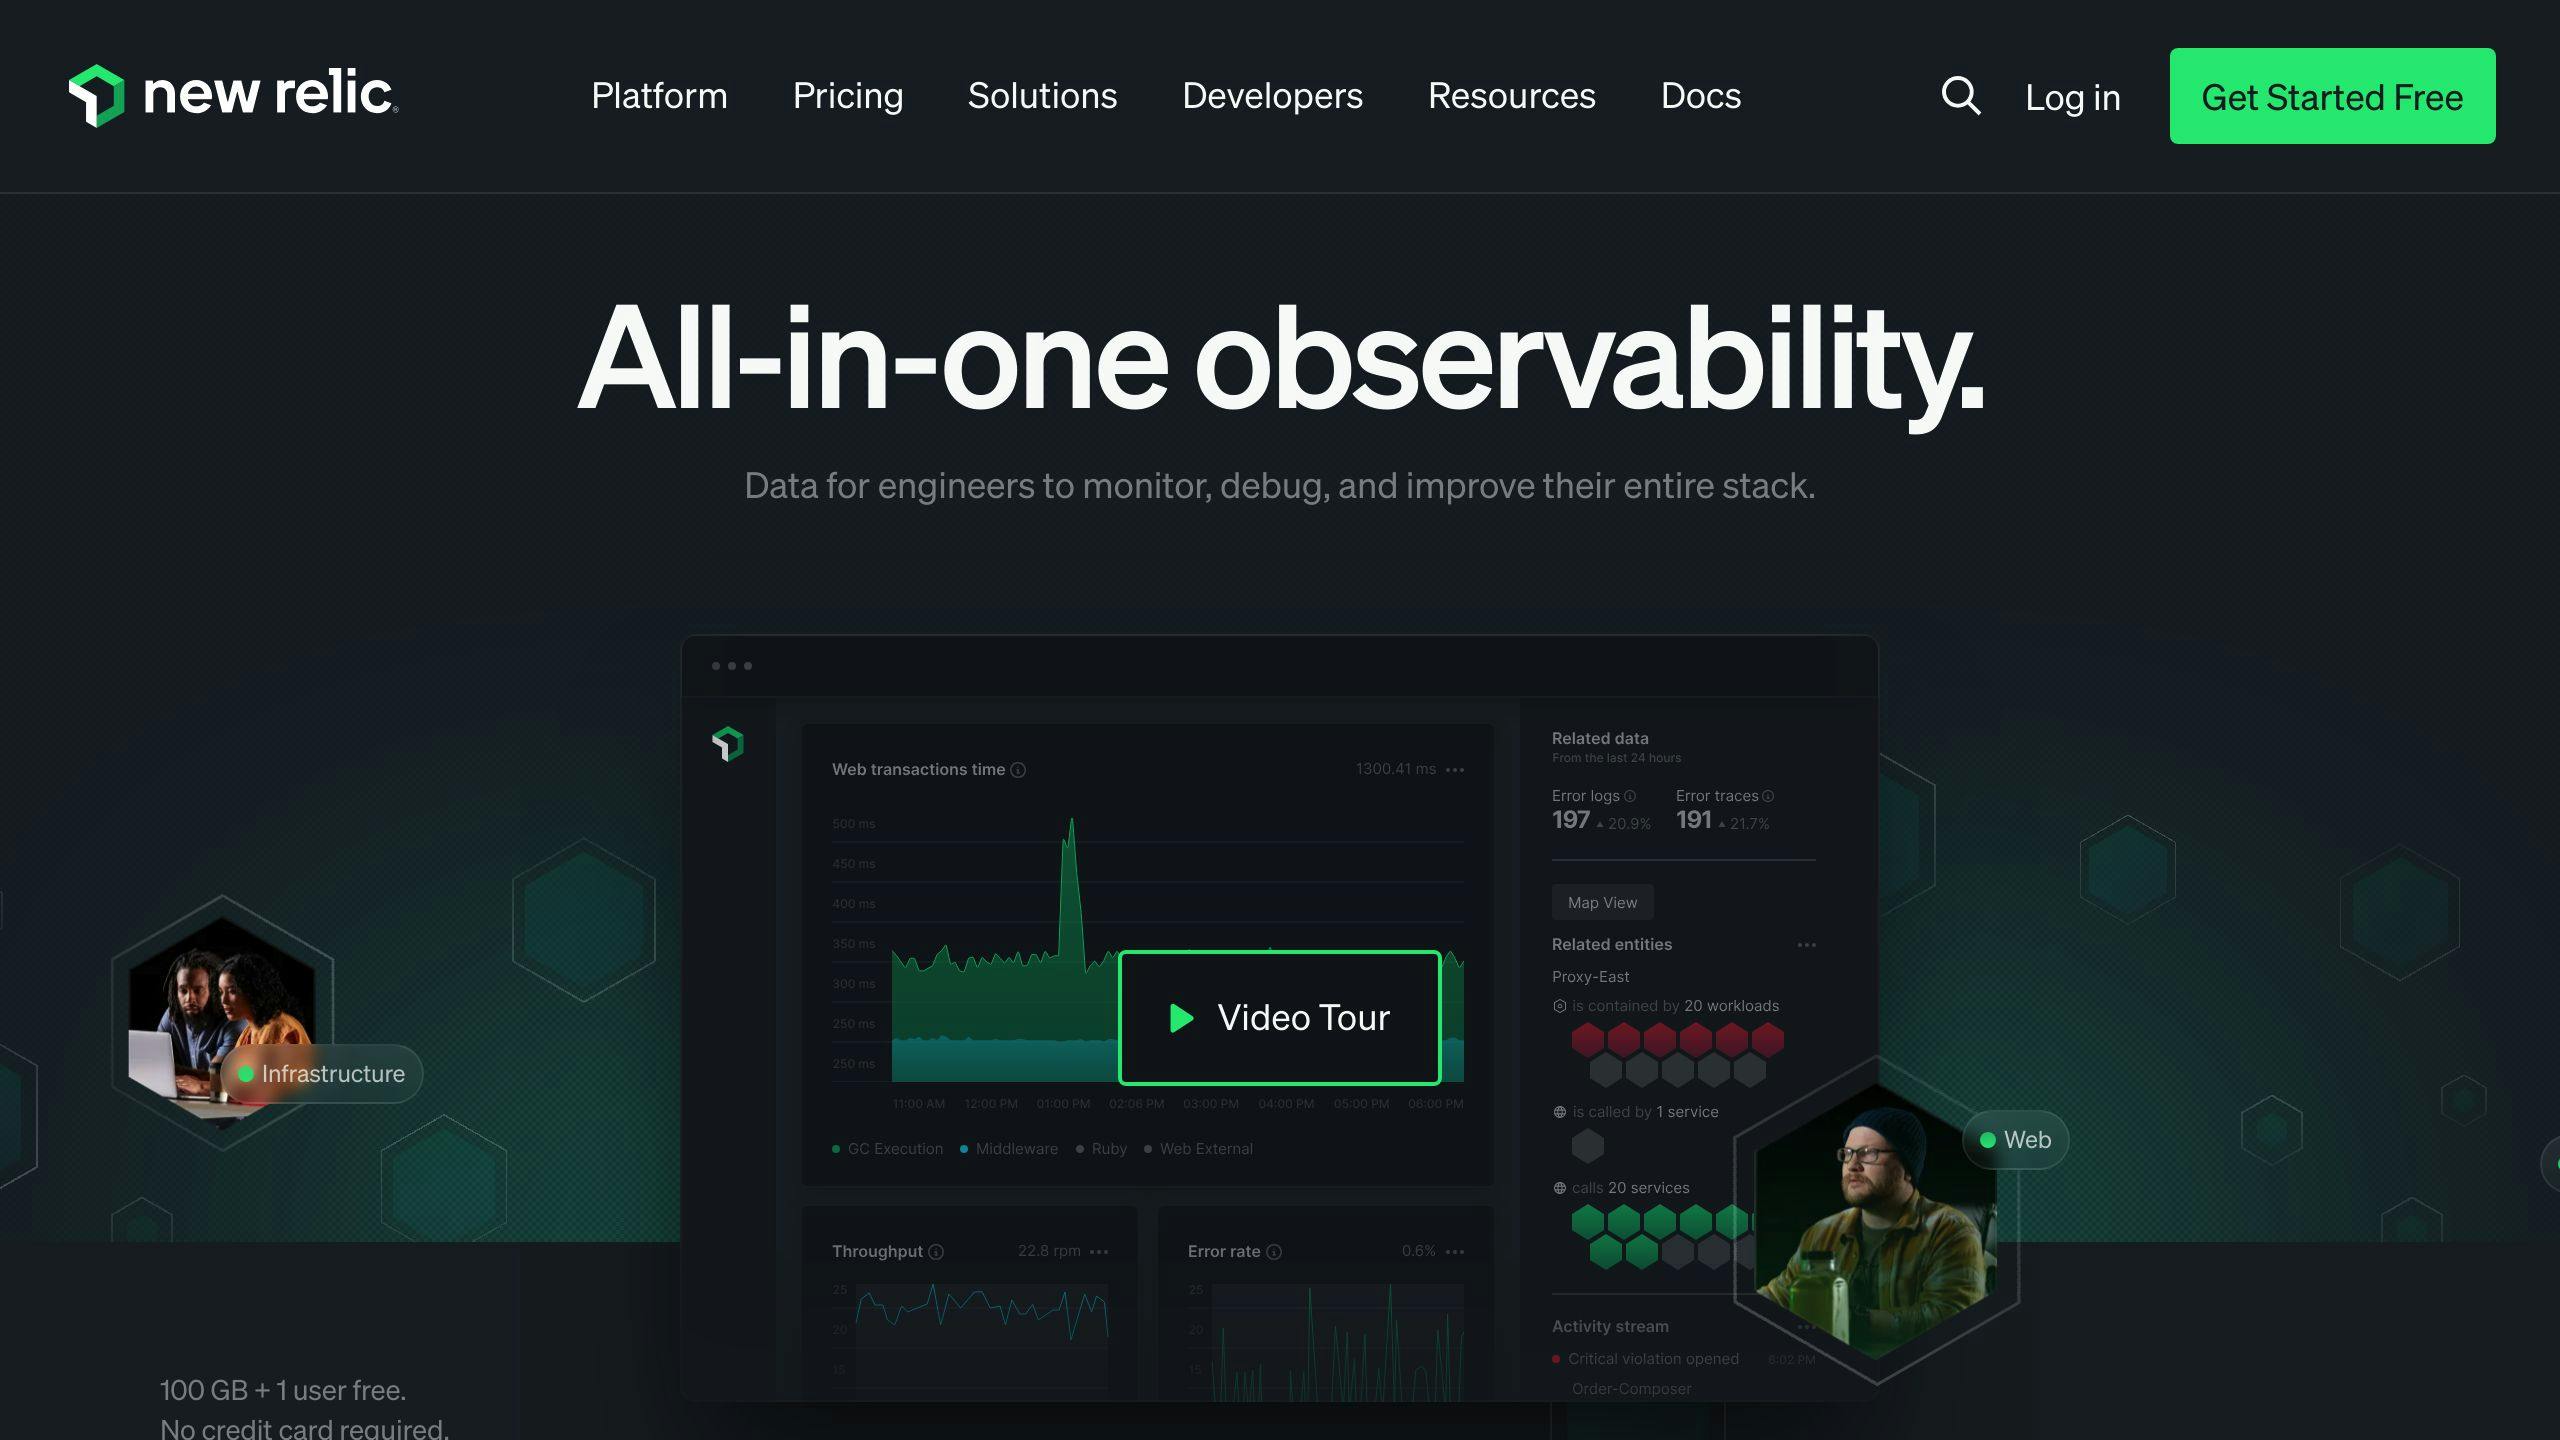
New Relic is a cloud-based observability platform that offers full-stack monitoring for complex software environments. It provides real-time insights into application performance, infrastructure health, and user experience.
Key features of New Relic include:
- Application Performance Monitoring (APM)
- Infrastructure monitoring
- Real-time user monitoring
- Log management
- AI-powered incident response
New Relic's pricing model is usage-based, with a free tier that includes:
- 100 GB of data ingestion per month
- One free Full Platform user
- Unlimited free Basic users
For data usage beyond the free tier, New Relic charges $0.30 per GB ($0.35 for EU region).
| User Type | Price |
|---|---|
| Basic | Free |
| Core | $49/month |
| Full Platform | $99/month (after first free user) |
New Relic has gained popularity among large enterprises. The U.S. Department of Health and Human Services used New Relic to troubleshoot the Healthcare.gov website issues in 2013.
In March 2023, New Relic added AI monitoring capabilities to its platform. This update includes features like:
- AI response tracing insights
- Real-time user feedback integration
- Model comparison
- Over 60 integrations for AI components
Arnie Lopez, Chief Customer Officer at New Relic, stated: "Based on my conversations with CIOs, CTOs, and executives across our customer base, it is clear that every company is thinking about how to scale their business with AI."
When comparing New Relic to Datadog:
| Feature | New Relic | Datadog |
|---|---|---|
| APM | Strong | Needs other products |
| Infrastructure monitoring | Good | Strong |
| Log management | Limited | Good |
| Freemium plan | Yes | No |
New Relic's UI is known for being user-friendly and minimalistic. However, some users have reported issues with the deployment process, describing it as complex and unstable.
For businesses looking to try New Relic, the platform offers a free-forever, full-access account without time limitations. This allows users to test its features thoroughly before committing to a paid plan.
2. Dynatrace

Dynatrace is a powerful Application Performance Management (APM) tool designed for enterprise-level monitoring. It offers comprehensive monitoring capabilities for cloud, on-premise, and hybrid applications.
Key features of Dynatrace include:
- AI-powered algorithms for predictive alerts
- Extensive application and infrastructure monitoring
- Support for both monolithic and microservices architectures
- Out-of-the-box monitoring for hosts, Docker containers, and services
Dynatrace's AI-assisted monitoring helps manage operational complexity, allowing teams to identify and resolve issues quickly. For example, ZoomInfo reported significant time savings:
"After deploying a new release, we spent over 30 hours trying to find a performance problem. With Dynatrace, finding a similar problem would only take us minutes to identify, saving us precious time and resources."
The platform's ease of use is often highlighted by users. Ofertia, a Spanish company, noted:
"Dynatrace's ease of deployment and its auto-detection capabilities that reduce installation effort to near zero really impressed us. We got meaningful alerts right away."
Dynatrace offers several advantages over other monitoring tools:
| Feature | Dynatrace | Other Tools |
|---|---|---|
| Data sources supported | 575 | Varies |
| Query language | DQL (Dynatrace Query Language) | SQL or proprietary |
| Installation | One Agent for full-stack monitoring | Multiple agents often required |
| Log management | Powered by Grail, no schemas or indexing needed | Often requires complex setup |
For businesses considering Dynatrace, it's important to:
- Get buy-in from executive leadership and all app and infrastructure teams
- Set up meaningful dashboards and management zones
- Use Dynatrace's professional services for faster deployment
Dynatrace has proven useful for various teams. As Nitish Kapoor, Senior Application Developer at IBM, explains:
"Our team is using Dynatrace as a monitoring tool for the windows application services. It is monitoring the services 24/7 and sends an alert to the application owners if the services are down."
While Dynatrace offers robust features, it's worth noting that it requires the installation of One Agent for full-stack monitoring. This might be a consideration for organizations with specific security or deployment requirements.
3. AppDynamics

AppDynamics is a robust Application Performance Management (APM) solution that offers deep insights into application performance and user experience. It stands out for its ability to monitor complex, distributed applications across various environments.
Key features of AppDynamics include:
- Real-time monitoring and analytics
- Code-level diagnostics and transaction tracing
- Support for multiple technologies (Java, .NET, PHP, Node.js, NoSQL)
- AI-powered anomaly detection and automated insights
AppDynamics uses a unique approach called Business Transactions (BTs) to track services invoked by users. This allows for a more business-oriented view of application performance.
| Feature | Description |
|---|---|
| Deployment Options | On-premise, SaaS, or hybrid |
| Monitoring Scope | Full-stack (application, infrastructure, user experience) |
| Integration | Supports multi-cloud management and various IT systems |
| Pricing Model | Based on number of agents/servers monitored |
AppDynamics requires more setup compared to some alternatives, as it needs agents installed on application servers. However, this allows for deeper visibility into application performance.
"AppDynamics stands out with its tight integration of automation (AIOps) features with its Application Performance Management (APM) offering." - Louis-Victor Jadavji, Cofounder of Taloflow
For businesses considering AppDynamics, it's important to:
- Ensure your team is well-trained in using the platform
- Define custom Business Transactions for your specific services
- Use the out-of-the-box monitoring capabilities and alerts
AppDynamics is particularly suited for enterprise companies with dedicated IT Operations teams and complex application infrastructures. Its advanced features make it a strong choice for organizations needing deep code visibility and powerful real-time insights.
While AppDynamics offers robust monitoring capabilities, it's worth noting that it has a more limited integration ecosystem compared to some competitors like Datadog. This might be a consideration for organizations heavily reliant on a wide range of DevOps tools.
4. Splunk

Splunk is a powerful software platform that excels in searching, monitoring, and analyzing machine-generated big data. It offers a range of solutions for analytics, IT operations, monitoring, and security, making it a strong alternative to Datadog for performance monitoring.
Key features of Splunk include:
- Real-time data ingestion and indexing
- Advanced search capabilities
- Customizable dashboards and reports
- Proactive alerting and monitoring
- Robust security and compliance measures
Splunk stands out for its ability to handle vast amounts of data from diverse sources, making it well-suited for large enterprises with complex infrastructures. It supports multiple data formats, including .json, .xml, and .csv, providing flexibility in data processing.
| Feature | Splunk | Datadog |
|---|---|---|
| Deployment options | On-premise, cloud, hybrid | Cloud-only |
| Target market | Medium to large enterprises | SMBs to large organizations |
| Data formats supported | Multiple (.xml, .csv, .json) | Limited |
| Integration ecosystem | 100+ | 500+ |
| Pricing model | Based on data volume | Per-host or per-device |
Splunk's pricing is pay-as-you-go, with costs varying depending on the number of data sources, hosts, and users. While it may be more expensive to implement than Datadog, Splunk offers unparalleled flexibility and customization options.
A real-world example of Splunk's impact comes from a Hong Kong-based financial services group. By transitioning to a cloud-based Security Information and Event Management (SIEM) system using Splunk, the company achieved:
- Setup of in-country SIEM systems within a month (previously took months)
- Full visibility across its international environment without manual effort
- Improved security posture
- Accelerated digital transformation journey
For organizations considering Splunk, it's important to:
- Assess your data volume and complexity
- Evaluate your team's technical expertise (Splunk has a steeper learning curve)
- Consider your budget and long-term scalability needs
Splunk's complexity may require users to invest time in learning the platform. However, once mastered, it offers powerful search and analysis capabilities that can provide deep insights into your infrastructure and application performance.
"Splunk stands out with its impressive search capabilities and analytics, making it ideal for organizations that heavily rely on data analysis", notes a senior IT analyst at Gartner.
While Splunk may not be the best fit for smaller organizations or those with simpler monitoring needs, it's a top choice for enterprises dealing with large volumes of complex data and requiring advanced analytics capabilities.
sbb-itb-9890dba
5. Prometheus
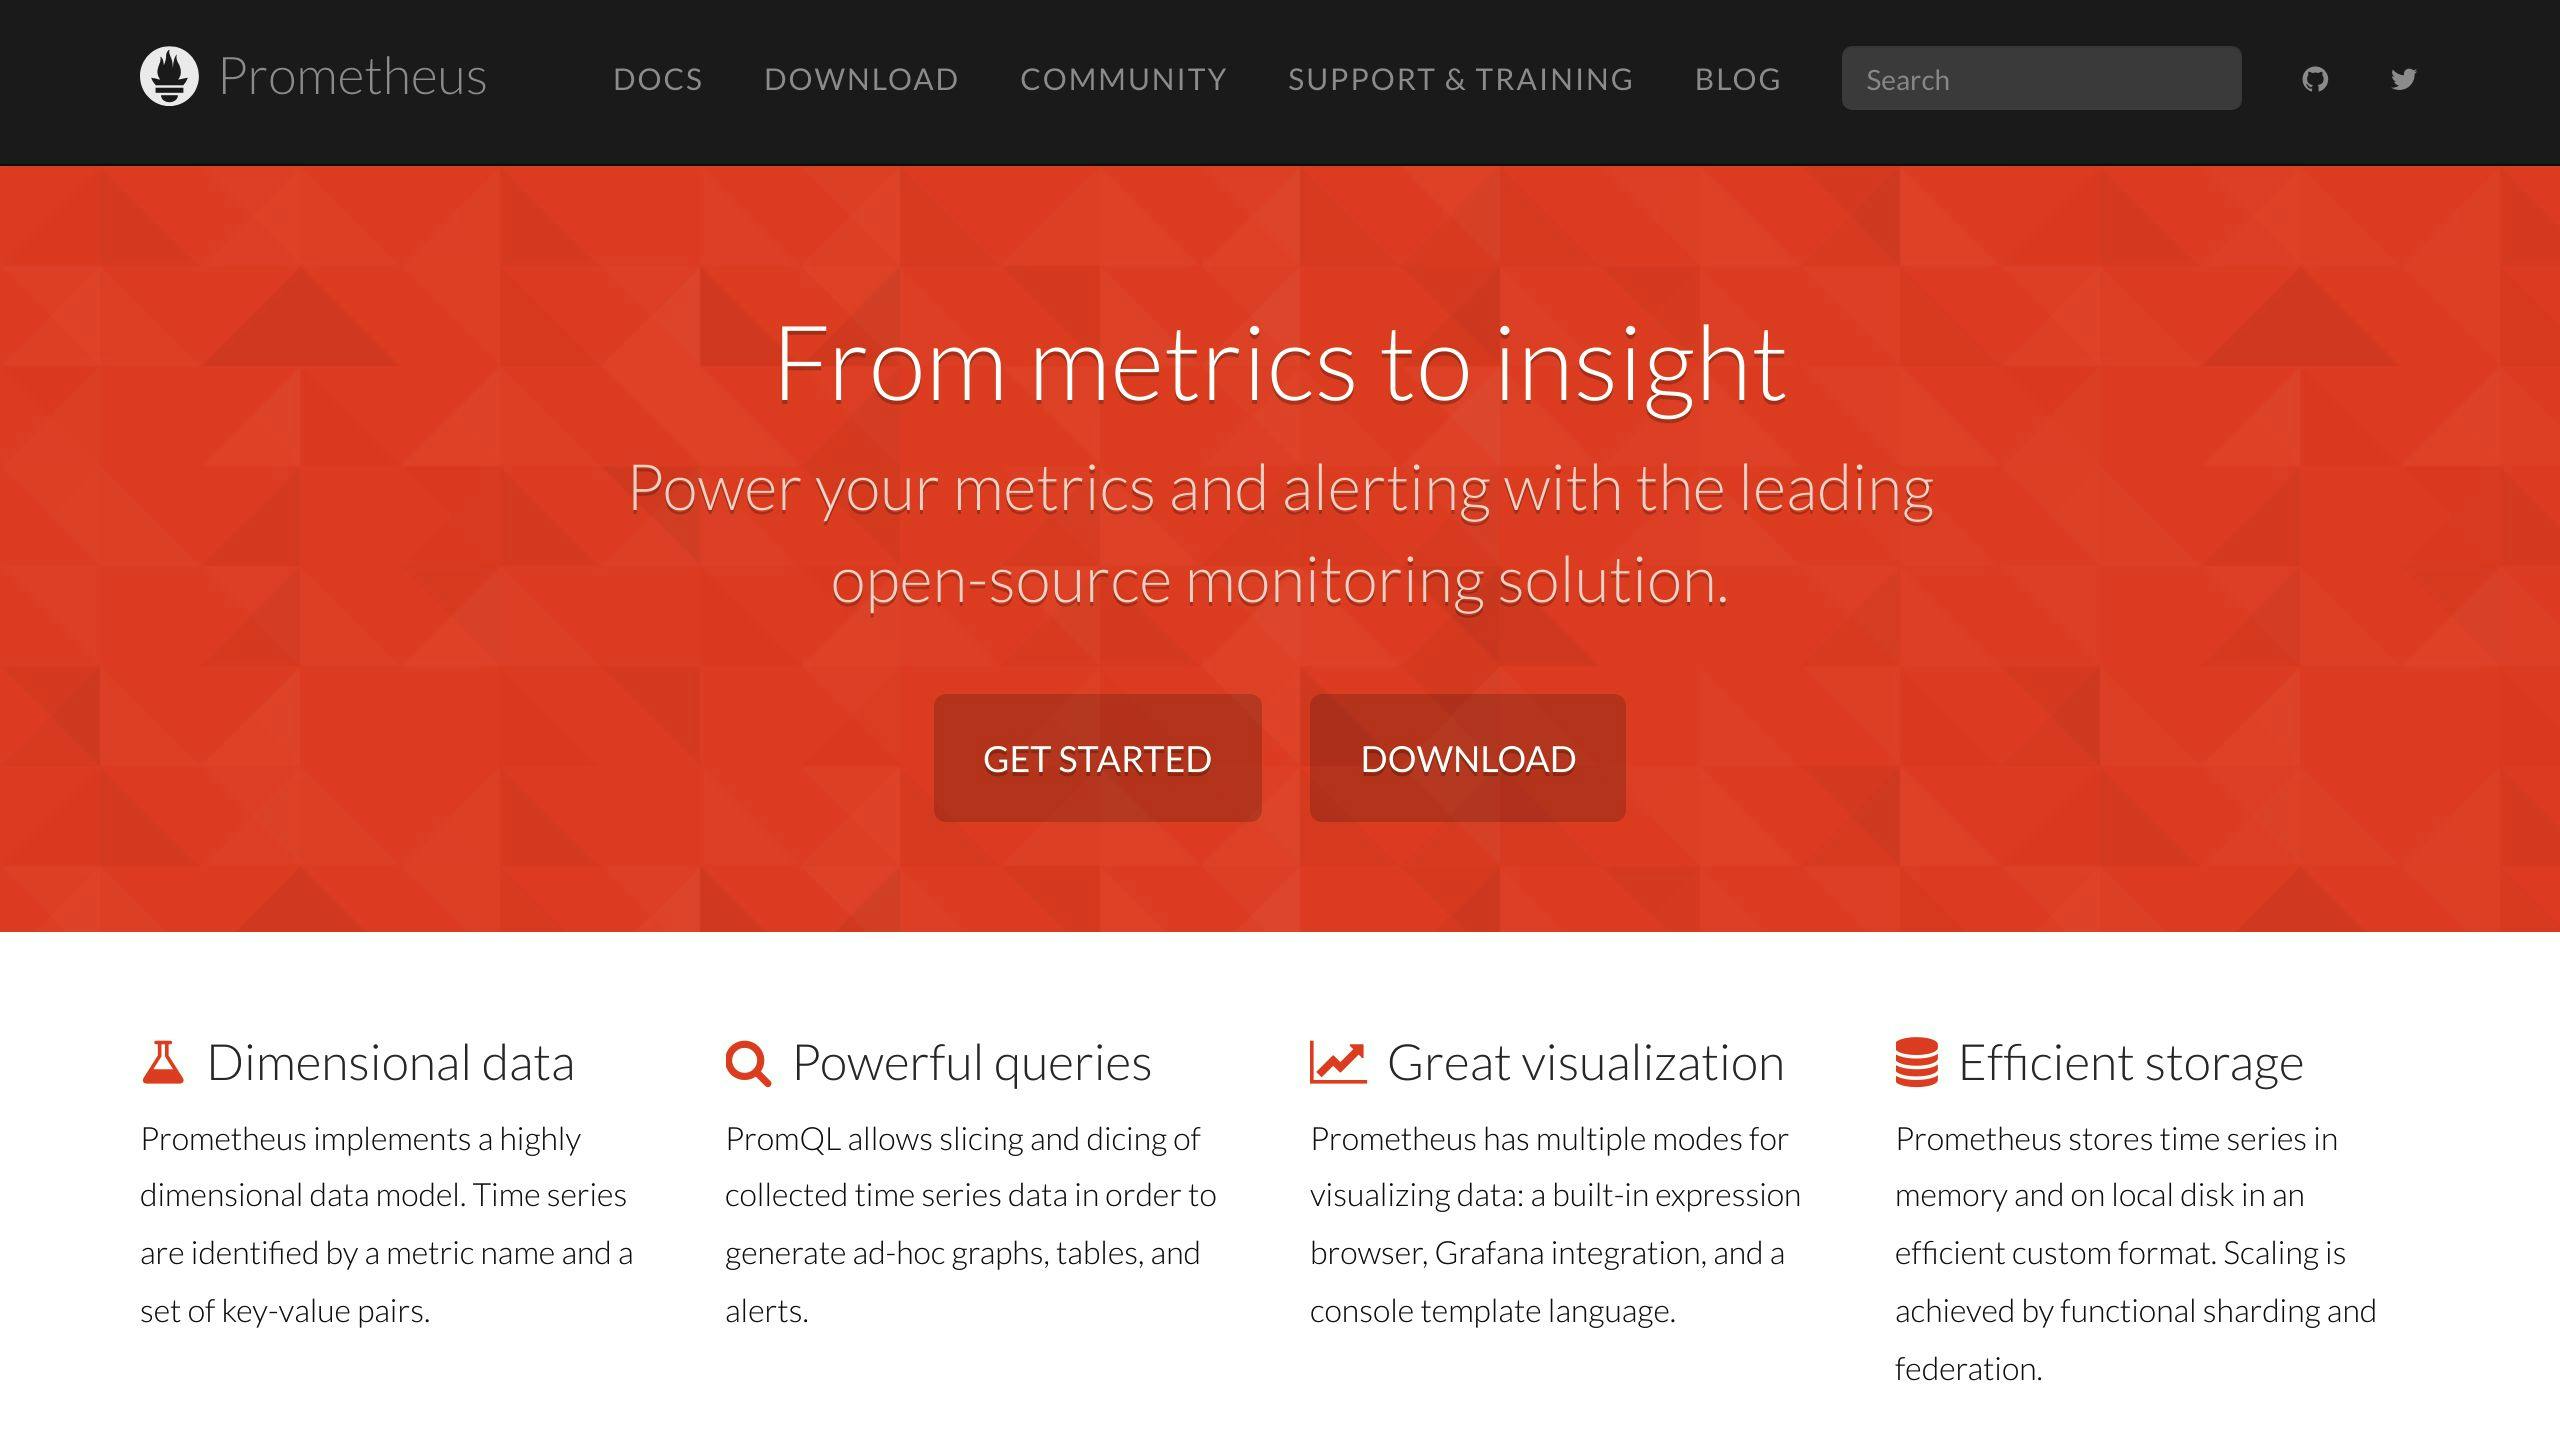
Prometheus is an open-source monitoring and alerting toolkit that has gained popularity among DevOps teams and system administrators. It excels at collecting and storing metrics as time-series data, making it a strong contender in the world of performance monitoring tools.
Key features of Prometheus include:
- Pull-based model for metrics collection
- Multi-dimensional data model with key-value pairs
- PromQL query language for flexible data analysis
- Built-in alerting system
- Integration with visualization tools like Grafana
Prometheus operates by scraping metrics from HTTP endpoints of various targets, including infrastructure platforms like Kubernetes and applications. This approach allows for efficient data collection without the need for agents or complex protocols.
| Feature | Prometheus | Datadog |
|---|---|---|
| Deployment | Self-hosted | SaaS |
| Data collection | Pull-based | Agent-based |
| Pricing | Free, open-source | Subscription-based |
| Scalability | Challenging in multi-cluster environments | Built for scale |
| Visualization | Basic UI, often paired with Grafana | Advanced built-in dashboards |
While Prometheus offers powerful monitoring capabilities, it does have some limitations compared to Datadog. Scaling Prometheus in multi-cluster enterprise environments can be challenging, and its visualization features are not as robust out-of-the-box.
To address these issues, many organizations use additional tools:
- Thanos: Improves high availability
- Cortex: Enhances scalability
- Grafana: Provides advanced visualization
For example, OpsRamp has adopted Prometheus Cortex to help with enterprise scaling challenges. They assist Prometheus administrators by importing and storing metrics data, avoiding the need to manage multiple local databases across Kubernetes clusters.
To effectively use Prometheus:
- Set up endpoints to expose metrics in your applications
- Use exporters to collect data from various sources
- Configure alerting rules to catch issues early
- Integrate with Grafana for enhanced data visualization
While Prometheus requires more setup and maintenance compared to SaaS solutions like Datadog, it offers greater control and flexibility over your monitoring setup. Its open-source nature and strong community support make it an attractive option for teams looking to build a customized monitoring solution.
"Prometheus stands out with its ability to operate independently, ensuring reliability during outages", notes a Cloud Native Computing Foundation representative.
For organizations considering Prometheus as a Datadog alternative, it's important to weigh the benefits of its flexibility and cost-effectiveness against the potential challenges of self-hosting and scaling the solution.
6. Grafana
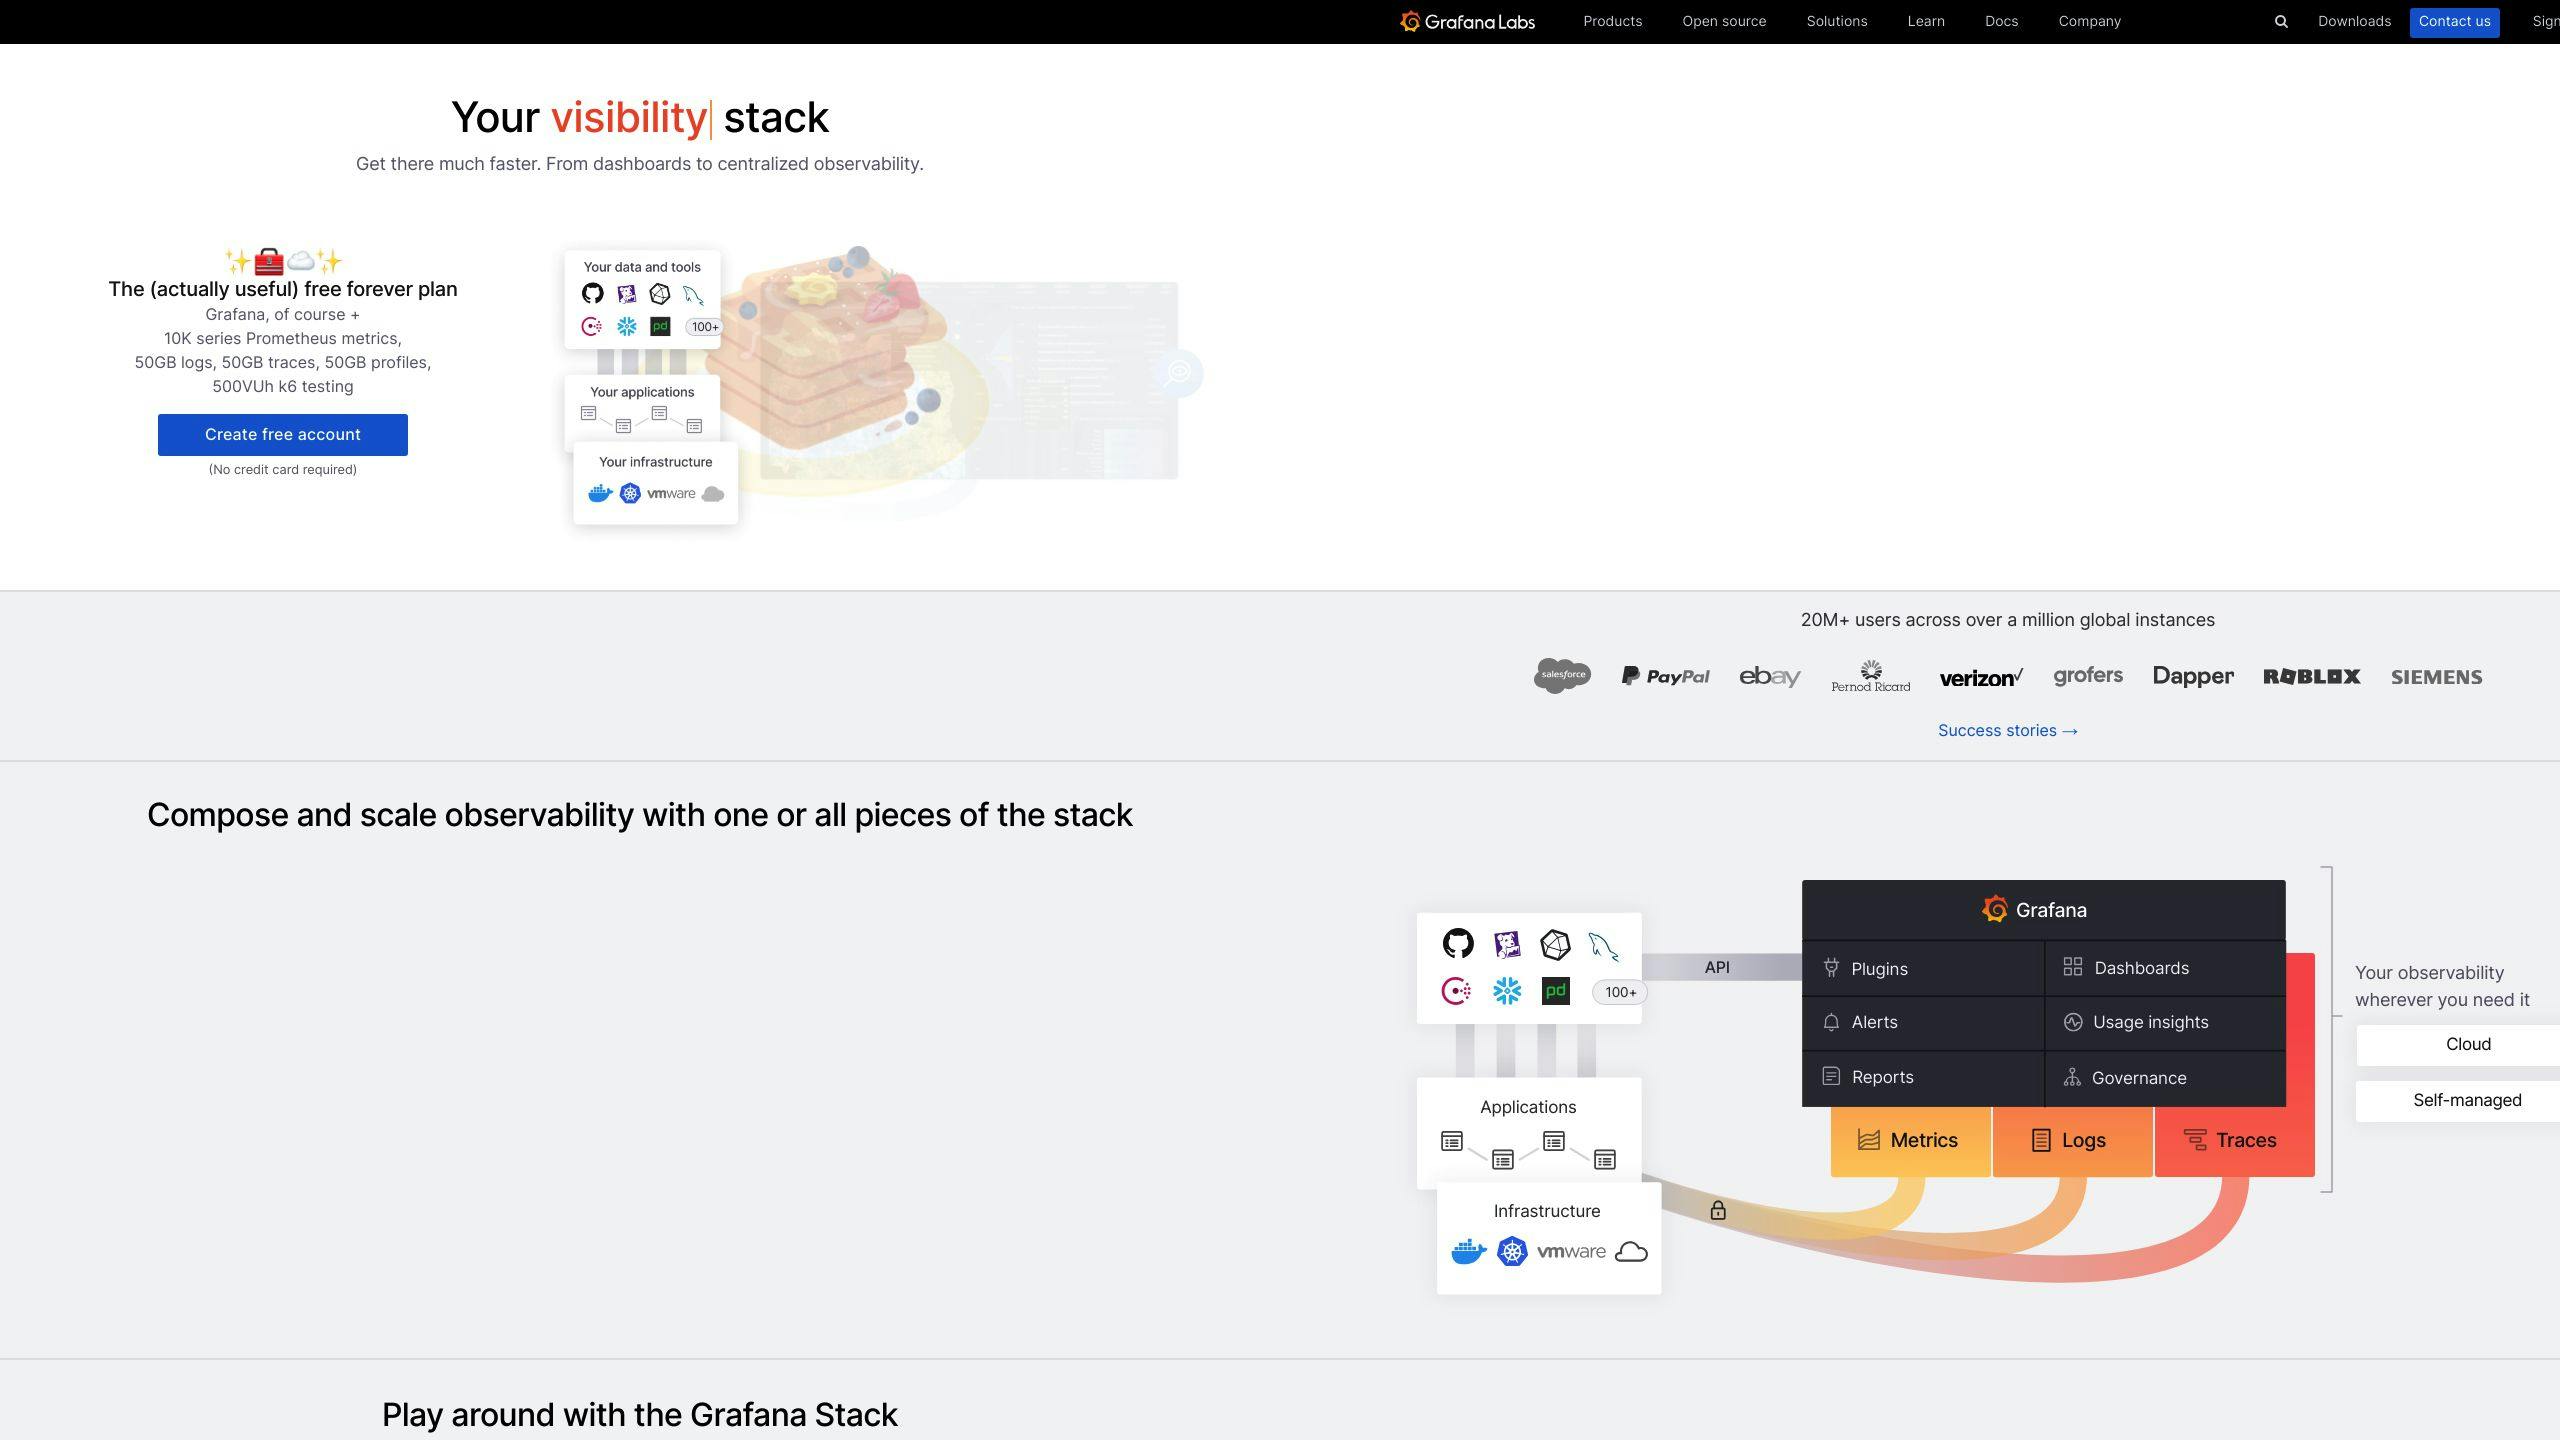
Grafana stands out as a powerful data visualization and analytics platform in the realm of performance monitoring. While it's not a direct replacement for Datadog's full suite of monitoring tools, Grafana excels in creating interactive and visually appealing dashboards from various data sources.
Key features of Grafana include:
- Support for over 100 pre-built solutions
- Integration with multiple data sources (e.g., Prometheus, MySQL, Cloudwatch)
- Customizable dashboards and alerting capabilities
- Open-source core with a freemium model
Grafana's strength lies in its flexibility and extensive customization options. Users can create tailored dashboards that aggregate data from different systems, providing a unified view of metrics.
| Feature | Grafana | Datadog |
|---|---|---|
| Primary Focus | Data Visualization | Comprehensive Monitoring |
| Deployment | Self-hosted or Cloud | SaaS |
| Pricing | Free open-source, paid plans from $29/month | Subscription-based |
| Data Sources | 150+ | 450+ |
| Customization | Highly flexible | Pre-built, less flexible |
Grafana's open-source nature and large user base contribute to its ongoing development. With over 43,000 commits to its project, Grafana continues to evolve and add new features.
For example, Grafana Live allows users to visualize streaming data without an external data source. This feature was showcased in a hackathon project called Doomfana, which streamed the video game Doom in a Grafana dashboard, demonstrating its ability to handle multiple active time series in real-time.
To use Grafana effectively:
- Integrate with your preferred data sources
- Design custom dashboards for your specific monitoring needs
- Set up alerting rules based on your data queries
- Use the query builders to create visualizations without deep knowledge of query languages
While Grafana offers impressive visualization capabilities, it's important to note that it may require more technical expertise to set up compared to Datadog. However, for organizations seeking detailed, customizable data visualization, Grafana presents a cost-effective and flexible option.
"Grafana's plugin ecosystem includes custom panels and apps, providing users with additional visualization options and features tailored to their specific needs", notes a Grafana representative.
For teams considering Grafana as part of their monitoring stack, it's crucial to evaluate the trade-offs between its powerful visualization features and the need for additional tools to cover all aspects of performance monitoring that Datadog provides in a single platform.
7. Elastic Stack (ELK)

Elastic Stack, often called ELK Stack, combines Elasticsearch, Logstash, and Kibana to provide a robust performance monitoring solution. This open-source platform offers log management, infrastructure monitoring, and application performance monitoring (APM) capabilities.
Key components of Elastic Stack include:
- Elasticsearch: A search engine that stores and indexes data
- Logstash: Collects and processes logs from multiple sources
- Kibana: Visualizes data through interactive dashboards
- Beats: Lightweight data collectors for specific use cases
Elastic APM, built on top of the Elastic Stack, allows real-time monitoring of software services and applications. It collects detailed performance information, including:
- Response times for incoming requests
- Database query performance
- Calls to caches and external HTTP requests
- Unhandled errors and exceptions
To implement Elastic APM in a Node.js application:
- Install the dependency:
npm i elastic-apm-node --save - Configure it in your application
- Use the APM dashboard to monitor latency, throughput, and resource usage
Elastic Stack supports popular programming languages such as Java, .NET, PHP, Python, and Go, making it suitable for diverse tech stacks.
| Feature | Elastic Stack | Datadog |
|---|---|---|
| Deployment | Self-hosted or cloud | SaaS |
| Pricing | Open-source core, paid support options | Subscription-based |
| Learning Curve | Steeper, requires more technical expertise | Easier setup and configuration |
| Customization | Highly flexible | Less flexible, pre-built solutions |
| Community Support | Active open-source community | Vendor-provided support |
Elastic Stack's strengths lie in its scalability and powerful log management capabilities. Its distributed search and analytics engine can process and analyze extensive log data sets efficiently.
However, it's worth noting that Elastic Stack requires more technical know-how for deployment and configuration compared to Datadog's SaaS-based solution.
For organizations seeking a customizable, open-source monitoring solution with strong log management features, Elastic Stack presents a compelling alternative to Datadog. Its flexibility allows for tailored monitoring setups, though at the cost of a steeper learning curve.
8. SolarWinds

SolarWinds offers a range of monitoring tools, with their Network Performance Monitor (NPM) being a key product for network management. NPM helps organizations quickly detect, diagnose, and resolve network performance issues.
Key features of SolarWinds NPM include:
- Multi-vendor network monitoring
- Network Insights for deeper visibility
- Intelligent mapping
- NetPath and PerfStack for troubleshooting
- Advanced alerting
- Critical path visualization
SolarWinds NPM can be deployed in the cloud or on-premises using Windows Server 2019, 2016, or 2012 R2.
The tool's licensing is based on the number of monitored items:
| License Tier | Node Limit | Volume Limit | Interface Limit |
|---|---|---|---|
| SL100 | 100 | 100 | 100 |
| SL250 | 250 | 250 | 250 |
| SL500 | 500 | 500 | 500 |
| SL2000 | 2000 | 2000 | 2000 |
| SLX | Unlimited | Unlimited | Unlimited |
SolarWinds NPM uses SNMP monitoring to gather critical performance metrics and includes autodiscovery for asset inventory and network topology mapping.
Users have praised specific features of SolarWinds NPM:
"The 'Performance Analyzer' feature is the solution's most valuable aspect. It's able to do the bounded graphs of all the interface stats, from errors to broadcasts and to current traffic. With a click of a button you're able to, in one interface, look at historical data for those items."
- Andrew N., Senior Network Engineer at Element Critical
"The alerting and usage tracking is a valuable feature because it alerts us when we're getting near capacity on disk space, network utilization or processor utilization. It helps us manage our capacity and enables us to be proactive."
- Daniel S., Systems and Data Warehouse Supervisor at MMSD
For application monitoring, SolarWinds offers AppOptics APM, which provides visibility into application and infrastructure performance across AWS, Azure, and hybrid environments. AppOptics includes over 150 out-of-the-box plugins, integrations, and custom metrics for monitoring critical systems.
When comparing SolarWinds to Datadog, consider these factors:
- SolarWinds is particularly effective for applications running on Windows hosts, especially in VMware or HyperV environments.
- SolarWinds Server & Application Monitor (SAM) is noted for its ease of use and versatility.
- Datadog may offer a more streamlined SaaS experience, while SolarWinds provides more flexibility in deployment options.
For organizations looking for a Datadog alternative with strong network monitoring capabilities and Windows environment support, SolarWinds presents a solid option to consider.
9. Zabbix
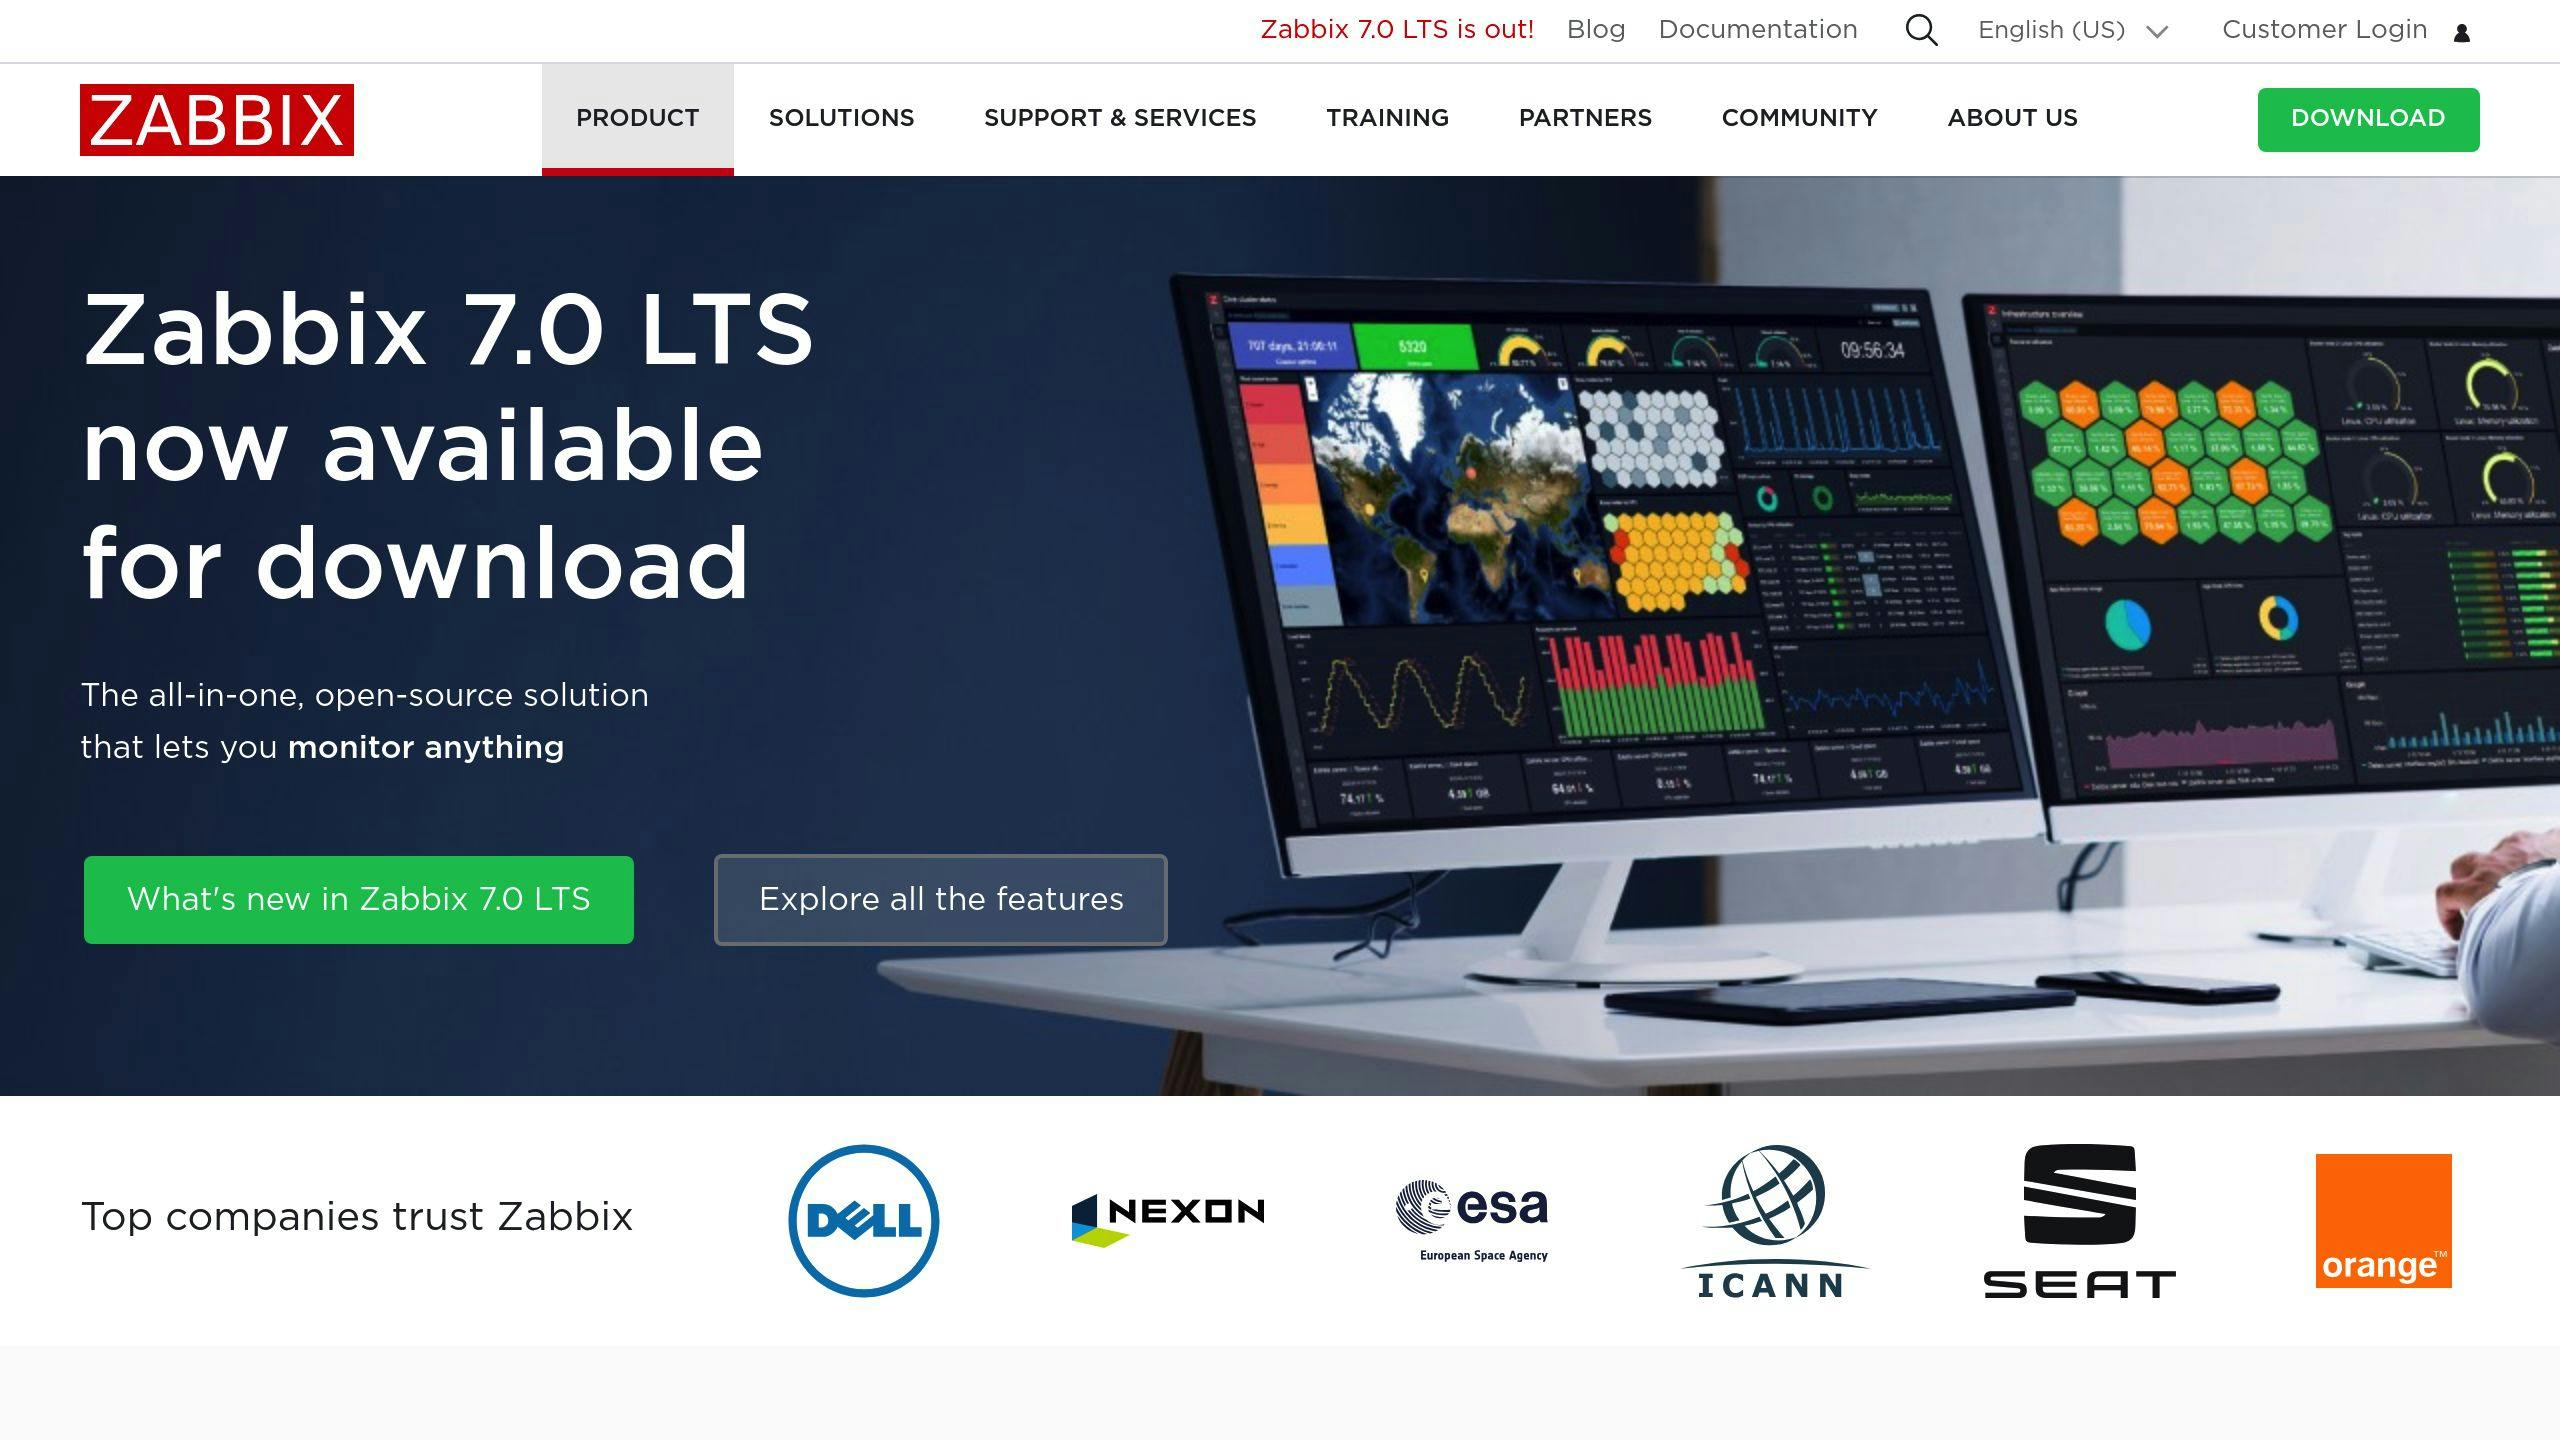
Zabbix is an open-source monitoring solution that offers a robust set of features for tracking IT infrastructure performance. It can monitor networks, servers, applications, and cloud services without any licensing fees.
Key features of Zabbix include:
- Real-time monitoring of various IT components
- Support for both agent-based and agentless monitoring
- Customizable dashboards and reports
- Flexible metric collection from multiple sources
- Scalability to monitor millions of metrics
Zabbix runs on Linux and other Unix-like systems, making it a good fit for organizations with diverse IT environments. It uses protocols like SNMP and ICMP for comprehensive monitoring capabilities.
One user shared their experience transitioning from Cacti to Zabbix:
"Zabbix is powerful, at the first time I use Cacti, I don't know that there have such a great product like this."
This user has been using Zabbix since 2017 to monitor a network of 60 Cisco switches, 4 Dell servers, 2 SAN storage units, and 60 virtual machines across different operating systems.
While Zabbix offers extensive functionality, it may present a learning curve for beginners. The installation process can be complex and require technical expertise. However, for organizations willing to invest time in setup and configuration, Zabbix provides a cost-effective alternative to Datadog.
Zabbix's flexibility allows users to extend monitoring capabilities through custom scripts and checks. It also supports multi-tenancy, making it suitable for managed service providers or large enterprises with multiple departments.
For those considering Zabbix as a Datadog alternative, here's a comparison of key aspects:
| Aspect | Zabbix | Datadog |
|---|---|---|
| Pricing | Free, open-source | Subscription-based |
| Deployment | On-premises or cloud | SaaS |
| Learning Curve | Steeper | More user-friendly |
| Customization | Highly customizable | Less flexible |
| Community Support | Large open-source community | Vendor-provided support |
Organizations looking for a highly customizable, cost-effective monitoring solution might find Zabbix a suitable Datadog alternative, especially if they have the technical resources to manage its deployment and configuration.
10. Nagios
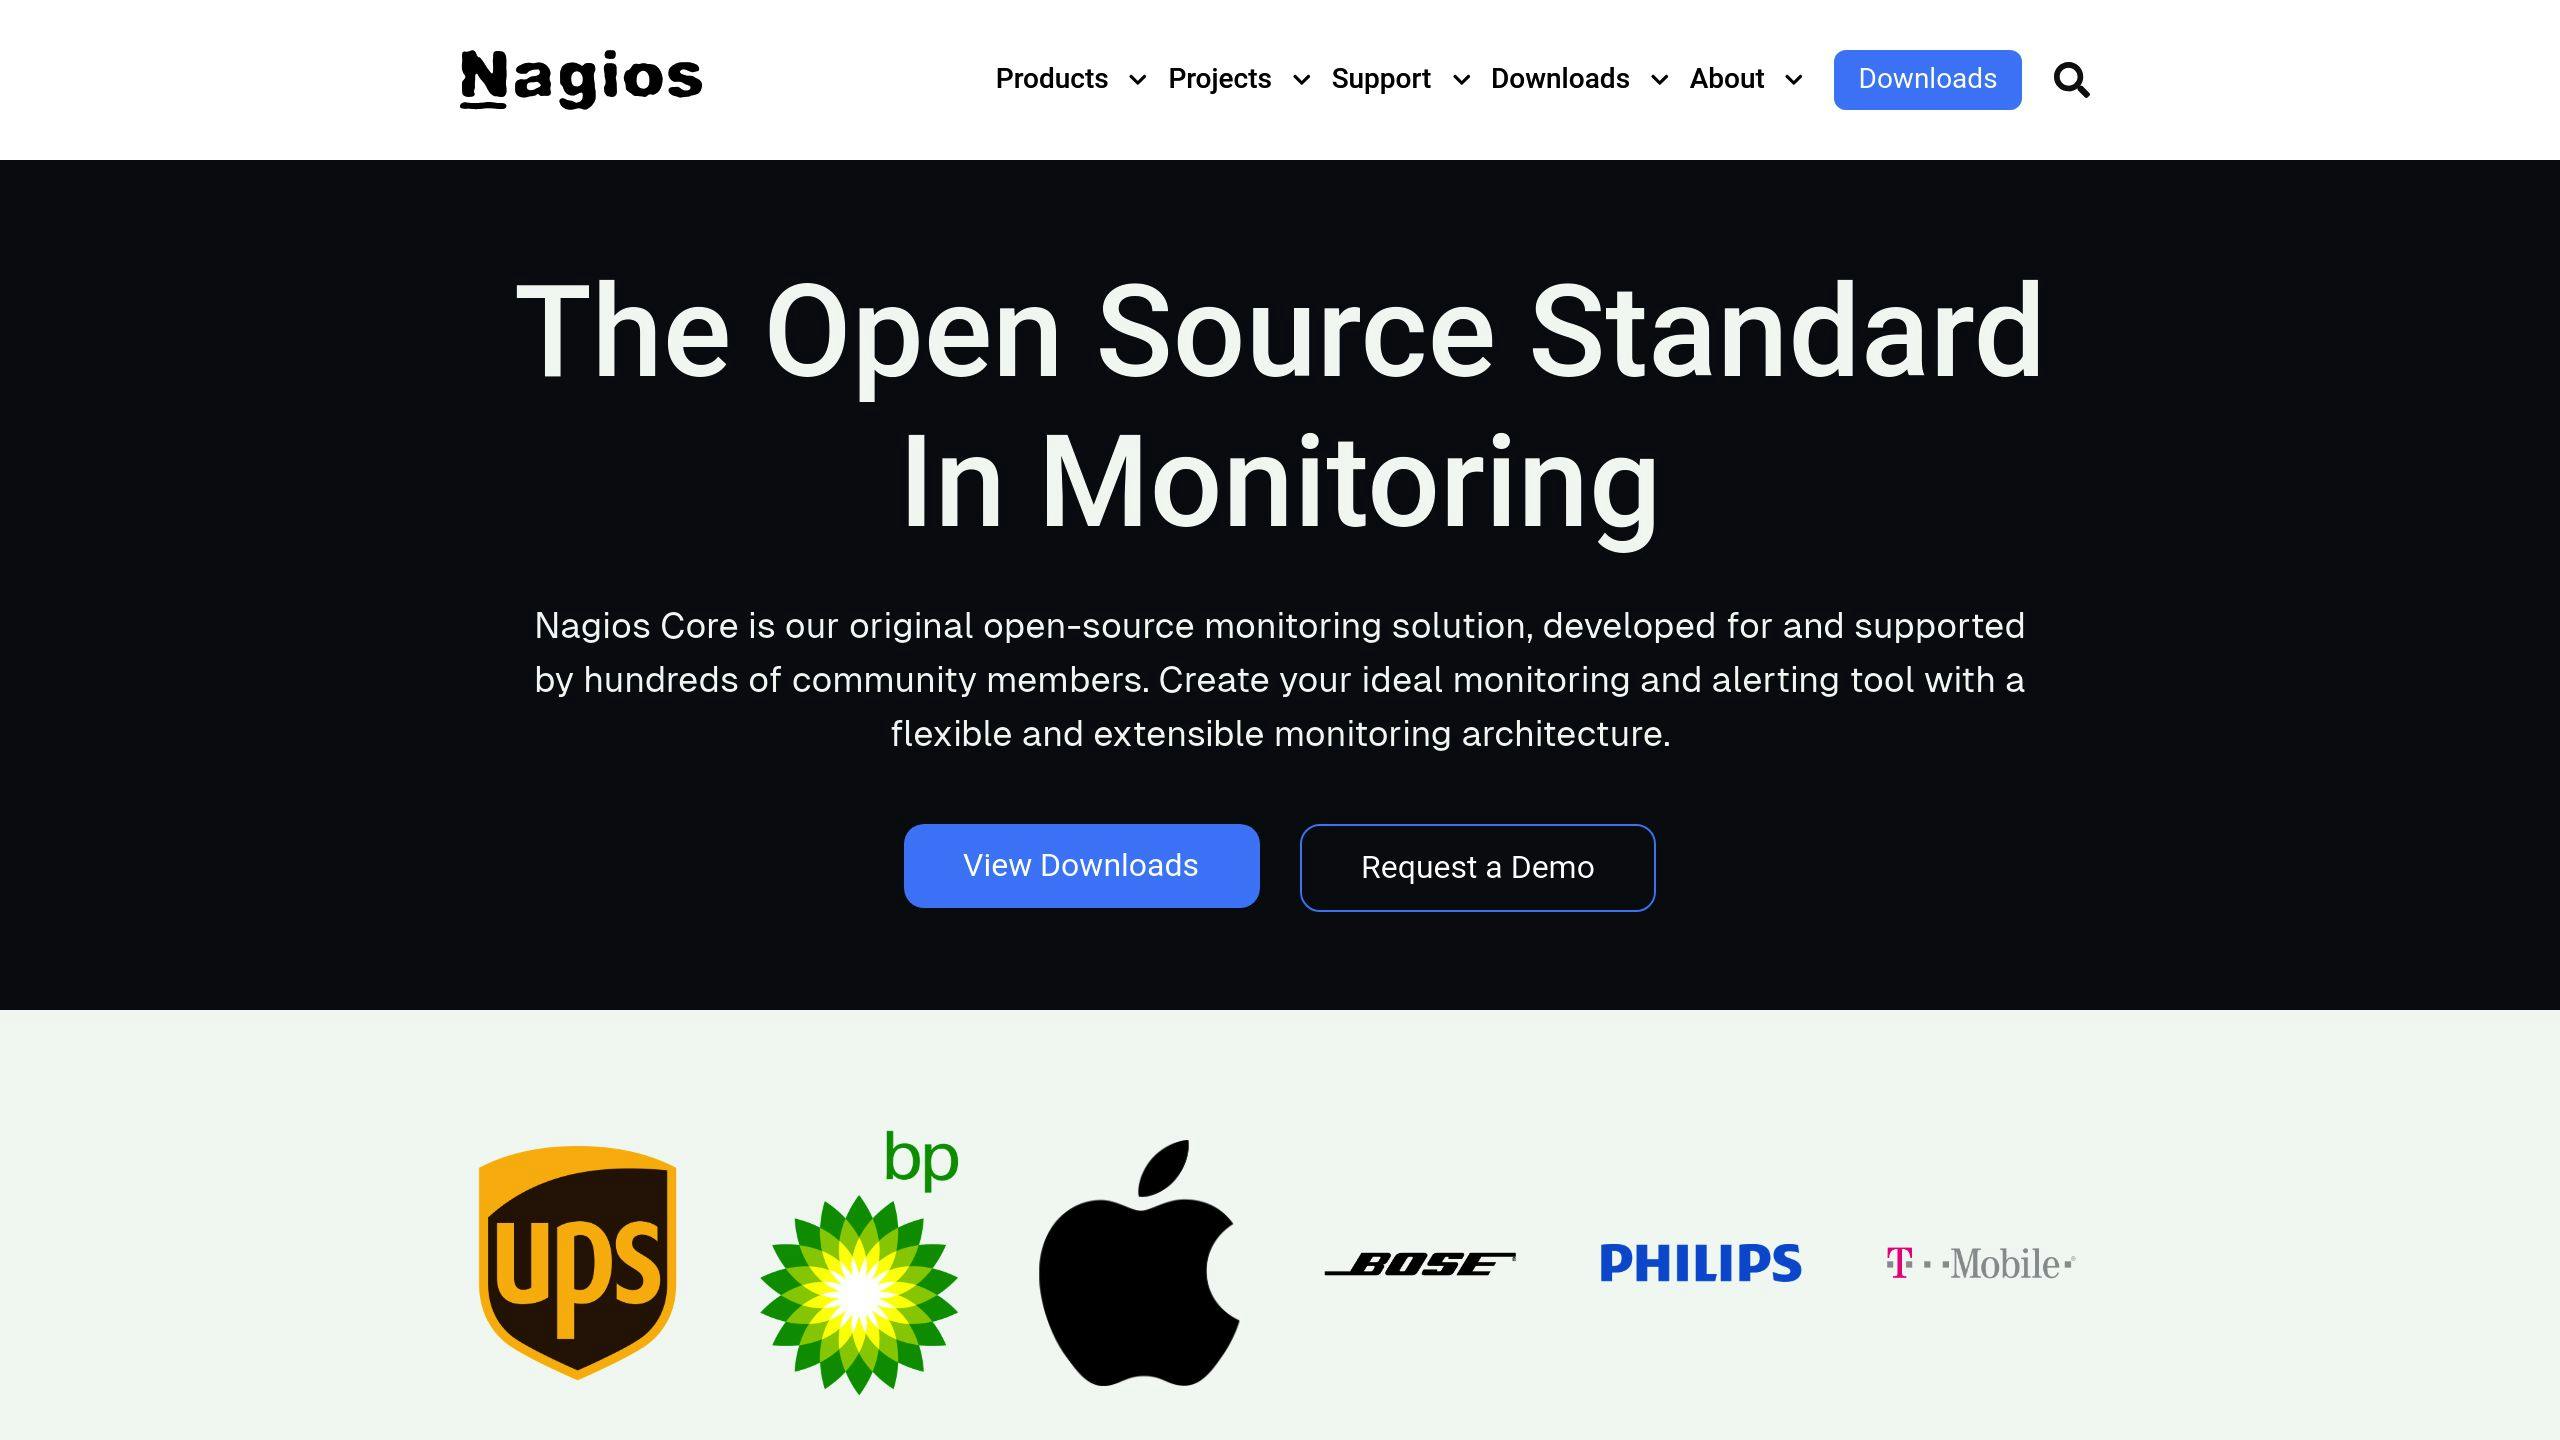
Nagios is a well-established open-source monitoring system that has been a staple in IT infrastructure monitoring since 2007. It offers a comprehensive suite of products for monitoring networks, servers, applications, and services.
Nagios comes in two main versions:
- Nagios Core: Free, open-source version
- Nagios XI: Commercial version with advanced features
The key strength of Nagios lies in its flexibility and extensive plugin ecosystem. Users can write custom plugins in any programming language, allowing for monitoring of virtually any IT component.
Here's a comparison of Nagios and Datadog:
| Feature | Nagios | Datadog |
|---|---|---|
| Pricing | Free (Core), Paid (XI) | Subscription-based |
| Deployment | Self-hosted | SaaS |
| Scalability | Up to 100,000 hosts | Highly scalable |
| User Interface | Traditional (Core), Modern (XI) | Modern, intuitive |
| Learning Curve | Steeper | More user-friendly |
| Customization | Highly customizable | Less flexible |
Nagios uses a client-server architecture, with the Nagios server running on the host and plugins operating on remote hosts. This setup allows for monitoring various network services such as SMTP, HTTP, FTP, POP, SNMP, and SSH.
One of Nagios' standout features is its alerting system. It sends immediate notifications when issues are detected, allowing IT teams to address problems quickly. For example, if a server's CPU usage spikes above a set threshold, Nagios can send an alert via email or SMS to the appropriate team member.
However, Nagios does have some limitations. Its architecture can face challenges in processing data in highly scalable environments, which is where Datadog might have an advantage. Additionally, while Datadog offers a more modern and intuitive user interface, Nagios (especially the Core version) has a more traditional, command-line based interface that may require more technical expertise.
For organizations considering Nagios as a Datadog alternative, it's important to weigh the trade-offs:
- Cost: While Nagios Core is free, self-hosting can be expensive in terms of infrastructure and maintenance.
- Customization: Nagios offers more flexibility in terms of custom checks and plugins.
- Technical expertise: Nagios requires more technical knowledge to set up and maintain compared to Datadog's more user-friendly approach.
In terms of market share, Nagios has a smaller footprint compared to Datadog. As of 2023, Nagios XI holds a 0.33% market share in the IT, Server, and Network Monitoring category, with about 350 customers. In contrast, Datadog leads the market with a 63.02% share and approximately 67,700 customers.
Despite this difference in market share, Nagios remains a solid choice for organizations that prioritize customization and have the technical resources to manage a self-hosted solution. Its long-standing presence in the industry and large community contribute to its reliability and continuous improvement.
11. LogicMonitor
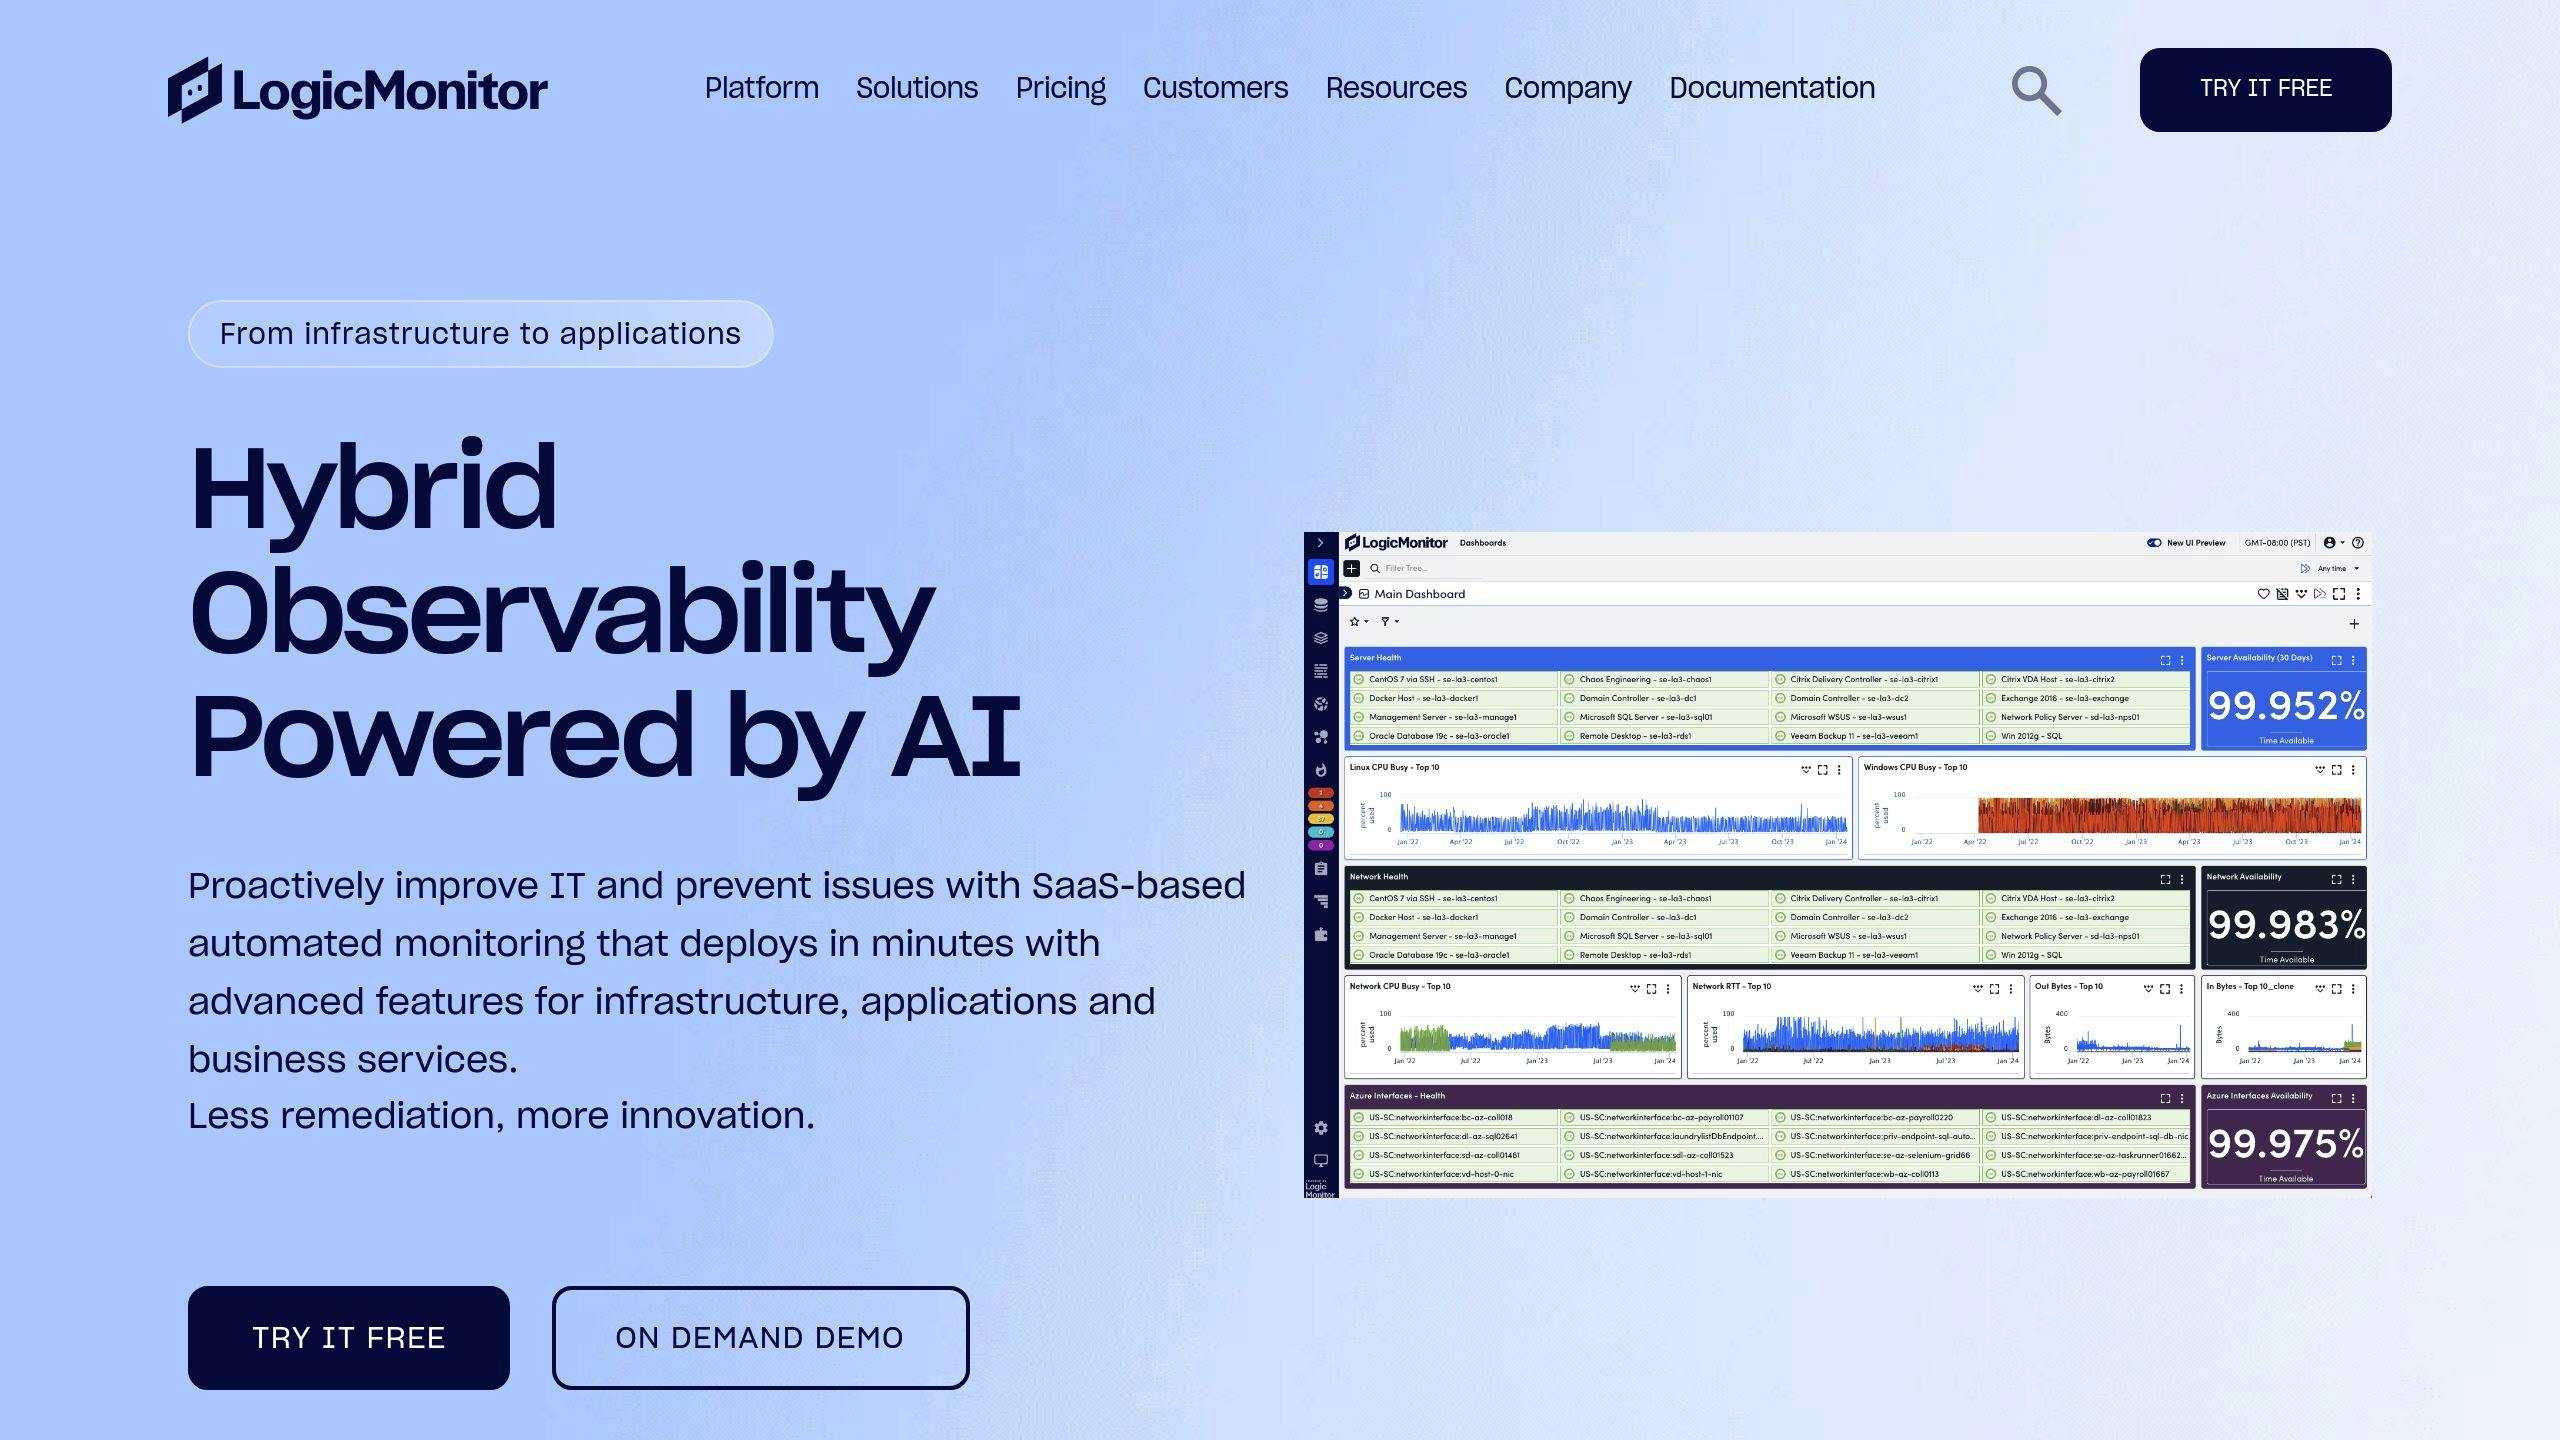
LogicMonitor offers a SaaS-based automated monitoring platform that deploys quickly and covers infrastructure, applications, and business services. The platform stands out for its rapid implementation and wide-ranging capabilities.
Key features of LogicMonitor include:
- Real-time monitoring and alerting
- Performance analysis
- Multi-cloud management
- AIOps for anomaly detection and root cause analysis
LogicMonitor's platform supports over 3000 integrations with various devices, technologies, and services, making it a versatile choice for diverse IT environments.
Here's how LogicMonitor compares to Datadog in key areas:
| Feature | LogicMonitor | Datadog |
|---|---|---|
| Deployment | SaaS or on-premise | SaaS |
| Pricing Model | Consumption-based | Subscription-based |
| Integration Count | 3000+ | 500+ |
| AIOps Capabilities | Yes | Yes |
| Data Retention | Up to 2 years (Enterprise plan) | Up to 15 months |
LogicMonitor has proven effective for various organizations. For example:
- Coca-Cola Bottling Consolidated improved efficiency and customer satisfaction by enhancing network visibility.
- Schneider Electric consolidated its monitoring tools by 83% after implementation.
- Carrier reduced Mean Time to Recovery (MTTR) and improved visibility into hybrid infrastructure.
The platform's user satisfaction rates are high across key features:
- Performance Monitoring: 89% (224 reviews)
- Alerting: 89% (232 reviews)
- Multi-Site Monitoring: 89% (190 reviews)
- Real-Time Monitoring: 86% (180 reviews)
LogicMonitor claims to provide 90% less alert noise and a 46% reduction in MTTR, which can lead to more efficient IT operations.
"As a support resource, I don't need to use multiple platforms to connect to a device to further investigate the issue. It is all consolidated. From that perspective, it saves time because a resource now only needs to use one platform." - Valentine C., Technical Service Delivery Manager at Sparx Solutions
While LogicMonitor offers many benefits, it's worth noting that pricing details are not publicly available, and users must contact sales for a quote. The platform is suitable for enterprise-grade IT operations and can be a strong alternative to Datadog, especially for organizations looking for comprehensive monitoring in hybrid environments.
12. SigNoz
SigNoz is an open-source performance monitoring tool that's gaining traction as a Datadog alternative. It offers a unified platform for application performance monitoring (APM), logs, traces, metrics, exceptions, and alerts.
Key features of SigNoz include:
- Distributed tracing
- Log management
- Customizable dashboards
- Integration with 50+ data sources
- OpenTelemetry-powered observability
SigNoz stands out for its ability to handle large-scale data ingestion, with a proven track record of processing over 10TB of data per day. This makes it suitable for both startups and large enterprises.
Here's how SigNoz compares to Datadog in key areas:
| Feature | SigNoz | Datadog |
|---|---|---|
| Deployment | Self-hosted or cloud | SaaS |
| Pricing Model | Usage-based | Subscription-based |
| Data Retention | Customizable | Up to 15 months |
| Open-source | Yes | No |
| GitHub Stars | 18,000+ | N/A |
SigNoz's pricing structure differs from Datadog's, offering more flexibility:
- No user-based pricing
- No host-based pricing
- $0.3 per GB of ingested traces
- $0.1 per million samples for custom metrics
For organizations concerned about data privacy and vendor lock-in, SigNoz provides an advantage with its self-hosting option and use of OpenTelemetry standards.
While SigNoz is a newer player in the market, it's quickly gaining popularity. Founded in 2021, the company has already achieved:
- Over 10 million open-source software downloads
- A community of 1,800+ members on Slack
- Contributions from 80+ developers across its repositories
SigNoz's user interface, built with ReactJS and TypeScript, offers features like:
- Out-of-box charts for key application metrics
- Advanced filtering options for trace data
- Detailed flamegraphs and Gantt charts for issue analysis
However, it's worth noting that SigNoz is still evolving. Some users have reported challenges with resource requirements and stability in earlier versions. As one user noted:
"I had to run SigNoz on a t2.