Looking for a Datadog alternative? Here's a quick rundown of the top 10 options:
- Dynatrace: AI-powered analysis, full-stack observability
- LogicMonitor: Hybrid infrastructure monitoring
- New Relic: 100GB free data ingestion per month
- Splunk: Powerful log management and SIEM
- AppDynamics: Enterprise-grade APM solution
- Zabbix: Open-source, highly customizable
- SolarWinds: Comprehensive IT management suite
- Instana: Automated monitoring for microservices
- Prometheus: Open-source, cloud-native monitoring
- Better Stack: User-friendly interface, uptime monitoring
Related video from YouTube
Quick Comparison
| Tool | Starting Price | Key Feature | Target Users |
|---|---|---|---|
| Dynatrace | $69/month (8GB/host) | AI-powered insights | Enterprises |
| LogicMonitor | Custom pricing | 2,000+ integrations | Mid-market |
| New Relic | Free for <100GB/month | 750+ integrations | Mid-market |
| Splunk | Custom pricing | On-premises/cloud deployment | Mid-market, enterprise |
| AppDynamics | $60/month per CPU core | User experience monitoring | Enterprises |
| Zabbix | Free (paid support available) | Highly customizable | All sizes |
| SolarWinds | Custom pricing | Comprehensive IT suite | Mid-market, enterprise |
| Instana | $75/host/month (SaaS) | Automated microservices monitoring | Mid-market, enterprise |
| Prometheus | Free | Cloud-native monitoring | All sizes |
| Better Stack | $24/month | User-friendly interface | Startups, growing businesses |
Each tool has its strengths. Consider your specific needs, budget, and technical capabilities when choosing. Take advantage of free trials to test before committing.
What is Datadog?
Datadog is a cloud-based monitoring platform that helps companies keep their IT infrastructure and applications running smoothly. It offers real-time insights into complex IT environments, allowing organizations to monitor their entire technology stack, including servers, databases, cloud services, and applications.
Key features of Datadog include:
- Real-time performance monitoring
- Customizable dashboards
- Alerts and notifications
- Log management
- Application Performance Management (APM)
- Integration capabilities with various services and platforms
Datadog's strength lies in its ability to provide a unified view of system performance across diverse technology stacks. This makes it a popular choice for larger enterprises with complex IT environments.
However, Datadog has some notable drawbacks:
| Pros | Cons |
|---|---|
| Comprehensive monitoring suite | Complex pricing structure |
| Extensive integration options | Potentially high costs |
| User-friendly interface | Unpredictable billing |
| Real-time insights | Aggressive sales tactics |
One of the main issues users face with Datadog is its complex and often unpredictable pricing model. For example, custom metrics can account for up to 52% of the total bill, which has led to significant concerns among users.
A cryptocurrency company reported being charged $65 million USD, highlighting the potential for unexpected costs. This has prompted many organizations, especially small and medium-sized enterprises, to seek alternatives with more transparent and predictable pricing.
"We could not fully evaluate DataDog because they charged us for 50 hosts inadvertently sending metrics for 2 days out of the month. This was our mistake - we accidentally deployed the DataDog agent to an entire tier, not realizing this would incur charges. We rolled this back when we discovered the issue."
This user experience underscores the need for careful planning and monitoring when using Datadog, as even small mistakes can lead to significant charges.
Despite these challenges, Datadog remains a powerful tool for organizations that can afford it and have the resources to manage its complexity. Its ability to handle millions of data points per second and provide detailed insights across various IT components makes it a top choice for many large enterprises.
How to choose a monitoring tool
When looking for a Datadog alternative, focus on features that match your needs:
Real-time monitoring
Pick a tool that gives you up-to-the-minute data. This helps you spot and fix issues fast.
Scalability
Your monitoring tool should grow with your business. Make sure it can handle more devices and data as you expand.
User-friendly interface
A clear, easy-to-use dashboard saves time and reduces errors. Look for tools with intuitive designs.
Customizable alerts
You want to know about problems right away. Choose a tool that lets you set up alerts that fit your needs.
Integration capabilities
Your new tool should work well with your current systems. Check if it connects with the apps and services you use.
Pricing transparency
Avoid surprises on your bill. Look for tools with clear, predictable pricing.
| Feature | Why it matters |
|---|---|
| Real-time monitoring | Spot issues quickly |
| Scalability | Grows with your business |
| User-friendly interface | Saves time, reduces errors |
| Customizable alerts | Stay informed about critical issues |
| Integration capabilities | Works with your existing tools |
| Pricing transparency | Avoid unexpected costs |
Consider open-source options
Open-source tools can offer more flexibility and control. They also help you avoid vendor lock-in.
Try before you buy
Many tools offer free trials. Use them to test features and see if the tool fits your needs.
"The implementation of New Relic surpassed our initial expectations, streamlining the execution of our observability project and accelerating our project timeline."
This quote from a New Relic user shows how the right tool can improve your workflow.
1. Dynatrace

Dynatrace stands out as a top Datadog alternative, offering a comprehensive observability platform that simplifies cloud environment complexity. The platform combines deep observability, AI, automation, and application security into a single solution.
Key features of Dynatrace include:
- OneAgent: Automatically collects data across your setup after installation
- Davis®: AI engine that provides root cause analysis and issue detection
- Smartscape: Dynamic topology mapping
- PurePath: Distributed tracing and code-level analysis
Dynatrace's performance in the industry is noteworthy:
| Gartner Use Case | Score |
|---|---|
| Application Health and Performance Monitoring | 4.27/5 |
| Hybrid Infrastructure Platform Operations | 4.25/5 |
| Business Insights | 4.22/5 |
These scores positioned Dynatrace as the top-ranked platform in three out of five use cases in the 2024 Gartner Critical Capabilities for Observability Platforms report.
Steve Tack, EVP and Chief Product Officer at Dynatrace, explains:
"Advanced AI-powered observability and security, analytics, and automation have become mandatory to harness the complexity generated by modern digital ecosystems."
Dynatrace's pricing starts at $0.04 per hour for any size host for cloud infrastructure monitoring. This model allows for easier scaling and cost management compared to some competitors.
For IT teams looking to improve their monitoring capabilities, Dynatrace offers:
- Real-time application performance monitoring
- Automated problem resolution
- AI-driven insights for large-scale environments
A real-world example of Dynatrace's impact comes from BT. Alex Bell, Chief Architect at BT, shared:
"We identified three key phases for our transformation at BT. First, we needed to transform digital operations to modernize our processes and services, driven by the move to the cloud. Second, we wanted to embrace AIOps to automate issue detection and analysis, so we could overcome the complexity of a modern operating environment."
Dynatrace's platform helped BT achieve these goals, showcasing its ability to handle complex, large-scale environments effectively.
When comparing Dynatrace to Datadog, Dynatrace excels in AI-driven insights and robust infrastructure monitoring, particularly for large-scale setups. However, Datadog is often noted for its user-friendly interface and ease of use.
For teams considering Dynatrace, it's worth noting its strong position in the market. The company was named a Leader in the 2024 Gartner Magic Quadrant for Observability Platforms, positioned furthest for Completeness of Vision and highest for Ability to Execute among 17 evaluated vendors.
2. LogicMonitor
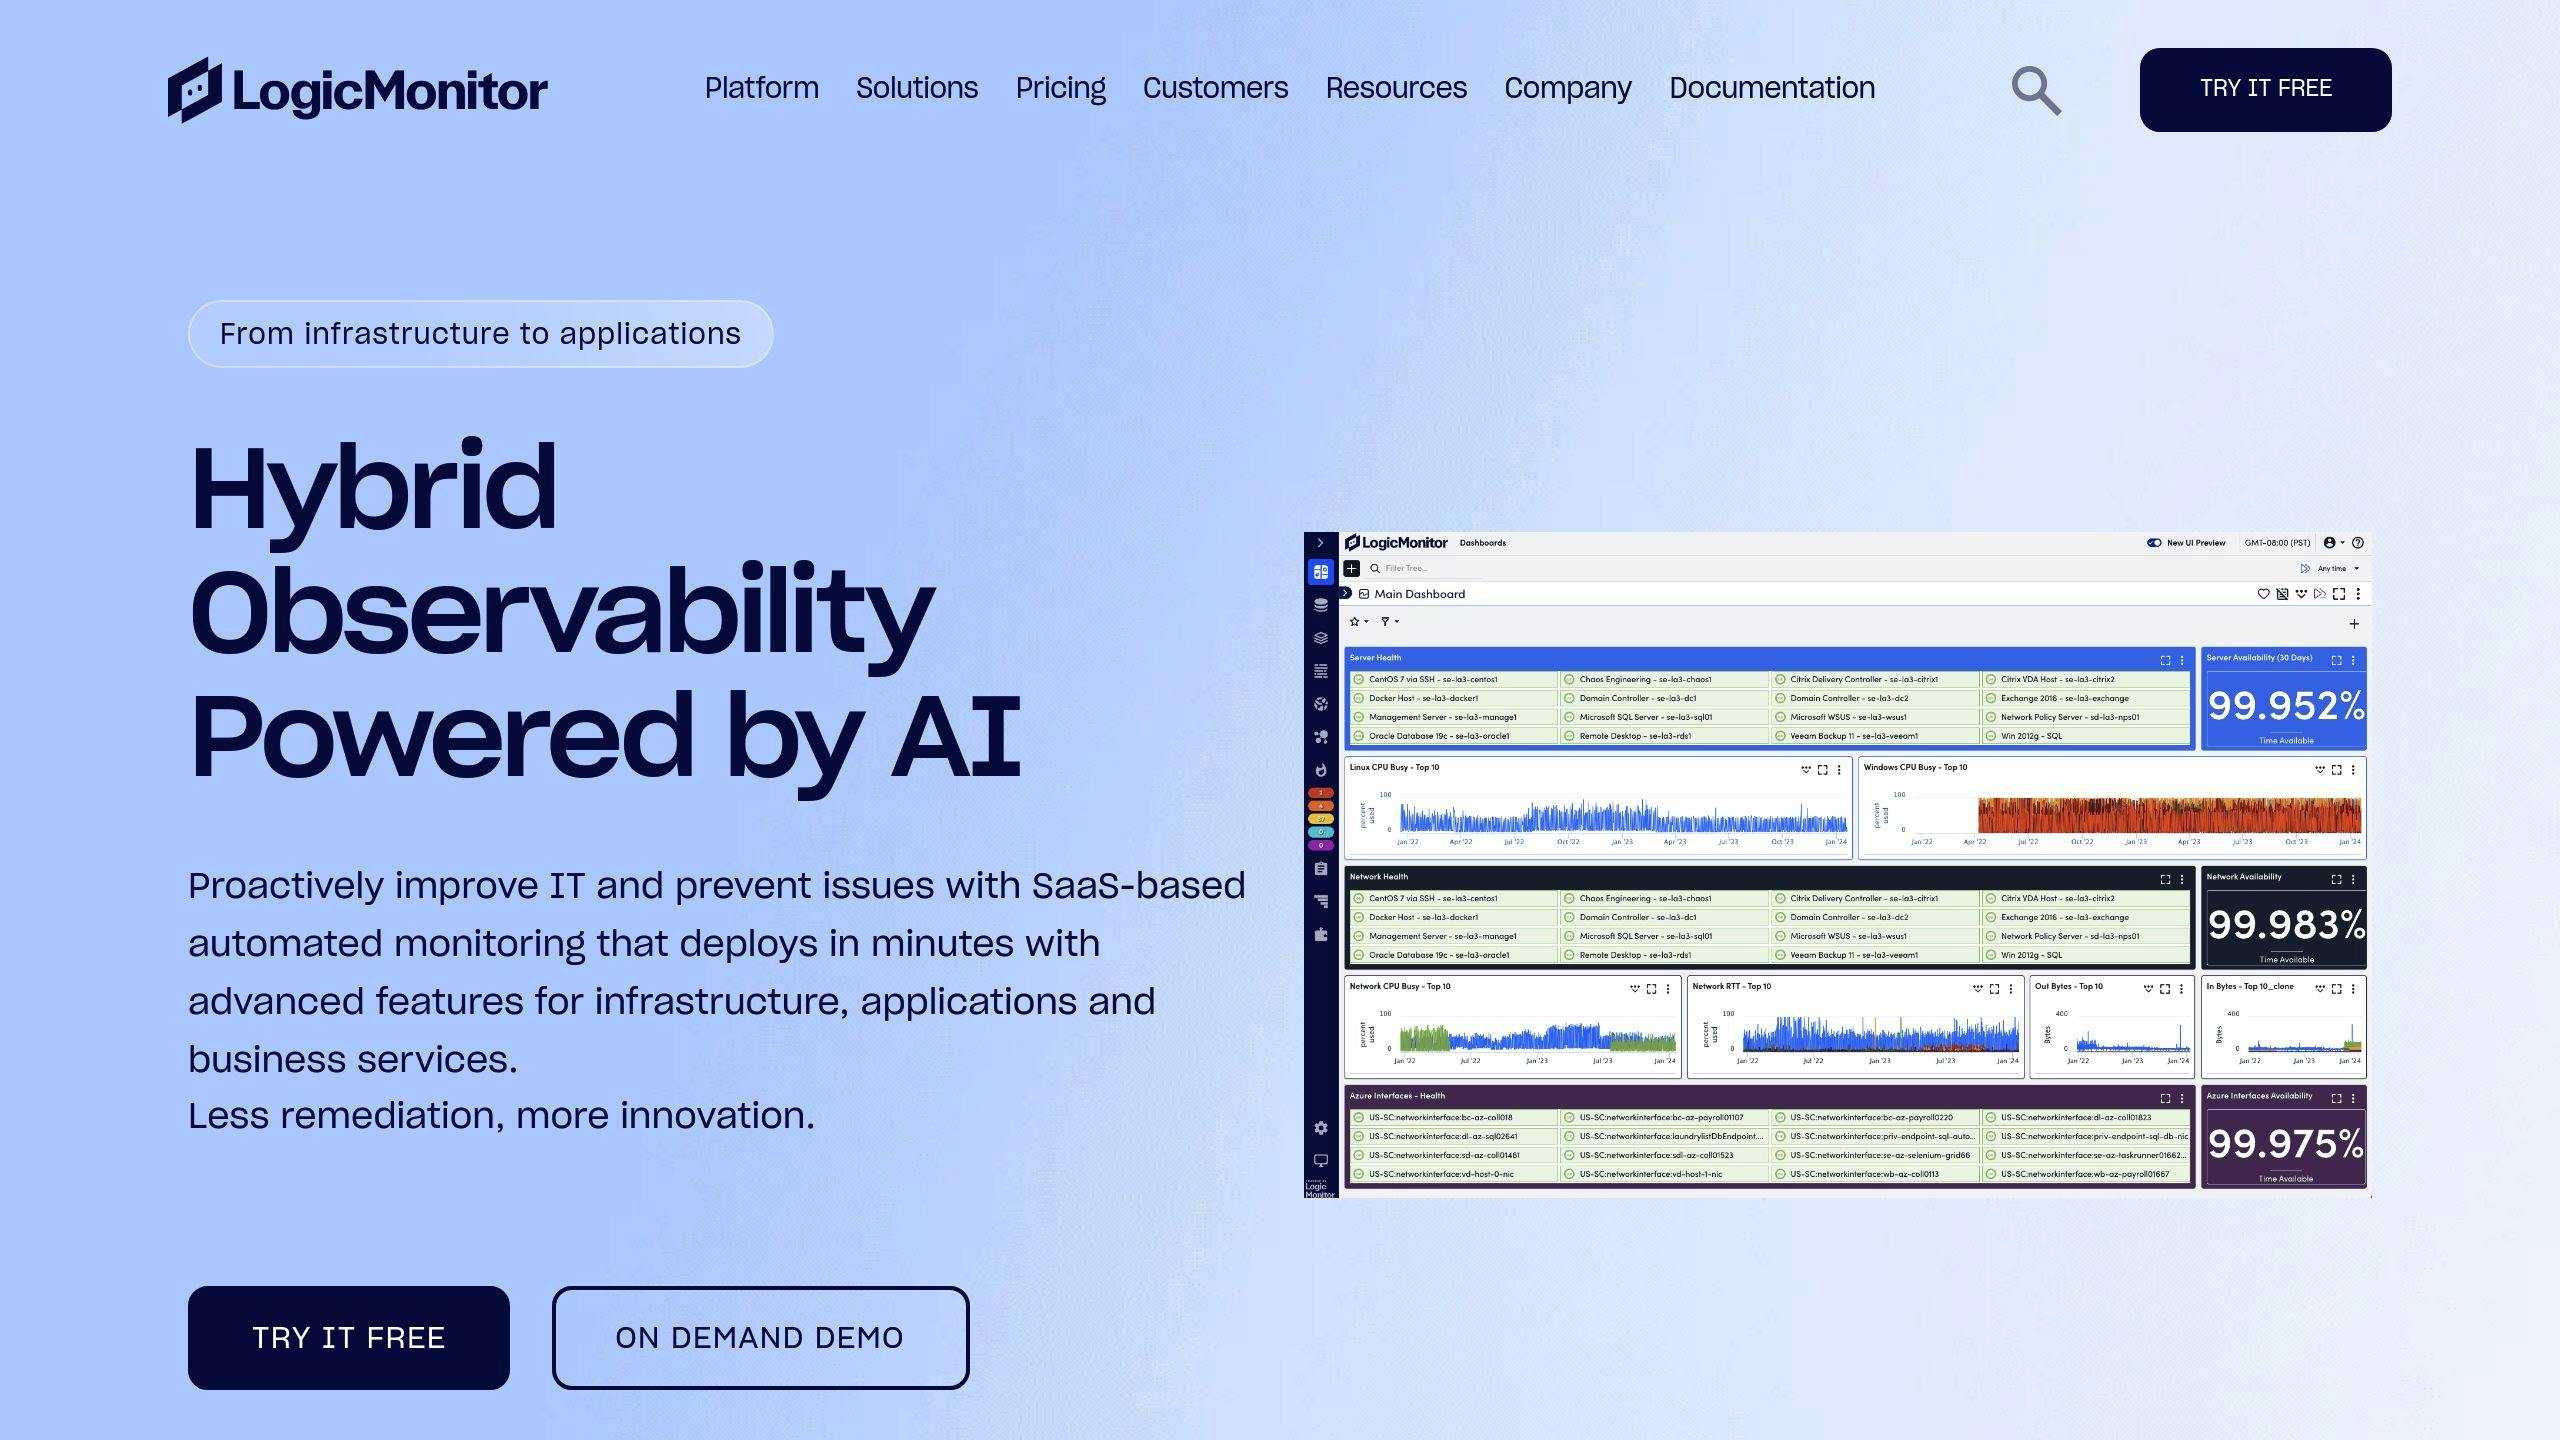
LogicMonitor offers a robust IT Infrastructure Management (ITIM) solution that caters to businesses of all sizes. This SaaS-based platform provides comprehensive monitoring capabilities for cloud environments, networks, and applications.
Key features of LogicMonitor include:
- Hybrid monitoring for on-premises, cloud, and hybrid setups
- ActiveDiscovery for automatic identification and setup of IT processes
- Extensive integration catalog with over 2,000 options
- AIOps capabilities for anomaly detection and root cause analysis
- Customizable dashboards and alerting
LogicMonitor's pricing is quote-based, with two main tiers:
| Plan | Features | Data Retention |
|---|---|---|
| Pro | Most monitoring options, 2000+ integrations | 1 year |
| Enterprise | Additional features (AIOps, etc.) | 2 years |
For IT teams looking to improve their monitoring capabilities, LogicMonitor offers:
- Real-time alerting with visible metrics in less than one second
- High cardinality analytics for precise error identification
- Automated topology and dependency mapping
- Support for various programming languages in code profiling
While LogicMonitor has gained traction in the market, it's worth noting its position compared to Datadog:
| Metric | LogicMonitor | Datadog |
|---|---|---|
| Market Share | 0.64% | 63.02% |
| Customer Base | 685 | 67,700 |
Despite the gap, LogicMonitor has carved out a niche, particularly among Managed Service Providers (MSPs) and enterprise IT teams. Its agentless monitoring approach and focus on automation make it a strong contender for businesses with complex IT environments.
A user from the information technology sector shared their experience:
"LogicMonitor offers real-time alerting and it's quickly deployed and integrated into any of the systems."
For teams considering LogicMonitor, it's important to weigh its strengths in comprehensive monitoring and integration capabilities against factors like pricing and market position when comparing it to alternatives like Datadog.
3. New Relic
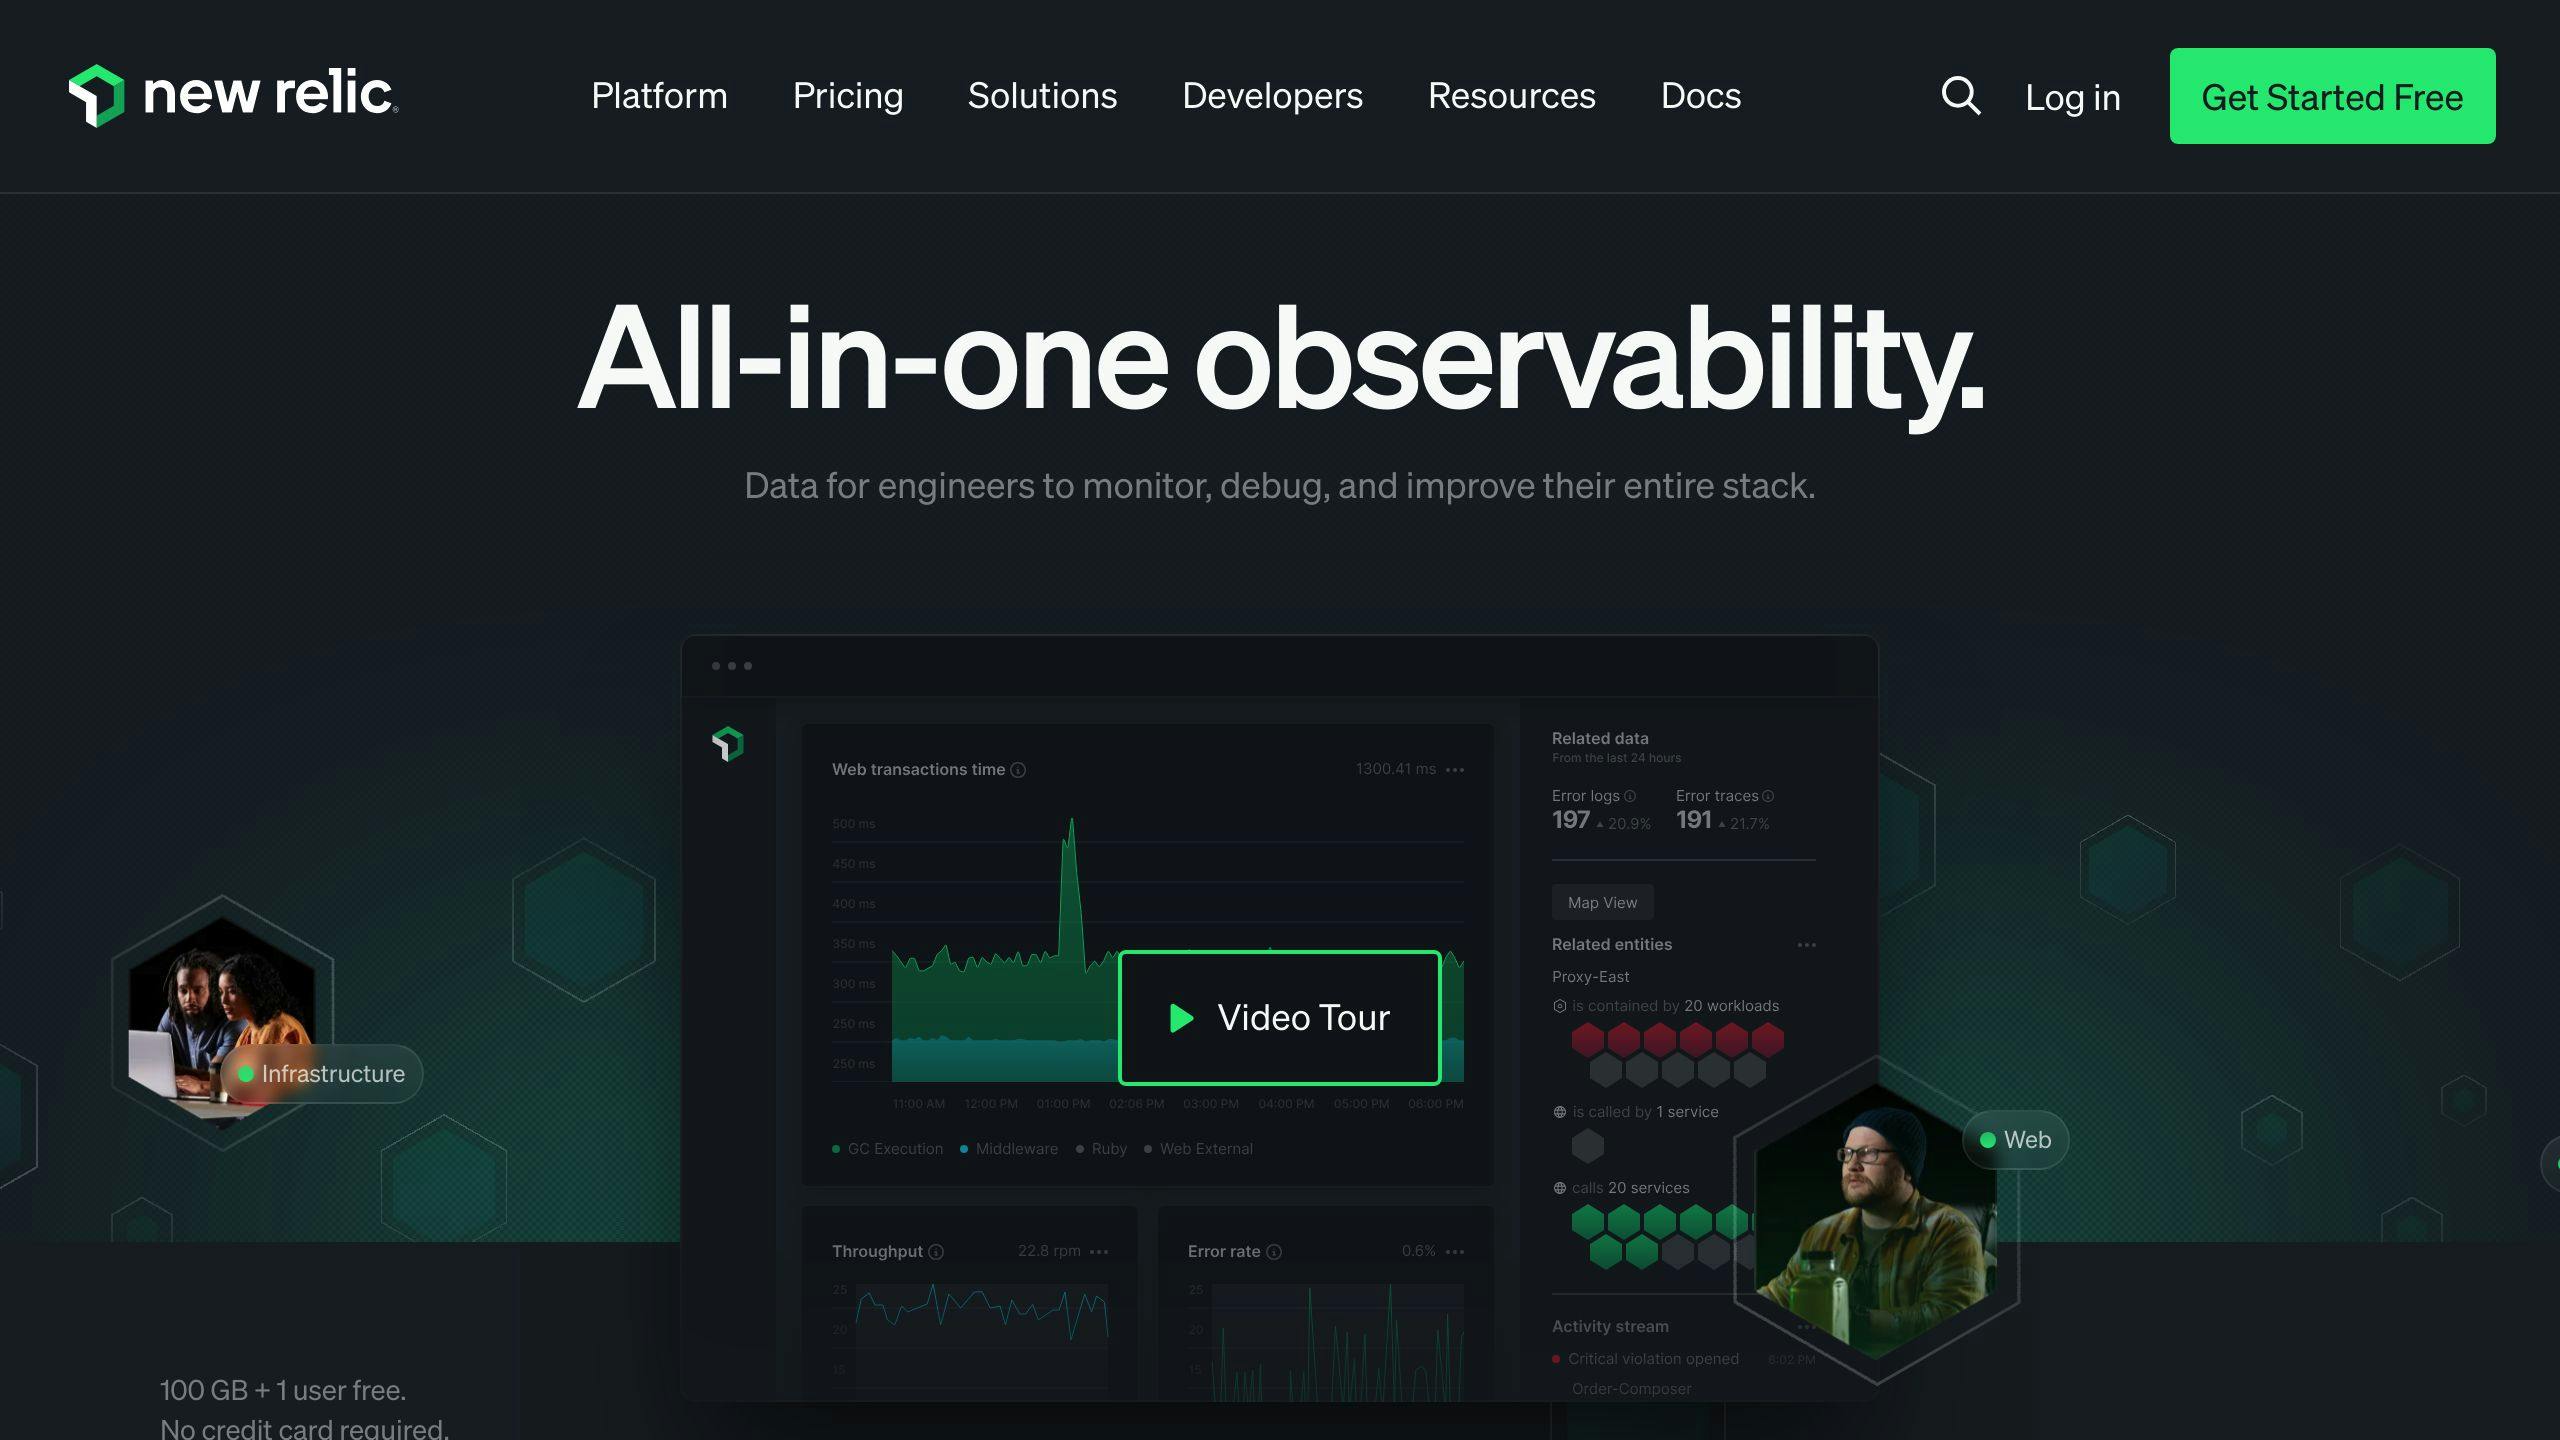
New Relic is a powerful observability platform that offers a wide range of monitoring tools for businesses of all sizes. It stands out as a strong Datadog alternative, particularly for companies focused on application performance monitoring (APM) and AI-driven insights.
Key features of New Relic include:
- Full-stack observability with 30+ tools in one platform
- 750+ integrations across popular tools and services
- AI monitoring capabilities with over 60 integrations
- Predictable usage-based pricing model
New Relic's pricing structure is designed to be more cost-effective than some competitors:
| Feature | New Relic | Datadog |
|---|---|---|
| Free tier | 100 GB/month | 14-day trial |
| Containers | Unlimited per host | Additional cost |
| Log retention | 30 days included | Extra charge |
| Overage fees | None | +50% premium |
For teams looking to improve their monitoring setup, New Relic offers:
- Auto-instrumentation for quick setup across frameworks like OpenAI and AWS Bedrock
- Real-time user feedback integration for AI applications
- Advanced alerting system with multiple escalation levels
A notable advantage of New Relic is its AI-powered incident response tool. This feature uses machine learning to detect and respond to issues automatically, helping teams address problems before they become critical.
New Relic's Chief Customer Officer, Arnie Lopez, highlights the growing importance of AI in business operations:
"Based on my conversations with CIOs, CTOs, and executives across our customer base, it is clear that every company is thinking about how to scale their business with AI."
When comparing New Relic to Datadog, consider these factors:
| Aspect | New Relic | Datadog |
|---|---|---|
| APM focus | Strong | Needs other products |
| Integrations | 750+ | 600+ |
| UI/UX | Modern, intuitive | Complex |
| Pricing model | Usage-based | Pay per GB |
For businesses weighing their options, New Relic's combination of comprehensive monitoring tools, AI capabilities, and flexible pricing make it a compelling choice in the observability market.
4. Splunk
Splunk stands out as a robust alternative to Datadog, offering a wide range of monitoring and analytics capabilities. It's designed to handle massive volumes of machine-generated data, making it a go-to choice for large enterprises with complex IT infrastructures.
Splunk's key strengths include:
- Real-time data analysis: Splunk indexes and searches log files within a system, providing instant insights.
- Flexible data ingestion: It can process data from various sources, including cloud services, applications, and devices.
- Advanced security features: Splunk offers built-in Security Information and Event Management (SIEM) capabilities.
For organizations considering Splunk, here's a quick comparison with Datadog:
| Feature | Splunk | Datadog |
|---|---|---|
| Focus | Big data analytics | Cloud monitoring |
| Pricing model | Workload & Ingest based | Host & feature based |
| Learning curve | Steeper | Moderate |
| Integration count | 2000+ | 600+ |
Splunk's pricing can be higher than Datadog's, especially for large-scale deployments. For example, Splunk Cloud pricing for a team of 200 ranges from $17,700 to $35,800 per year, while larger teams (1000+) can expect to pay between $50,300 and $101,500 annually.
One of Splunk's standout features is its ability to create custom dashboards and reports. Users can schedule reports to perform actions automatically, such as emailing results to stakeholders. This level of automation can save significant time for IT teams.
A real-world example of Splunk's impact comes from a Hong Kong-based financial services group. By implementing Splunk's cloud-based SIEM system, they standardized security across international branches. This move allowed them to set up in-country SIEM systems within a month, a process that previously took several months.
While Splunk offers powerful features, it's worth noting that implementation can be complex. As one user stated:
"It saves user hours on ingesting new feeds, parsing, and searching. Cost is high as you pull in more log sources."
For businesses weighing their options, Splunk is best suited for those needing comprehensive security and IT management capabilities, and who have the budget and resources for a more complex setup.
sbb-itb-9890dba
5. AppDynamics

AppDynamics offers a full-stack observability platform for application performance monitoring (APM). It's designed to help businesses monitor, automate, and analyze every business transaction.
Key features of AppDynamics include:
- Real-time stream processing
- Distributed transaction tracing
- Custom dashboards
- Anomaly detection
- Root cause analysis
- Application security monitoring
AppDynamics stands out with its ability to handle complex, distributed applications. It's particularly useful for businesses with hybrid environments, including monoliths, SOA, and microservice-based architectures.
Here's how AppDynamics compares to Datadog:
| Feature | AppDynamics | Datadog |
|---|---|---|
| Installation | More involved, requires agents on servers | Simpler setup |
| Legacy tech support | Better support for mainframes, SAP | Limited |
| Integration ecosystem | More limited | Broader range |
| Pricing model | Traditional licensing (per agent/server) | Flexible (based on data volume) |
AppDynamics recently added AI features to enhance its capabilities. Ronak Desai, Senior Vice President and General Manager of Cisco AppDynamics and Full-Stack Observability, stated:
"Customers can now use this virtual appliance together with our Smart Agent capability to deploy new innovations faster and simplify lifecycle operations."
This new virtual appliance allows for faster deployment of innovations and simplifies lifecycle operations. It's packaged for deployment in VMware vSphere Open Virtual Format (OVA) and will soon support other virtualization platforms.
For businesses considering AppDynamics, here are some practical tips:
- Use the instrumentation feature to collect data from your applications.
- Set up health rules and alerts on infrastructure metrics for proactive monitoring.
- Utilize the dashboard generator to create custom views for monitoring SAP systems and processes.
- Take advantage of the integration with Cisco's Secure Application package for monitoring application vulnerabilities.
AppDynamics pricing starts at $3,300 per year, with a free trial available. They offer several custom pricing plans:
- APM Pro Custom: Includes health rules and alerting policies
- APM Advanced Custom: Adds server and network performance visibility
- APM Peak Custom: Includes transaction analytics and business metrics tracking
While AppDynamics offers powerful features, it's worth noting that the installation process is more complex compared to some alternatives. However, for organizations with complex hybrid applications or those relying on specialized technologies, AppDynamics can provide better visibility and monitoring capabilities.
6. Zabbix
Zabbix is an open-source monitoring solution that offers a cost-effective alternative to Datadog. It's designed to monitor networks, servers, cloud services, and applications in real-time.
Key features of Zabbix include:
- High-performance monitoring of thousands of devices
- Rich visualization tools (graphs, maps, screens)
- Flexible alerting system
- Centralized data storage in a relational database
Zabbix stands out with its ability to handle large-scale environments. For example, Zabbix 6.0 LTS supports monitoring of over 100,000 business services, making it suitable for enterprise-level deployments.
Here's how Zabbix compares to Datadog:
| Feature | Zabbix | Datadog |
|---|---|---|
| Deployment | On-premises or cloud | Cloud-based SaaS |
| Installation | Requires Linux server | Agent-based, no server needed |
| Customization | Highly customizable, coding required | Drag-and-drop widgets |
| Pricing | Free, pay for support only | Usage-based pricing |
| Learning curve | Steeper | More user-friendly |
Zabbix's open-source nature allows for extensive customization. However, this comes with a trade-off: it requires more technical expertise to set up and maintain compared to Datadog.
For businesses considering Zabbix, here are some practical tips:
- Use templates: Zabbix offers pre-configured templates for monitoring various systems, saving time on setup.
- Leverage auto-discovery: Set up network discovery rules to automatically add new devices to your monitoring system.
- Implement distributed monitoring: For large environments, use Zabbix proxies to distribute the monitoring load.
- Customize dashboards: Create tailored views of your infrastructure using Zabbix's visualization tools.
Zabbix is completely free to use, with costs only for technical support if needed. This makes it an attractive option for budget-conscious organizations or those who prefer to have full control over their monitoring infrastructure.
While Zabbix offers powerful features, it's worth noting that the setup process is more complex compared to some cloud-based alternatives. However, for organizations with the technical resources to manage it, Zabbix can provide a highly customizable and cost-effective monitoring solution.
7. SolarWinds

SolarWinds offers a range of IT management and monitoring tools that serve as a strong alternative to Datadog. Their Network Performance Monitor (NPM) stands out for its ability to detect, diagnose, and resolve network performance issues quickly.
Key features of SolarWinds NPM include:
- Multi-vendor network monitoring
- Network Insights for deeper visibility
- Intelligent mapping
- NetPath and PerfStack for troubleshooting
- Advanced alerting and critical path visualization
SolarWinds NPM can be deployed in the cloud or on-premises, making it flexible for different IT environments. It's particularly suited for medium to large-scale enterprises due to its scalability and comprehensive monitoring capabilities.
One of the standout features of SolarWinds is its Performance Analyzer. Andrew N., a Senior Network Engineer at Element Critical, explains its usefulness:
"The 'Performance Analyzer' feature is the solution's most valuable aspect. It's able to do the bounded graphs of all the interface stats, from errors to broadcasts and to current traffic. With a click of a button you're able to, in one interface, look at historical data for those items."
SolarWinds also excels in capacity planning and proactive management. Daniel S., Systems and Data Warehouse Supervisor at MMSD, highlights this:
"The alerting and usage tracking is a valuable feature because it alerts us when we're getting near capacity on disk space, network utilization or processor utilization. It helps us manage our capacity and enables us to be proactive."
When comparing SolarWinds to Datadog, here's how they stack up:
| Feature | SolarWinds | Datadog |
|---|---|---|
| Deployment | Cloud or on-premises | Cloud-based SaaS |
| Pricing model | License-based tiers | Usage-based pricing |
| User interface | More complex, feature-rich | User-friendly, dynamic dashboards |
| Customization | Highly customizable | Flexible integrations |
| Learning curve | Steeper | More user-friendly |
SolarWinds' pricing is based on the number of nodes, volumes, and interfaces you need to monitor. They offer various tiers, from SL100 (monitoring up to 100 elements) to SLX (unlimited monitoring).
While SolarWinds offers a wealth of features, it's worth noting that it may have a steeper learning curve compared to Datadog. However, for organizations with the technical resources to leverage its capabilities, SolarWinds can provide deep insights into network performance and help optimize IT operations.
8. Instana
Instana stands out as a strong Datadog alternative with its automated application performance monitoring (APM) capabilities. Unlike Datadog's agent-based model, Instana uses an agentless approach, simplifying implementation and reducing resource usage.
Key features of Instana include:
- Automatic application mapping
- Real-time monitoring with 1-second granularity
- AI-driven root cause analysis
- Full-stack visibility for microservices and containers
Instana's automated discovery and mapping of all services and their dependencies set it apart. This feature is particularly useful for teams managing complex, dynamic environments.
A user from a small business highlights Instana's effectiveness:
"Instana automatically tracks apps and offers distributed tracing across other microservices and components, navigates app performance, and provides real-time actionable insights for our organization."
For large enterprises, Instana's AI-powered anomaly detection proves valuable:
"The AI-powered anomaly detection is excellent, proactively finding and alerting us to new risks before they escalate."
Comparing Instana to Datadog:
| Feature | Instana | Datadog |
|---|---|---|
| Deployment | Agentless | Agent-based |
| Application Mapping | Automatic | Manual configuration |
| Data Granularity | 1-second | 15-second (standard) |
| Root Cause Analysis | AI-driven, proactive | Manual, user-defined thresholds |
| Market Share | 0.51% | Higher (exact figure not provided) |
| Customer Base | 1,845 | 621 (in APM category) |
Instana offers three pricing tiers:
- Essentials: $20 per month per Managed Virtual Server (MVS)
- Standard: $75 per month per MVS
- Self-Hosted: $93.80 per month per MVS
A free trial is available for those wanting to test Instana's capabilities.
Instana's pricing model appears to offer good value, as noted by a verified user:
"Instana is better at call tracing than the previous ones and is cost effective as well."
While Instana boasts many strengths, it's worth noting that some users report a steep learning curve, especially when configuring the system for optimal scalability. This might pose challenges for less technically experienced teams.
In the APM market, Instana ranks 8th based on customer count, while Datadog APM ranks 13th. Instana has a stronger presence in the United States, France, and Germany, whereas Datadog APM has more customers in the United States, India, and the United Kingdom.
For organizations looking to improve their monitoring capabilities, Instana offers a mix of automation, AI-driven insights, and cost-effectiveness that makes it a worthy Datadog alternative to consider.
9. Prometheus
Prometheus is an open-source monitoring system that's become a go-to choice for many DevOps teams, especially those working with Kubernetes. Originally developed by SoundCloud, Prometheus has grown into a powerful tool for collecting and analyzing metrics from various sources.
Key features of Prometheus include:
- Time-series database for storing metrics
- PromQL, a flexible query language for data analysis
- Built-in alerting system
- Pull-based model for data collection
- Integration with visualization tools like Grafana
Prometheus shines in cloud-native environments. Its ability to scrape metrics from multiple targets makes it well-suited for monitoring microservices and containerized applications.
Here's how Prometheus compares to Datadog:
| Feature | Prometheus | Datadog |
|---|---|---|
| Pricing | Free (open-source) | Paid plans starting at $15/host/month |
| Deployment | Self-hosted | SaaS |
| Setup | More complex | Easier |
| Scalability | Requires manual scaling | Automatic |
| Data retention | Limited by local storage | Long-term storage included |
| Visualization | Basic UI, often used with Grafana | Built-in dashboards |
While Prometheus is free to use, it's important to factor in the costs of hosting and maintaining the infrastructure needed to run it.
Prometheus has gained traction in the tech industry. For example, Abnormal Security faced challenges with metrics availability and scalability. They were tracking 10-12 million active metrics, projected to hit 50 million. To address this, they worked with Chronosphere to manage their Prometheus instances, resulting in improved stability and reduced costs.
When considering Prometheus as a Datadog alternative, keep these points in mind:
- Setup complexity: Prometheus requires more upfront configuration compared to Datadog's plug-and-play approach.
- Scalability: While powerful, Prometheus can be challenging to scale in large, multi-cluster environments.
- Community support: As an open-source tool, Prometheus benefits from a large community and extensive documentation.
- Integration: Prometheus works well with other open-source tools in the monitoring ecosystem, like Grafana for visualization.
Marcel Hild, Manager at Red Hat, notes:
"As IT operations become more agile and complex, at the same time the need to enhance operational efficiency and intelligence grows."
Prometheus addresses this need by providing a flexible, customizable monitoring solution that can adapt to complex IT environments.
For teams looking to move away from Datadog, Prometheus offers a cost-effective alternative with powerful capabilities. However, it's crucial to weigh the trade-offs between the flexibility of an open-source solution and the convenience of a managed service like Datadog.
10. Better Stack

Better Stack is a monitoring and incident management platform that helps teams track and manage their applications' performance. It offers a range of features including uptime monitoring, log management, and incident response tools.
Key features of Better Stack include:
- Real-time alerts and notifications
- Customizable dashboards
- Log management and analysis
- Uptime monitoring with 30-second checks
- Incident management with detailed timelines
- Integration with various programming languages and tools
Better Stack stands out for its user-friendly interface and scalable pricing, making it a good fit for startups and growing businesses. The platform offers a free tier with multiple monitors, allowing users to try out its features without financial commitment.
Here's how Better Stack compares to Datadog:
| Feature | Better Stack | Datadog |
|---|---|---|
| Pricing | Starts at $25/month | Starts at $15/host/month |
| Free Plan | Yes | Limited trial |
| Deployment | Cloud-based | Cloud-based |
| Log Management | Yes | Yes |
| Uptime Monitoring | Yes | Yes |
| Incident Management | Yes | Yes |
| White Label Status Page | Yes | No |
Better Stack has gained traction among various organizations. For example, teams from Decathlon, UNICEF, Accenture, Raspberry Pi, and the Government of Canada use Better Stack for their monitoring needs.
A software developer from a telecommunication company with less than 50M USD in revenue shared their experience:
"The Better Stack team was super helpful in getting us set up on their product. We transitioned over from another logging solution that was not working for us, so the difference has been night and day."
When considering Better Stack as a Datadog alternative, keep these points in mind:
- Ease of use: Better Stack is known for its intuitive interface, which can reduce the learning curve for new users.
- Scalability: The platform's pricing model allows for easy scaling as your monitoring needs grow.
- Integration: Better Stack supports various integrations, including Python, Ruby, and Java.
- Security: The platform is SOC2 Type 2 and GDPR-compliant, with built-in data encryption.
For teams looking for a Datadog alternative that offers a balance of features and affordability, Better Stack presents a strong option. However, it's important to evaluate your specific monitoring needs and compare them against Better Stack's offerings to ensure it's the right fit for your organization.
Comparison of alternatives
Let's break down how Datadog's alternatives stack up against each other. We'll look at key features, pricing, and target users to help you make an informed decision.
| Tool | Key Features | Pricing | Target Users |
|---|---|---|---|
| Dynatrace | Full-stack monitoring, AI-powered insights, 650+ integrations | Starts at $69/month for 8 GB per host (annual billing) | Enterprises |
| LogicMonitor | Hybrid observability, 2,000+ integrations, LM Co-Pilot | Starts at $22/resource/month | Mid-market |
| New Relic | 750+ integrations, unlimited containers per host | Free for <100GB data/month, $0.30/GB after | Mid-market |
| Splunk | Cloud/on-premises deployment, AI for analysis | Starts at $15/host/month | Mid-market, enterprise |
| AppDynamics | APM, user experience monitoring, application security | Starts at $60/month per CPU core | Enterprises |
| Zabbix | Open-source, highly customizable | Free (paid support available) | All sizes |
| SolarWinds | Comprehensive IT management suite | Contact for quote | Mid-market, enterprise |
| Instana | Automated monitoring for microservices | $75/host/month (SaaS), $93.80/host/month (self-hosted) | Mid-market, enterprise |
| Prometheus | Open-source, cloud-native monitoring | Free | All sizes |
| Better Stack | Uptime monitoring, log management, incident response | Starts at $24/month | Startups, growing businesses |
Each tool has its strengths and weaknesses. For example, Dynatrace's AI-powered insights can be a game-changer for large enterprises dealing with complex systems. A software engineer from a Fortune 500 company shared:
"Dynatrace's Davis AI engine has cut our troubleshooting time in half. It pinpoints issues before they become critical, allowing us to be proactive rather than reactive."
On the other hand, Better Stack's user-friendly interface and scalable pricing make it a good fit for smaller teams. As noted by a developer from a tech startup:
"We switched to Better Stack from Datadog, and the difference has been night and day. It's much easier to use, and we're not breaking the bank as we scale."
For those looking for open-source options, Zabbix and Prometheus stand out. They're free to use but require more technical expertise to set up and maintain. A DevOps engineer from a mid-sized e-commerce company reported:
"We've been using Prometheus for the past year. It took some time to set up, but now we have a robust monitoring system that didn't cost us a dime in licensing fees."
When it comes to pricing, New Relic's model of charging based on data ingestion (with 100 GB free) can be cost-effective for smaller teams but may get expensive for data-heavy operations. Splunk, while pricier, offers powerful analytics that many large enterprises find worth the investment.
It's crucial to consider your specific needs, budget, and technical capabilities when choosing a Datadog alternative. What works for a small startup might not be suitable for a large enterprise, and vice versa. Take advantage of free trials and demos to get a feel for each tool before making a decision.
How to pick the right tool
Choosing the best monitoring tool for your organization can be tricky. Here's how to make an informed decision:
- Assess your needs
Start by listing your must-have features. Consider:
- Network size and complexity
- Types of devices and applications to monitor
- Specific protocols and technologies used
- Required integrations with existing tools
- Evaluate scalability
Pick a tool that can grow with your organization. Ask yourself:
- Can it handle an increasing number of devices?
- Does it support different data types?
- How does it perform with high data volumes?
- Consider deployment options
Decide between on-premise and SaaS solutions based on:
| Factor | On-premise | SaaS |
|---|---|---|
| Control | High | Limited |
| Security | Customizable | Vendor-managed |
| Maintenance | In-house | Vendor-handled |
| Cost | Higher upfront | Lower initial investment |
- Check usability
A user-friendly interface boosts productivity. Look for:
- Easy setup and configuration
- Clear, customizable dashboards
- Intuitive reporting features
- Examine pricing models
Understand the cost structure:
- Per-device or per-host pricing
- Data volume-based pricing
- Tiered pricing plans
For example, New Relic offers 100 GB of free data ingestion per month, which can be cost-effective for smaller teams.