Looking for Datadog alternatives? Here's a quick rundown of the top 5 options:
- Grafana: Open-source, highly customizable dashboards
- New Relic: Strong APM and AI capabilities
- Dynatrace: AI-powered observability with automatic discovery
- Sumo Logic: Focuses on log management and security analytics
- AppSignal: User-friendly, tailored for Ruby, Elixir, and Node.js
Quick Comparison:
| Tool | Key Strength | Pricing | Ease of Use |
|---|---|---|---|
| Grafana | Customization | Free - Custom | Moderate |
| New Relic | APM & AI | $0 - $549/user/month | Easy |
| Dynatrace | AI-powered insights | From $69/month | Complex |
| Sumo Logic | Log analytics | Custom | Moderate |
| AppSignal | Language-specific | From $25/month | Very Easy |
Consider your specific needs, budget, and technical expertise when choosing. Test drive options before committing.
Related video from YouTube
What is cloud monitoring?
Cloud monitoring is the process of observing, evaluating, and managing cloud-based systems, applications, and infrastructure. It's crucial for businesses relying on cloud computing to ensure smooth, efficient, and secure operations.
Key aspects of cloud monitoring:
1. Data collection: Gathering metrics from various sources
2. Analysis: Processing data to identify patterns and issues
3. Alerting: Notifying teams when problems are detected
4. Visualization: Presenting data in easy-to-understand dashboards
5. Remediation: Taking action to resolve issues and optimize performance
Cloud monitoring tools typically offer:
- Performance tracking
- Resource utilization analysis
- Cost management
- Security monitoring
- Log analysis
Using a third-party cloud monitoring tool can reduce Mean Time To Detection by 28% and Mean Time To Recovery by 22%.
To maximize cloud monitoring:
- Define clear goals
- Set up continuous monitoring
- Centralize monitoring data
- Regularly review and adjust your strategy
Overview of Datadog
Datadog is a cloud-based monitoring and analytics platform founded in 2010. It's popular among enterprises managing complex cloud environments.
Key features:
- Infrastructure monitoring
- Application performance monitoring (APM)
- Log management
- User experience monitoring
- Real-time metrics and dashboards
- Distributed tracing
Datadog integrates with over 700 tools and services, supporting major cloud providers and technologies like Kubernetes.
Pros and cons:
| Pros | Cons |
|---|---|
| Comprehensive monitoring | Complex pricing |
| Wide range of integrations | High costs for large deployments |
| Real-time insights | Steep learning curve |
| Customizable dashboards | Limited advanced customization |
Datadog's complex pricing can lead to unpredictable bills. Custom metrics are charged at $0.05 per metric and can account for up to 52% of total billing.
For organizations considering Datadog:
1. Establish specific monitoring goals
2. Configure custom alerts
3. Create insightful dashboards
4. Carefully manage usage to avoid unexpected costs
While powerful, Datadog's high costs and complexity may lead some to explore alternatives.
1. Grafana
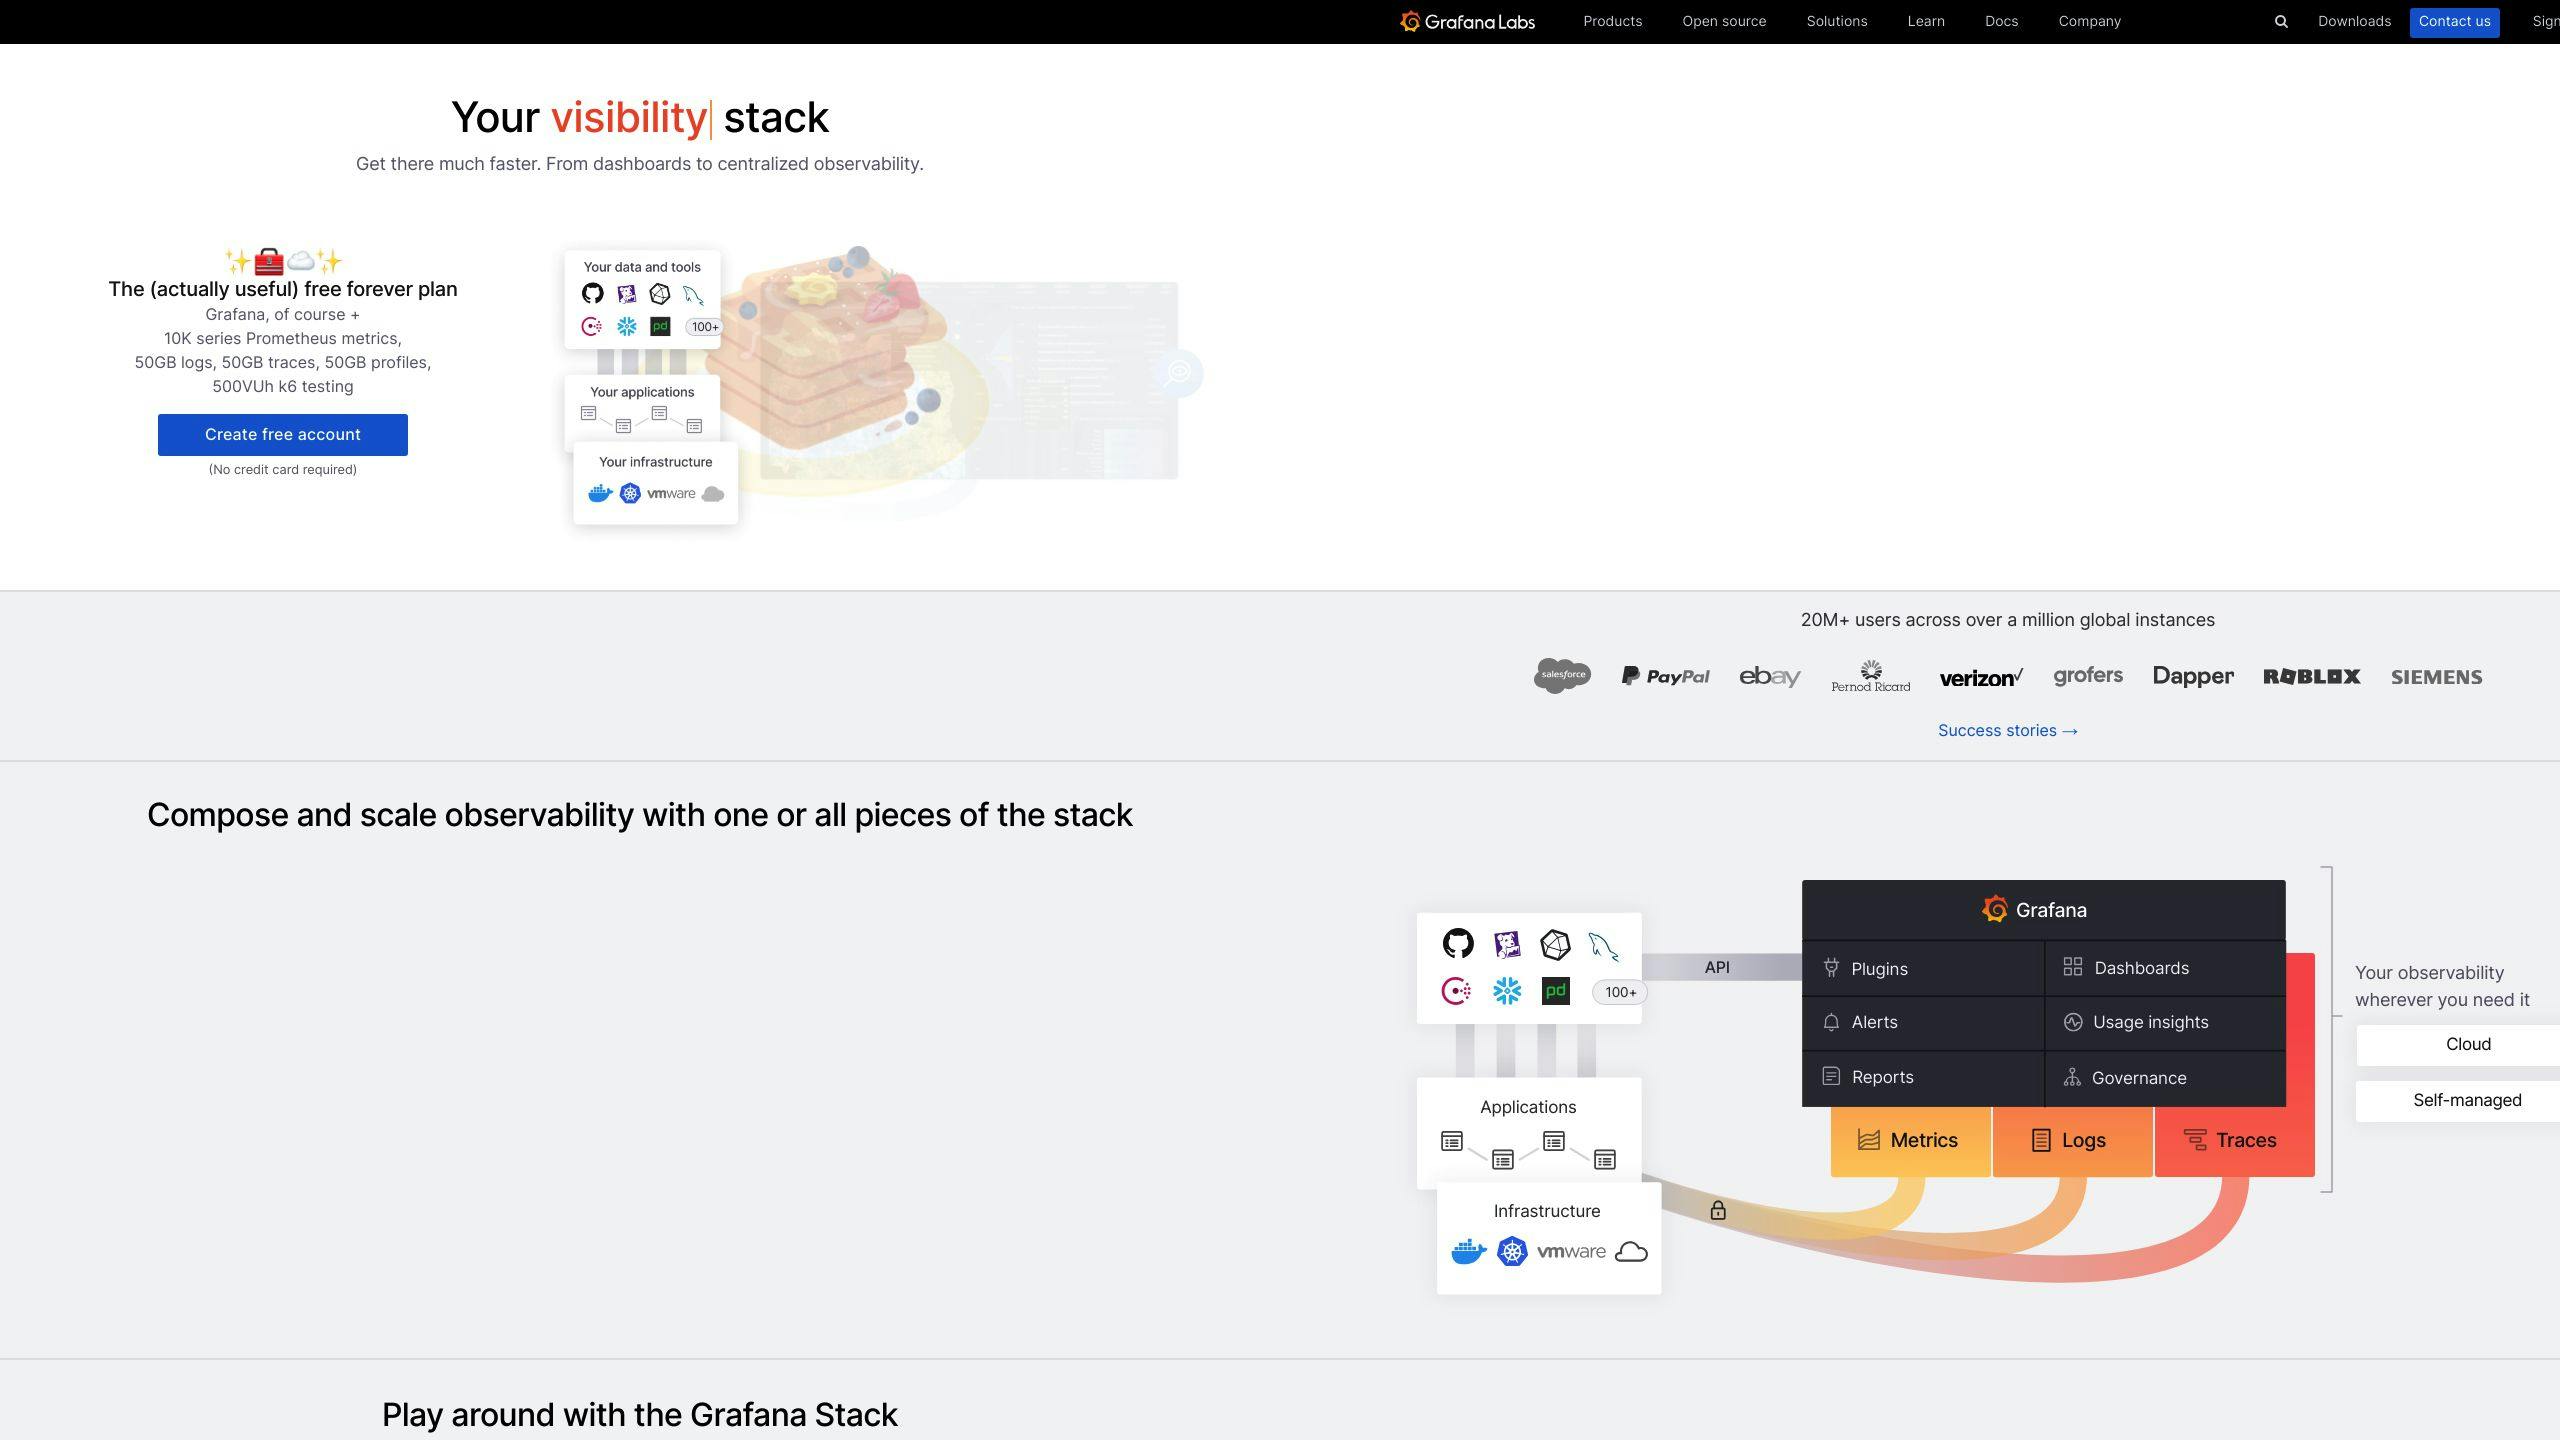
Grafana is an open-source platform for data visualization and analytics. It's a strong Datadog alternative for teams seeking flexible, customizable monitoring solutions.
Key features:
- Support for multiple data sources
- Highly customizable dashboards
- Alerting capabilities
- Time series analytics
Grafana excels in creating detailed, interactive dashboards from various data sources.
| Feature | Grafana | Datadog |
|---|---|---|
| Primary Focus | Data Visualization | Comprehensive Monitoring |
| Data Source Integration | Extensive | Limited |
| Customization | High | Moderate |
| Pricing Model | Open-source with paid options | Subscription-based |
Grafana's pricing is more flexible, with a free open-source version and Grafana Cloud starting at $29/month for 5 users.
Companies like PayPal, eBay, and Intel use Grafana. StackOverflow uses it for server performance optimization.
Grafana requires more technical expertise than Datadog but offers greater customization.
Grafana 10 introduces:
- Grafana Live for real-time data streaming
- Query builders for easier data querying
- Command palette for improved UI navigation
- Role-based access control
Consider testing Grafana Cloud's free tier to explore its capabilities.
sbb-itb-9890dba
2. New Relic
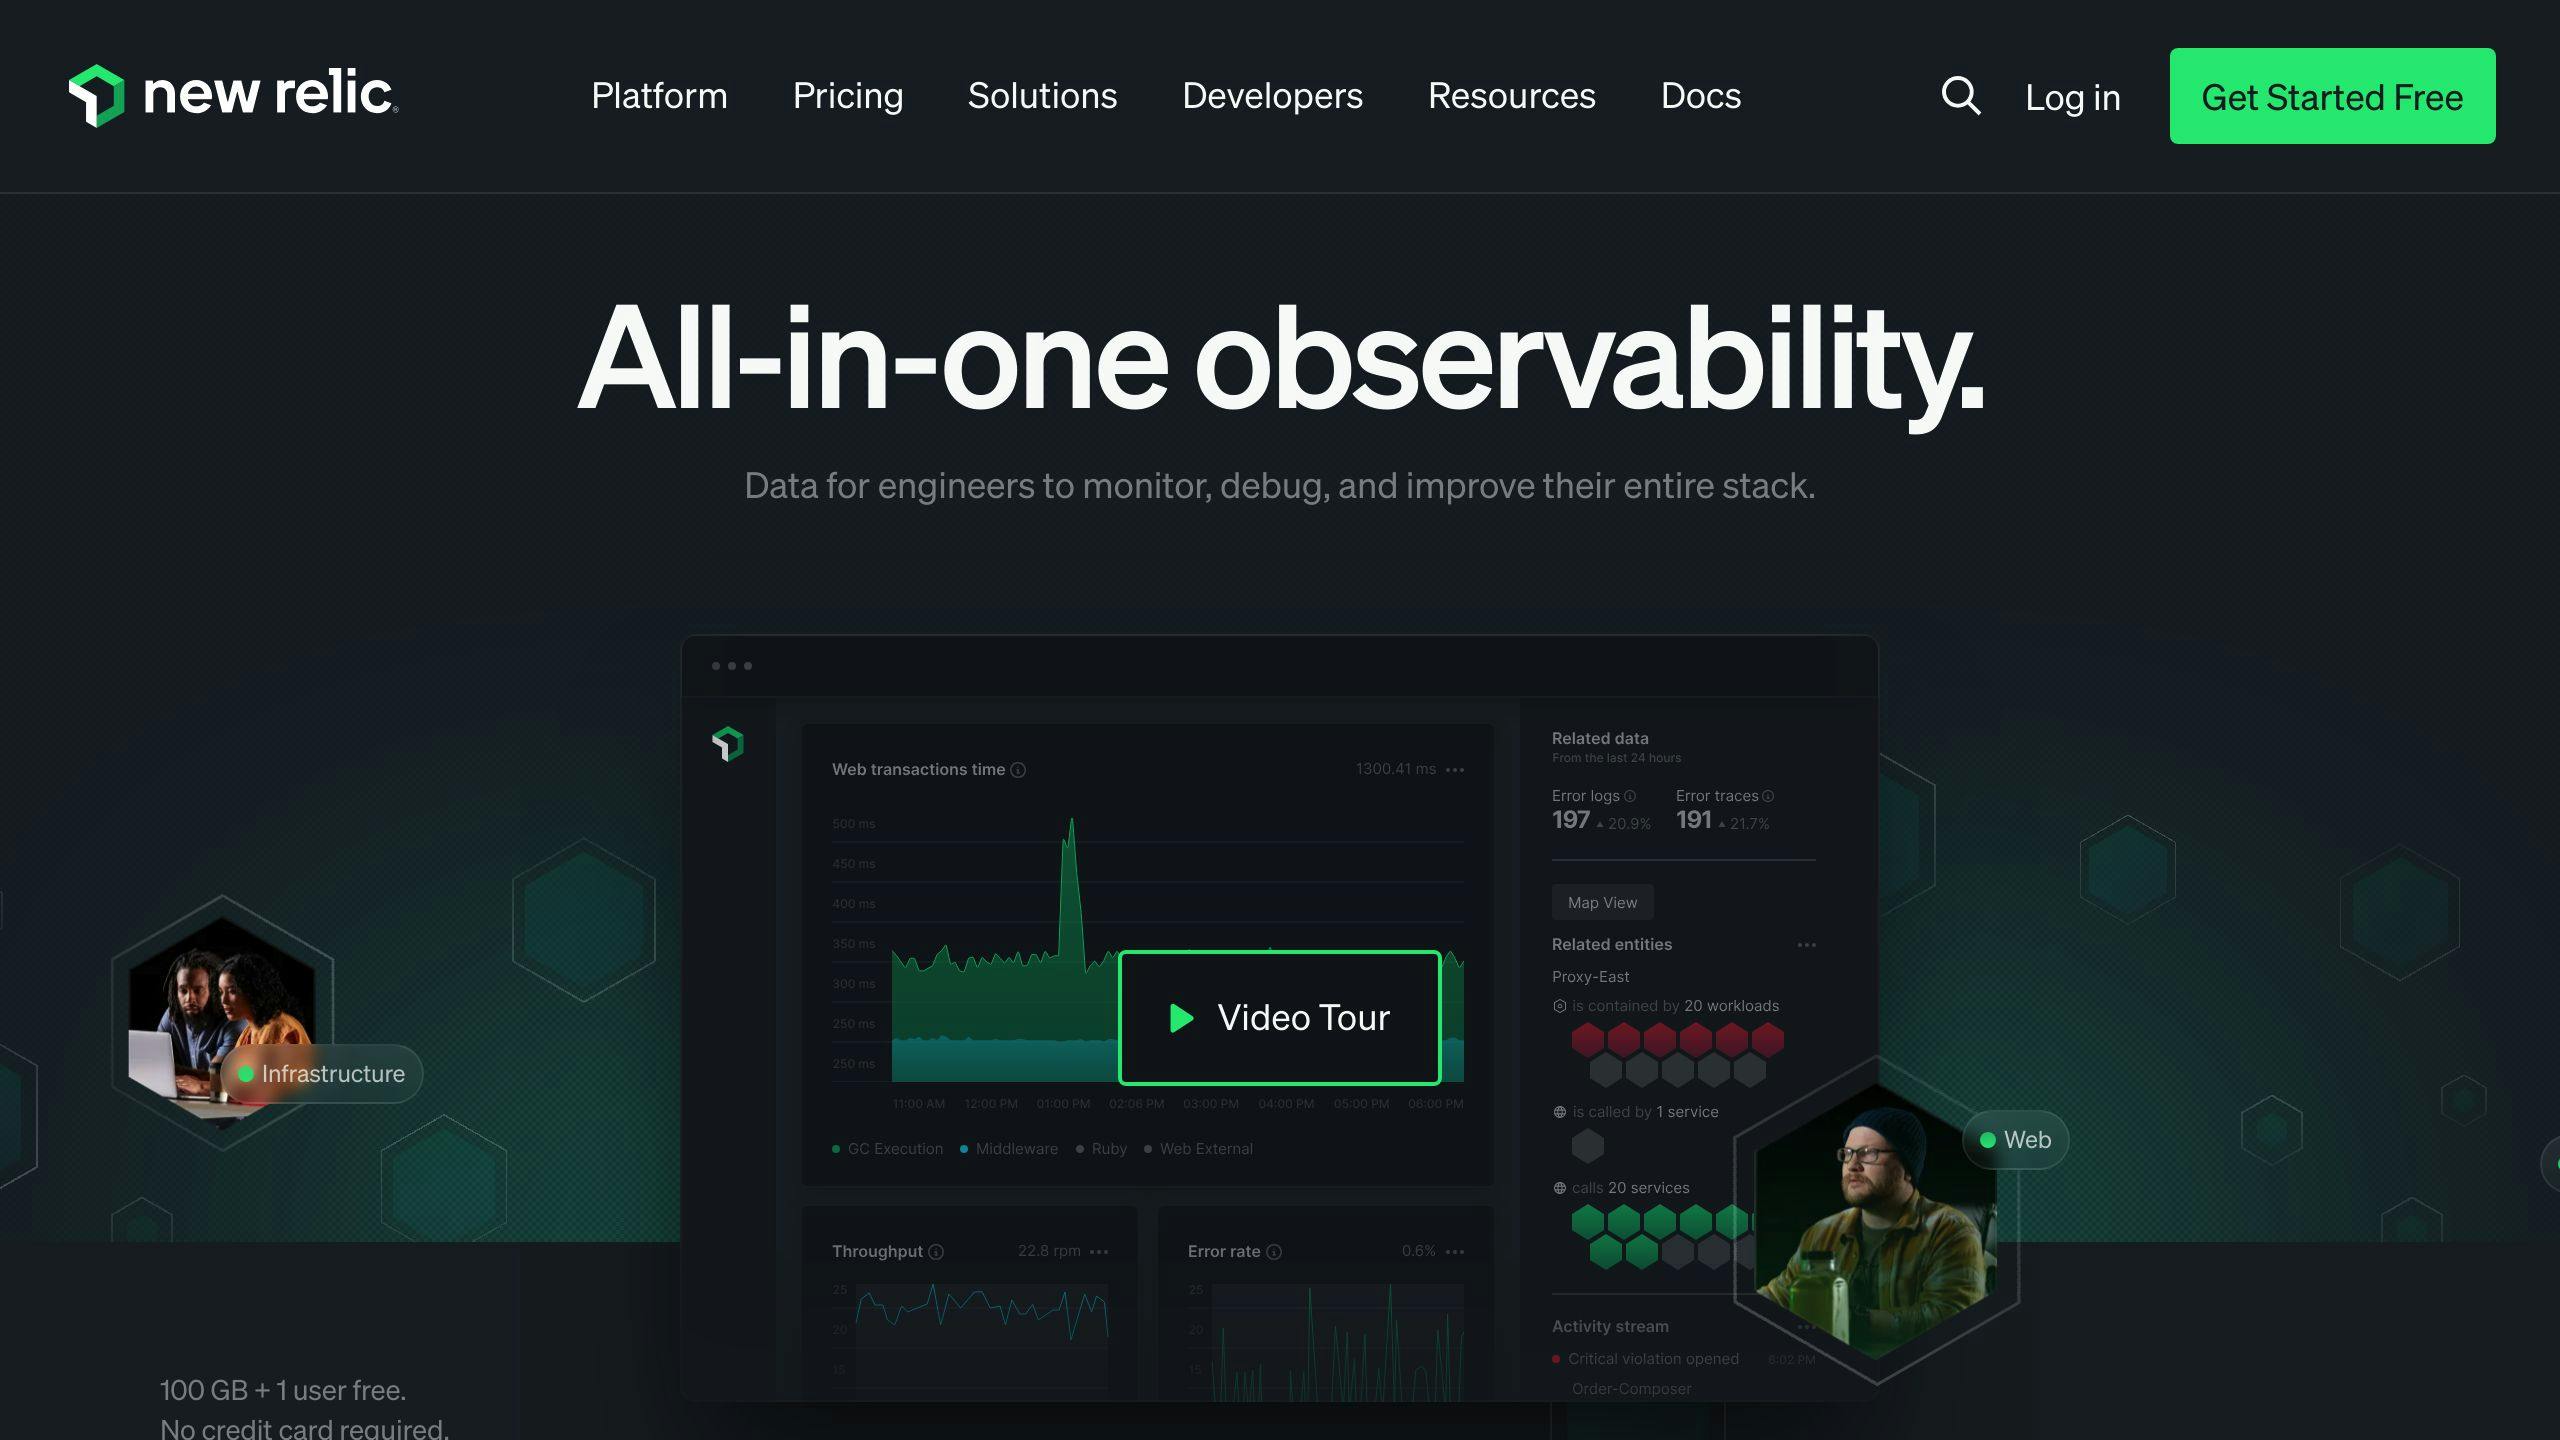
New Relic is a powerful cloud-based observability platform offering end-to-end visibility into complex software environments. It's strong in application performance monitoring (APM) and tracing.
Key features:
- Full-stack monitoring
- Real-time health metrics
- Over 750 integrations
- AI monitoring capabilities
New Relic's pricing starts at $149/month for unlimited users, including 100GB of free data ingestion monthly.
| Feature | New Relic | Datadog |
|---|---|---|
| Infrastructure monitoring | ✓✓ | ✓✓ |
| Log management | ✓ (limited) | ✓✓ |
| APM | ✓✓ | ✓ (needs other products) |
| Real User Monitoring | ✓✓ | ✓ |
| Freemium plan | ✓✓ | X |
| Containers per host | Unlimited | Additional cost |
| Log retention | 30 days included | $2.50/m log events |
New Relic's AI monitoring features include auto instrumentation, full AI stack visibility, and deep trace insights for AI responses.
Companies using New Relic have reported significant benefits in monitoring capabilities and data-driven decision-making.
New Relic's setup process is straightforward, with guided installation and automatic environment detection.
While New Relic's logging capabilities are more limited than Datadog's, it's strong in APM and AI monitoring.
3. Dynatrace

Dynatrace offers comprehensive end-to-end observability, focusing on modern infrastructures, distributed applications, user experience, and business intelligence.
Key features:
- Automatic discovery and monitoring
- AI-powered observability with Davis® hypermodal AI
- Continuous runtime application security
- OpenTelemetry support
- On-premise deployment option
Dynatrace's OneAgent technology automatically scans and captures data from most infrastructure.
| Feature | Dynatrace | Datadog |
|---|---|---|
| Infrastructure monitoring | ✅ | ✅ |
| APM | ✅ | ✅ |
| Log monitoring | ✅ | ✅ |
| Real-User monitoring | ✅ | ✅ |
| OpenTelemetry support | ✅ | 🟡 |
| On-premise deployment | ✅ | ❌ |
| AI-powered insights | ✅ | ✅ |
Dynatrace's pricing starts at $74 per 8GB per host for its full-stack model.
Dynatrace excels in AI capabilities and detailed insights, offering granular information about applications. It's particularly useful for complex application infrastructures.
While Dynatrace has a steeper learning curve, it's a top choice for those seeking detailed control over monitoring.
4. Sumo Logic
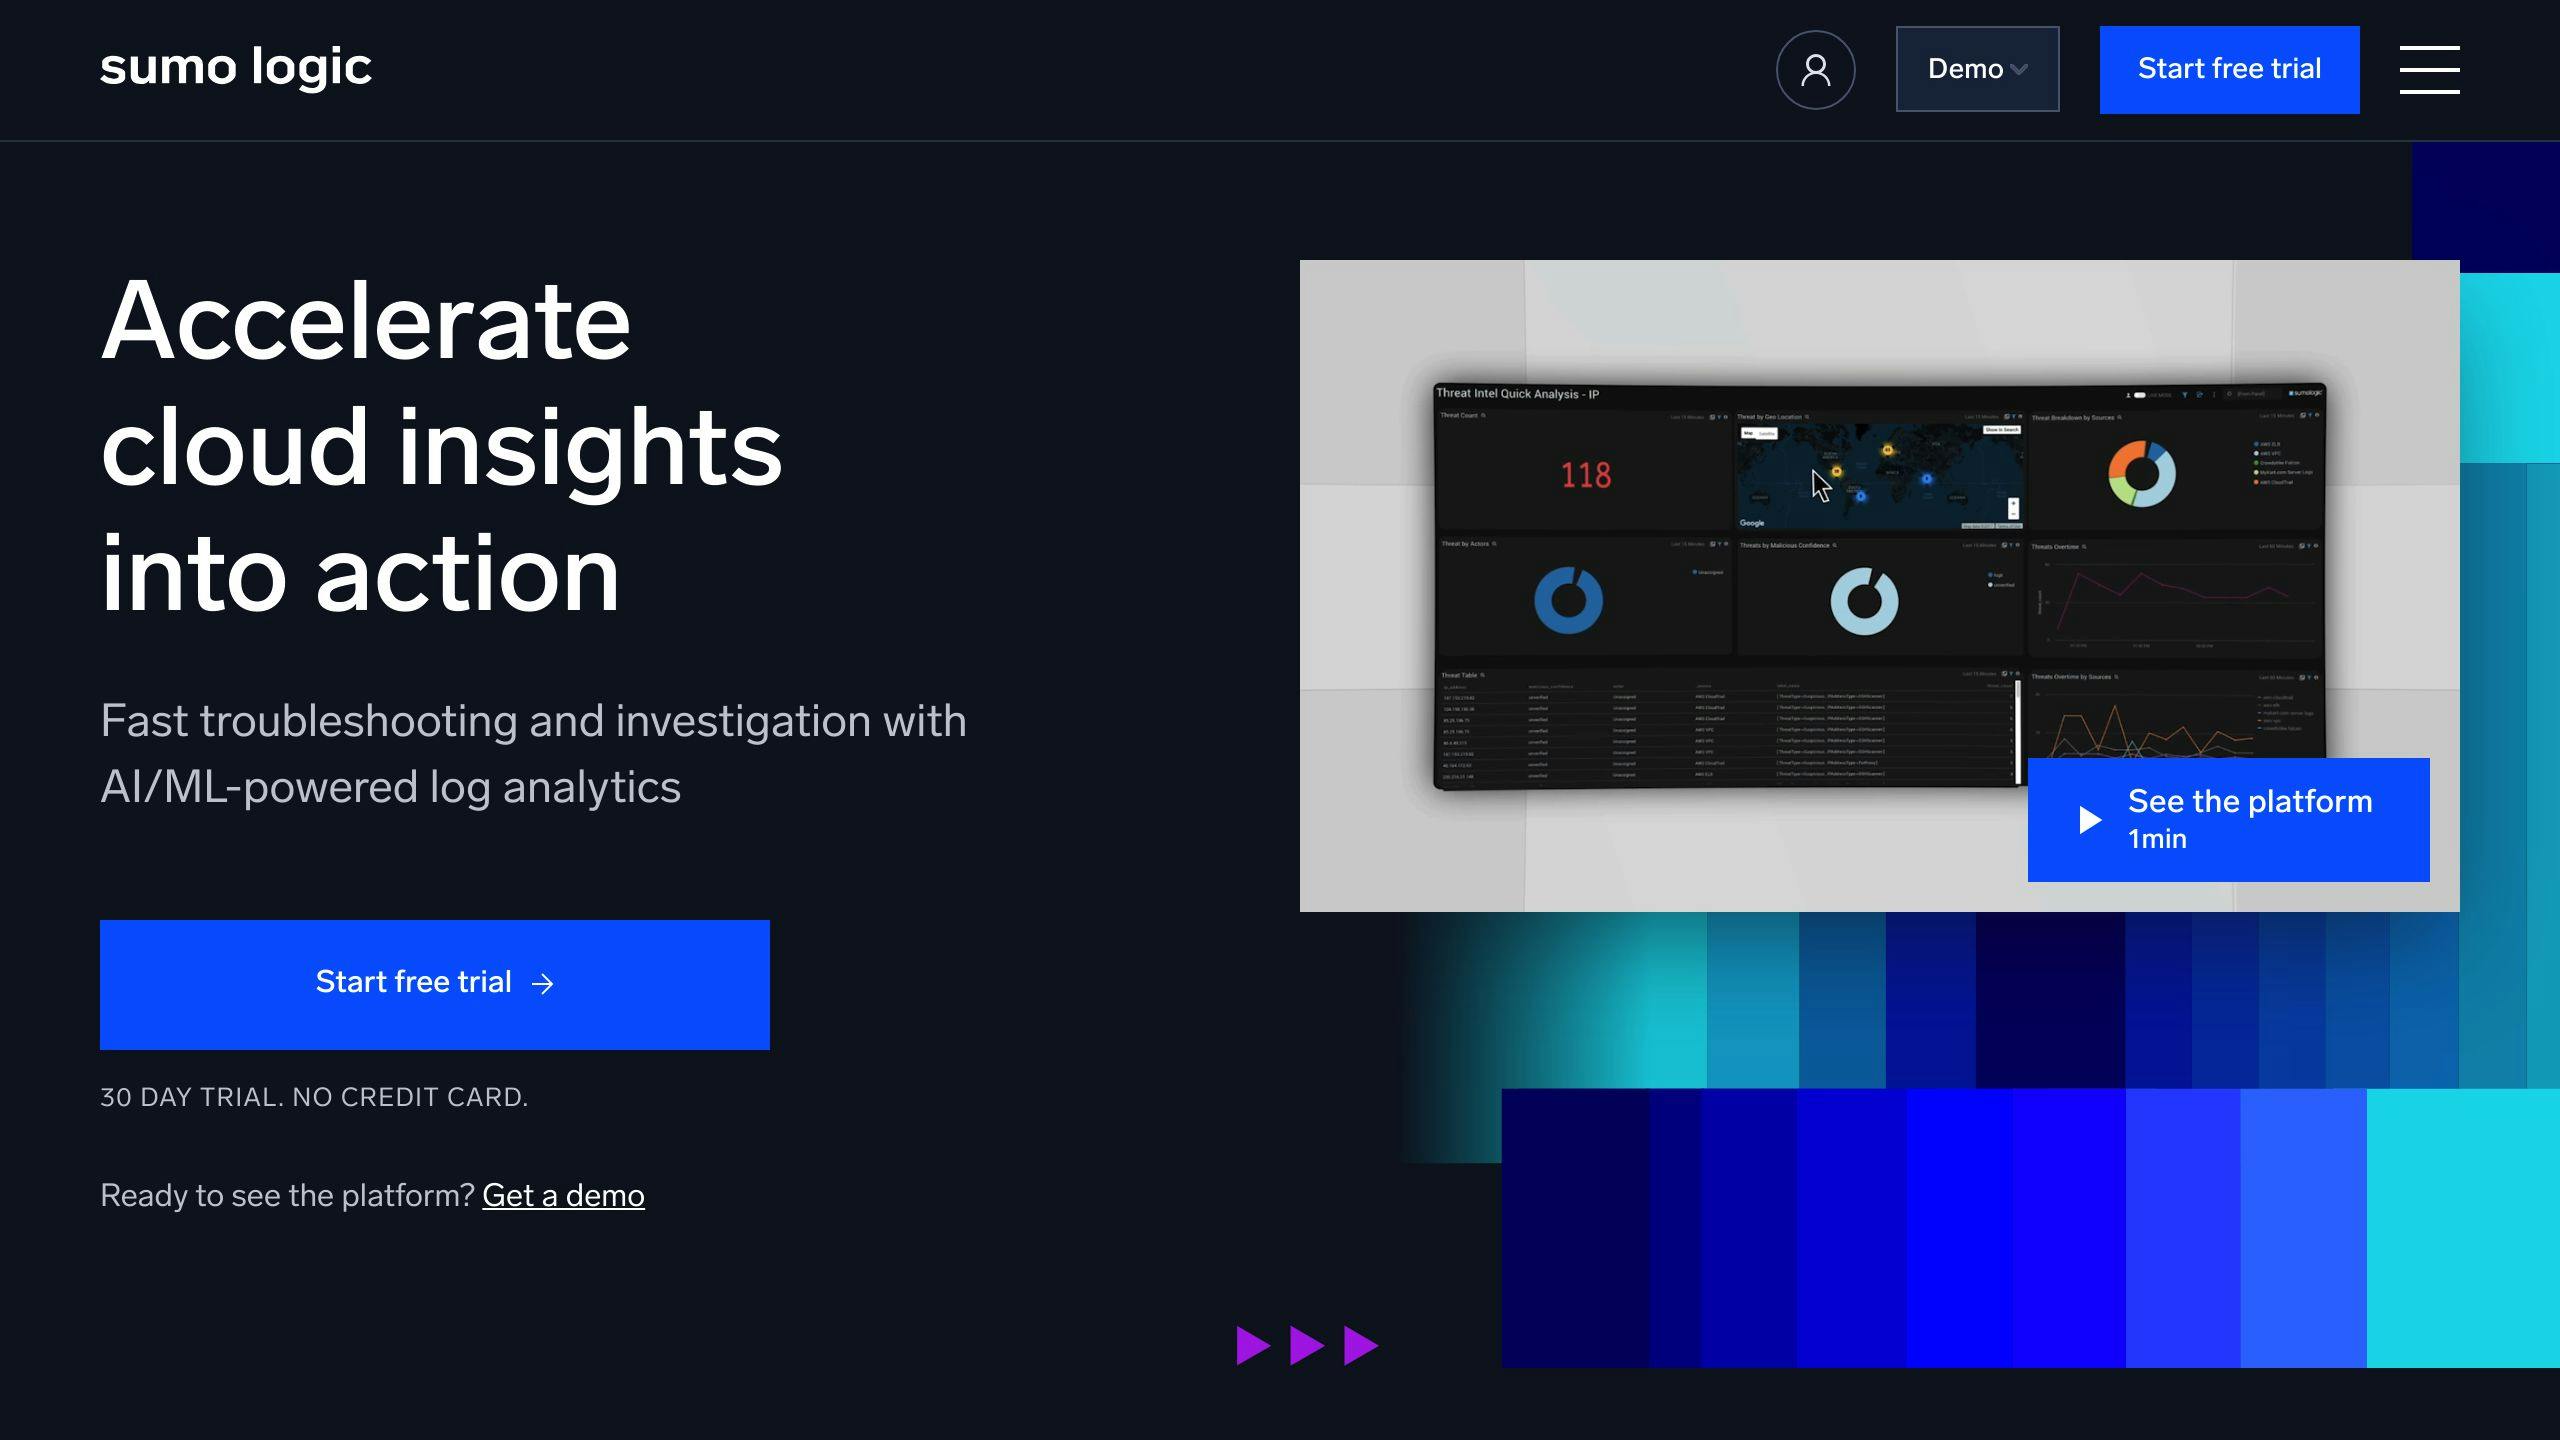
Sumo Logic offers a complete cloud monitoring solution covering infrastructure, applications, and security. It excels in log management and analytics.
Key features:
- Cloud-native platform supporting major cloud providers
- OpenTelemetry support
- AI-powered insights and anomaly detection
- Built-in collaboration tools
- Compliance monitoring and security analytics
Sumo Logic automatically collects logs and metrics from core AWS services.
Pricing is flexible, based on data volume and functionality needs:
| Edition | Price per GB of Logs |
|---|---|
| Essentials | $3.00 |
| Enterprise | $4.00 |
| Enterprise Security | $4.25 |
| Enterprise Suite | $4.75 |
Sumo Logic's new "Flex Licensing" plan allows for free, unlimited log data ingest.
The platform offers greater flexibility and customization options than Datadog, but with a steeper learning curve.
Sumo Logic integrates with over 270 third-party tools and services, streamlining workflows and improving operational efficiency.
It's particularly strong in log management and analytics, making it an excellent choice for organizations prioritizing these areas.
5. AppSignal

AppSignal focuses on application and server monitoring, particularly for Ruby, Elixir, and Node.js applications. It's user-friendly and suitable for smaller teams and startups.
Key features:
- Performance monitoring
- Error tracking
- Host monitoring
- Anomaly detection
- Log incidents
AppSignal's main advantages are its user-friendly interface and affordable pricing, starting at $25 per month.
For Ruby, Elixir, or Node.js teams, AppSignal offers tailored insights without extensive setup.
AppSignal's customer support is highly praised, with direct access to engineers who build the product.
| Feature | AppSignal | Datadog |
|---|---|---|
| Primary focus | Application and server monitoring | Comprehensive monitoring |
| Supported languages | Ruby, Elixir, Node.js | Wide range |
| Pricing model | Starts at $25/month | More expensive, complex |
| User interface | Simple, user-friendly | More complex, customizable |
| Customer support | Direct access to engineers | Tiered support system |
AppSignal is worth considering for teams looking for a focused, user-friendly, and cost-effective alternative to Datadog, especially those working with Ruby, Elixir, or Node.js.
Wrap-up
When choosing a cloud monitoring tool, consider:
- Real-time monitoring capabilities
- Comprehensive coverage
- Integration with your tech stack
- Pricing structure
- Ease of use
- AI capabilities
There's no one-size-fits-all solution. Your choice should align with your specific needs and scalability requirements.
Conduct trials or demos before switching. The right tool can lead to significant improvements, such as reduced production bugs and lower cloud costs.
Remember, the best choice depends on your unique requirements and technical expertise.