Grafana and Eyer.ai are changing the game in data analysis and IT operations management. Here's what you need to know:
- Grafana: Open-source platform for data visualization and analytics
- Eyer.ai: AI-powered tool that enhances existing platforms like Grafana
Key benefits:
- Automate repetitive tasks
- Spot hidden patterns in data
- Resolve issues faster
Quick Comparison:
| Feature | Grafana | Eyer.ai |
|---|---|---|
| Main focus | Data visualization | AI-powered analysis |
| Data sources | 100+ | Works with existing tools |
| AI capabilities | Limited | Advanced anomaly detection |
| Ease of use | Can be complex | User-friendly |
| Best for | Deep customization | Adding AI smarts to existing setups |
Why it matters:
- AI is becoming standard in IT ops
- Businesses want unified observability platforms
- Tools that work together, like Grafana and Eyer.ai, are the future
Bottom line: These tools help turn data into actionable insights, making complex IT systems easier to manage.
Related video from YouTube
Grafana
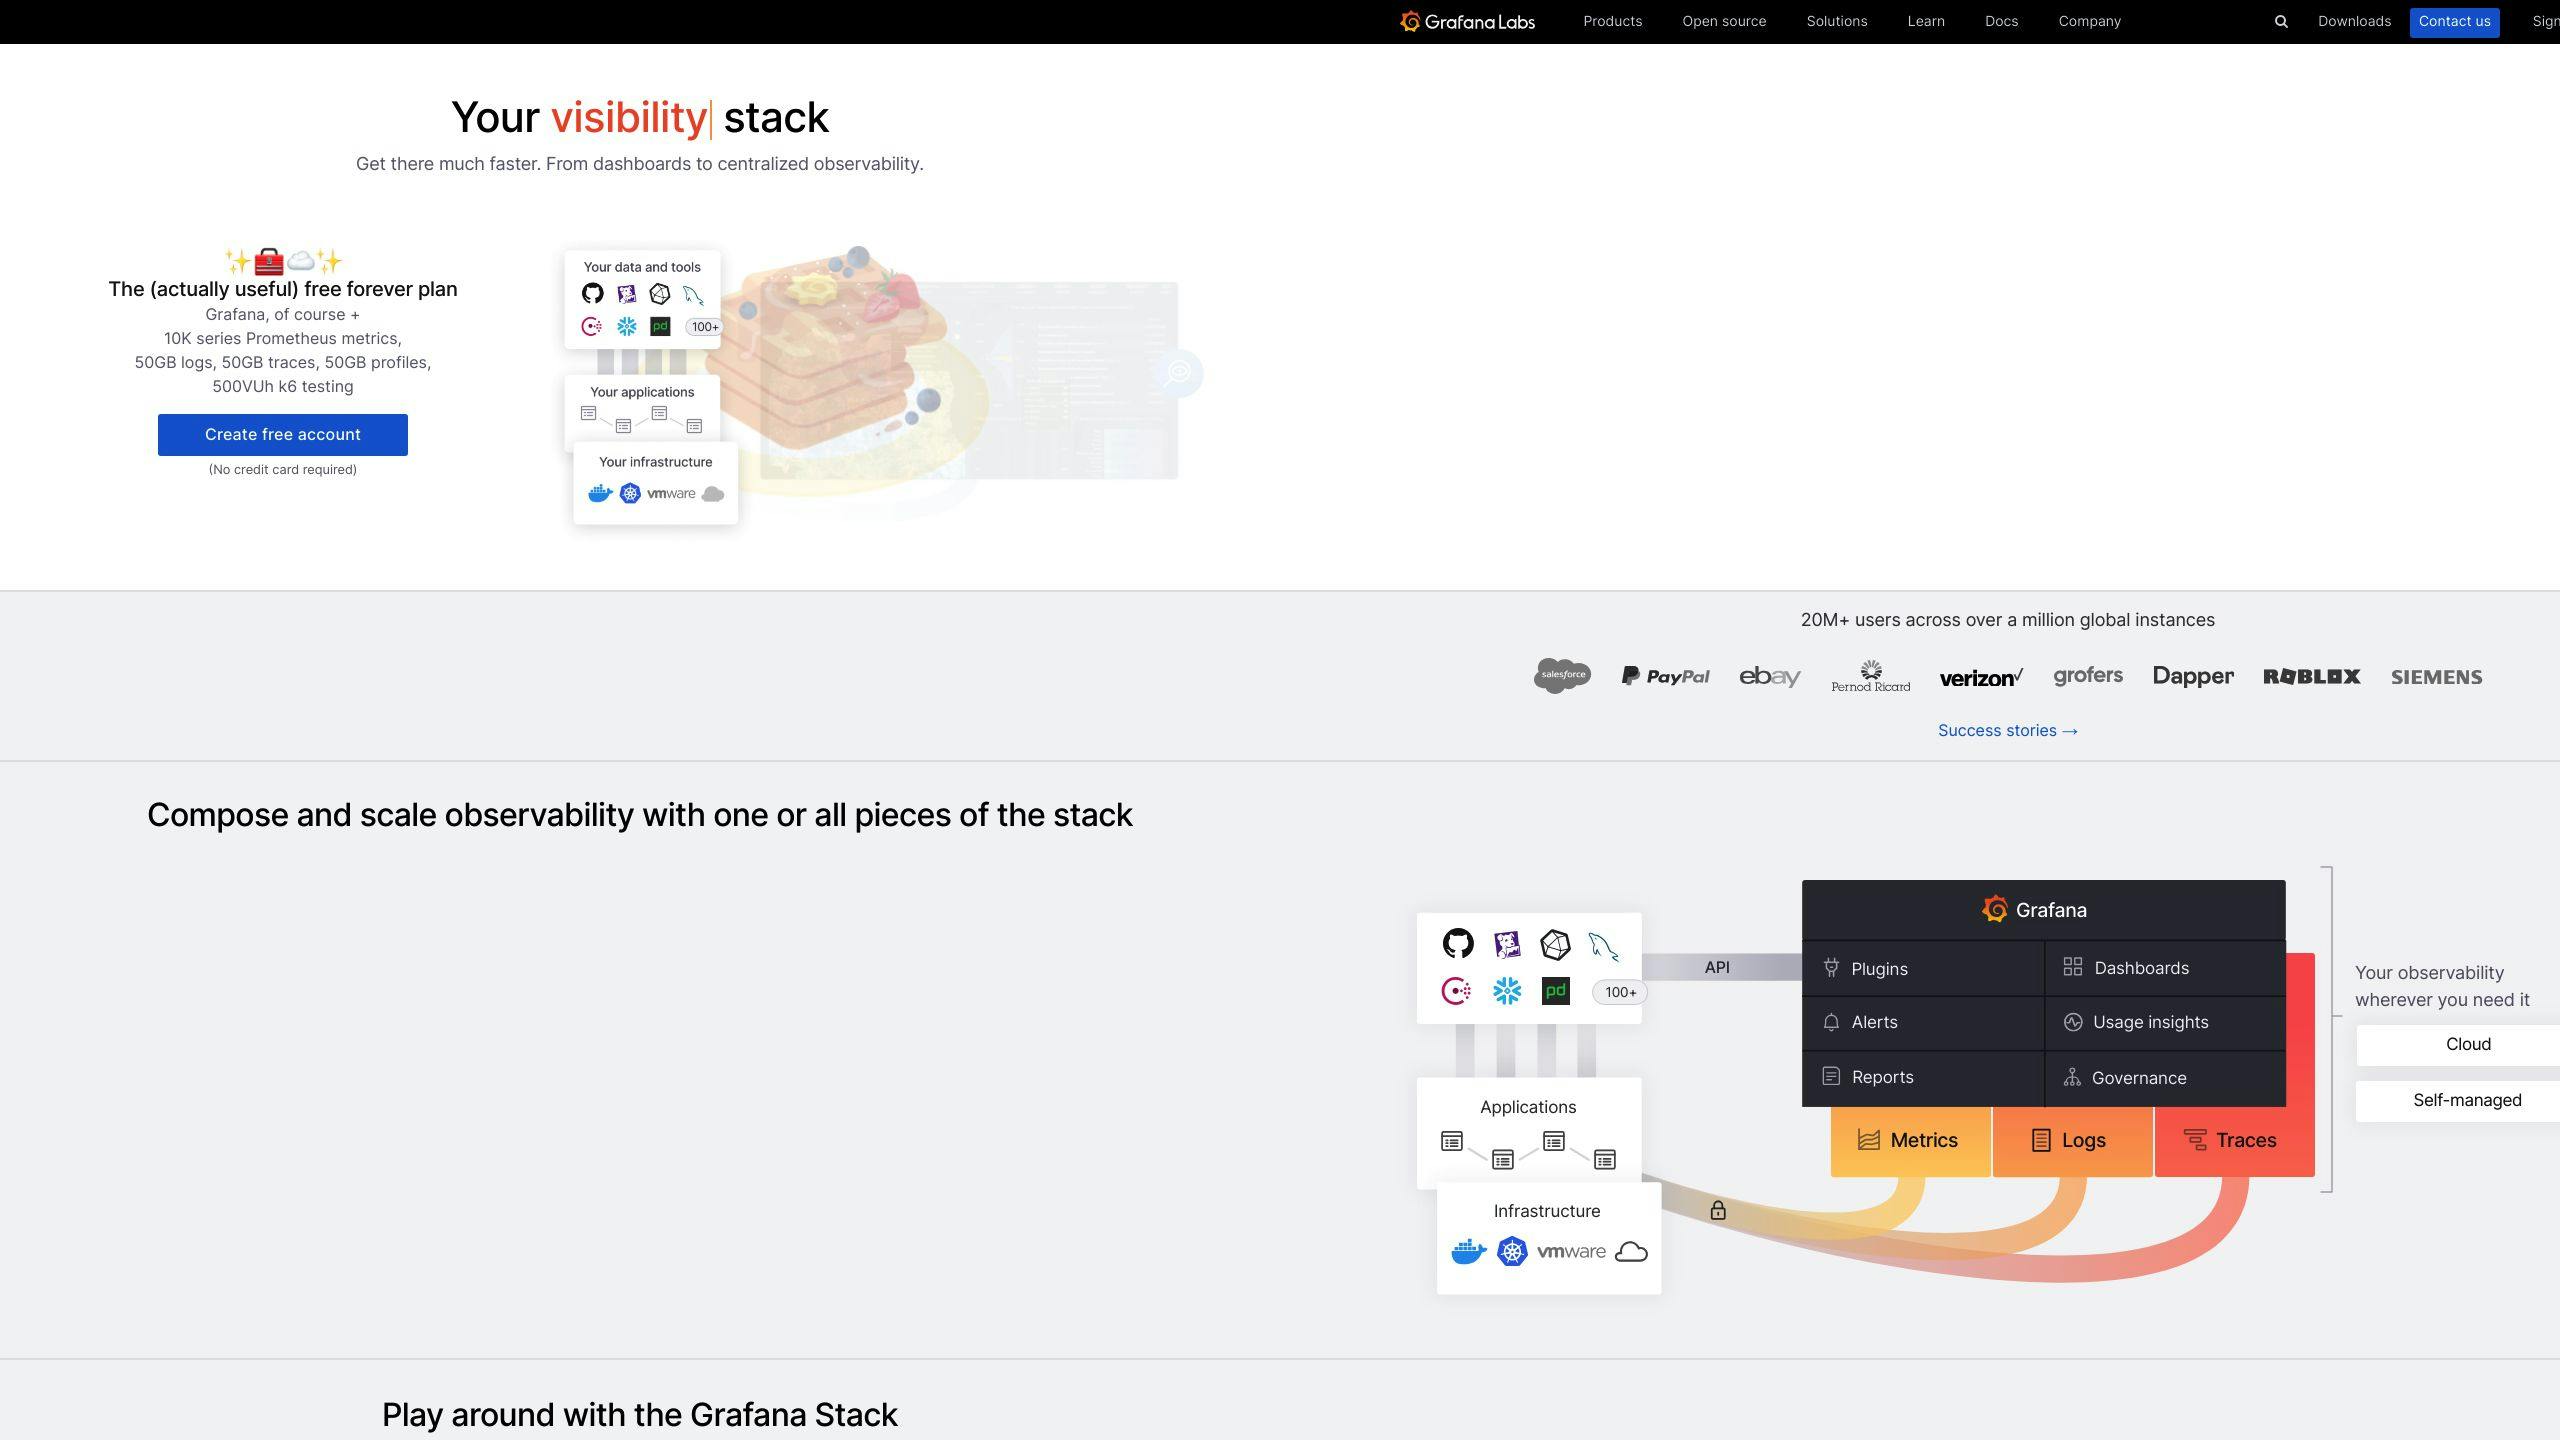
Grafana is an open-source platform for data visualization and analytics. It's built to help businesses make sense of complex IT systems and large datasets.
Here's what Grafana offers:
Data Connections
Grafana connects to over 100 data sources, including Prometheus, Elasticsearch, InfluxDB, AWS CloudWatch, and Azure Monitor. This lets users pull data from multiple sources into a single dashboard.
Visualization Tools
Users can create custom dashboards with:
- Line graphs
- Bar charts
- Heatmaps
- Pie charts
- Gauge panels
These show real-time data in easy-to-understand formats.
AI Features
Grafana uses AI to:
- Spot unusual patterns in data streams
- Generate incident summaries
- Help create more effective dashboards
Team Collaboration
Grafana makes teamwork easier with:
- Shared dashboards
- Role-based access control
- Public dashboard sharing
Regular Updates
Grafana Labs keeps improving the platform. For example, Grafana 11.2 added new data sources and improved transformations and alerting features.
Real-World Use
Grafana is used for:
- IT infrastructure monitoring
- Application performance monitoring
- Log analysis
While specific company examples are limited, Grafana's features make it useful for many different scenarios.
2. Eyer.ai

Eyer.ai is an AI-powered platform that works with tools like Grafana to boost your data analysis and system monitoring. Here's what it does:
AI Smarts
Eyer.ai uses AI to:
- Spot weird behavior in your data in real-time
- Find patterns and oddities in how your systems work together
- Guess what might go wrong based on past data
Plays Well With Others
It hooks up with:
- Grafana for pretty charts
- Boomi to keep an eye on your integrations
- Power BI for business smarts
- Open-source tools like Influx Telegraf and Prometheus
Cool Stuff It Does
| Feature | What It Does |
|---|---|
| Finds Oddities | Spots when CPU and memory act up |
| Finds Root Causes | Figures out what's wrong before users complain |
| Sees the Future | Guesses future problems using AI |
| Yells When Something's Wrong | Sends alerts for weird stuff |
Real-World Example
Eyer.ai and Boomi team up to:
- Watch over Boomi setups without much fuss
- Come ready-made for specific integration scenarios
- Show you how to make Boomi work better
- Warn you about issues before they blow up
Handles Your Data
Eyer.ai is built to:
- Suck in performance data from anywhere
- Give you tips to keep your systems running smooth
- Let you see what's happening across all your connected systems
sbb-itb-9890dba
Strengths and Weaknesses
Let's compare Grafana and Eyer.ai:
| Feature | Grafana | Eyer.ai |
|---|---|---|
| Data Visualization | Graphs, charts, tables, gauges, heat maps, geospatial maps | Works with Grafana |
| Data Source Integration | Prometheus, InfluxDB, Graphite, Elasticsearch, MSSQL, more | Grafana, Boomi, Power BI, open-source tools |
| AI Capabilities | Limited | Anomaly detection, pattern recognition, predictive analysis |
| Alerting | Basic built-in | AI-powered for anomalies and potential issues |
| Ease of Use | Can be complex for beginners | User-friendly |
| Community Support | Large, active | Newer, growing |
| Customization | Highly customizable dashboards | Pre-built solutions focus |
| Pricing | Free plan, paid from $299 | Not specified |
Grafana's strong suit? Data visualization and source integration. It's flexible, but it can be tough to learn.
Barry P., Managing Performance Engineer at Medica Health Plans, says:
"With Dynatrace, we have synthetic checks and real-user monitoring of all of our websites, places where members and providers can interact with us over the web. We monitor the response times of those with Dynatrace, and it's all integrated into one place."
Eyer.ai? It's all about AI-powered analysis. It plays nice with tools like Grafana, adding smart features to spot issues early.
Both have their place. Grafana's for those who want deep customization and don't mind the learning curve. Eyer.ai? It's for teams looking to add AI smarts to their existing setup.
Wrap-up
Grafana and Eyer.ai are reshaping data analysis for businesses. Here's what it means:
1. AI is now the norm
72% of organizations use AI for IT ops. It's clear: smart, automated data tools are taking over.
2. One platform to rule them all
79% of organizations want unified observability platforms within a year. Why? Too many tools = too much complexity.
"85% of tech leaders say tool overload complicates multicloud management."
3. From data to action
Collecting data isn't enough. Businesses need tools that spark action:
| Step | What it means |
|---|---|
| Collect | Get the right data |
| Analyze | Make sense of it |
| Find insights | Spot what matters |
| Share | Tell everyone |
| Act | Do something about it |
4. See it to believe it
Grafana and Eyer.ai make data easy on the eyes. Why? Because everyone needs to get it, not just IT folks.
5. Better together
Tools that play nice, like Grafana and Eyer.ai, are the future. They mix great visuals with AI smarts for a full data picture.
As data keeps growing, Grafana and Eyer.ai will be key players. The goal? Powerful analysis that's easy to use.
FAQs
What can AI data analysis do?
AI data analysis is a game-changer. It chews through massive data sets, including real-time info, like it's nothing. Here's the scoop:
- It spots errors and fixes them on the fly
- Preps data faster than you can say "spreadsheet"
- Finds needles in data haystacks that humans miss
- Handles numbers, text, and images like a pro
- Predicts trends based on what's happened before
Take Walmart, for example. They've got AI eyeballing their shelves, keeping tabs on what's there and what's not. It's like having a super-smart inventory clerk that never sleeps.
And it's not just about counting beans. Bank of America uses AI to play matchmaker between investors and deals. It's like having a sixth sense for who might be interested in what.
| What AI Does | Why It Matters |
|---|---|
| Spots errors | Data you can trust |
| Finds patterns | Insights you didn't know you needed |
| Cleans data | Less time fixing, more time analyzing |
| Predicts stuff | Smarter decisions, faster |
Bottom line? AI is flipping the script on data analysis. It's not just about hoarding info anymore. It's about using it to make smart moves, pronto.