Looking for Datadog alternatives? Here's a quick rundown of the top options:
Each tool offers unique features for IT monitoring, from open-source flexibility to AI-powered analytics. Let's compare their key attributes:
| Tool | Key Feature | Best For | Pricing Model |
|---|---|---|---|
| Prometheus | Open-source | Kubernetes environments | Free |
| Grafana | Data visualization | Time-series data | Open-source with paid options |
| New Relic | Full-stack observability | Small to medium businesses | Usage-based |
| Splunk | Big data analysis | Large enterprises | Per-GB ingested |
| Dynatrace | AI-driven automation | Complex cloud environments | Per host |
| AppDynamics | Business transaction tracking | Application-centric teams | Per agent |
| Zabbix | Customizable monitoring | Technical teams | Free with paid support |
| Instana | Automated APM | Microservices architectures | Per host |
| SolarWinds | Network monitoring | IT professionals | Tiered licensing |
| Better Stack | AIOps platform | Predictive analytics | Custom pricing |
When choosing a Datadog alternative, consider your specific needs, budget, and team expertise. Each tool offers unique strengths, from Prometheus's Kubernetes integration to Dynatrace's AI capabilities.
Related video from YouTube
1. Prometheus

Prometheus is an open-source monitoring system that's become a go-to choice for many organizations, especially those working with cloud-native environments and Kubernetes.
Here's what makes Prometheus stand out:
- Time-series data collection
- PromQL query language
- Built-in alerting
- Pull-based model
Prometheus shines in its ability to scale. The Prometheus Operator helps manage deployment and scaling in Kubernetes environments. This makes it suitable for both small startups and large enterprises.
However, Prometheus does have some limitations:
| Pros | Cons |
|---|---|
| Free and open-source | Requires more setup and maintenance than SaaS solutions |
| Highly scalable | Limited built-in visualization options |
| Flexible and customizable | No long-term data retention out of the box |
| Works well with Kubernetes | Steeper learning curve for PromQL |
To get the most out of Prometheus:
- Choose the right exporter for your needs
- Use labels wisely
- Set actionable alerts
- Pair with Grafana for visualization
Prometheus works well with other tools. For example, ProphetStor's Federator.ai can enhance Prometheus by providing deeper insights into application performance:
"Federator.ai can detect application issues that may be overlooked by a single metric, such as identifying microservices causing bottlenecks and recommending scaling actions to improve performance."
While Prometheus requires more hands-on management compared to Datadog, its open-source nature and flexibility make it a strong contender for organizations looking to optimize their monitoring setup without breaking the bank.
2. Grafana

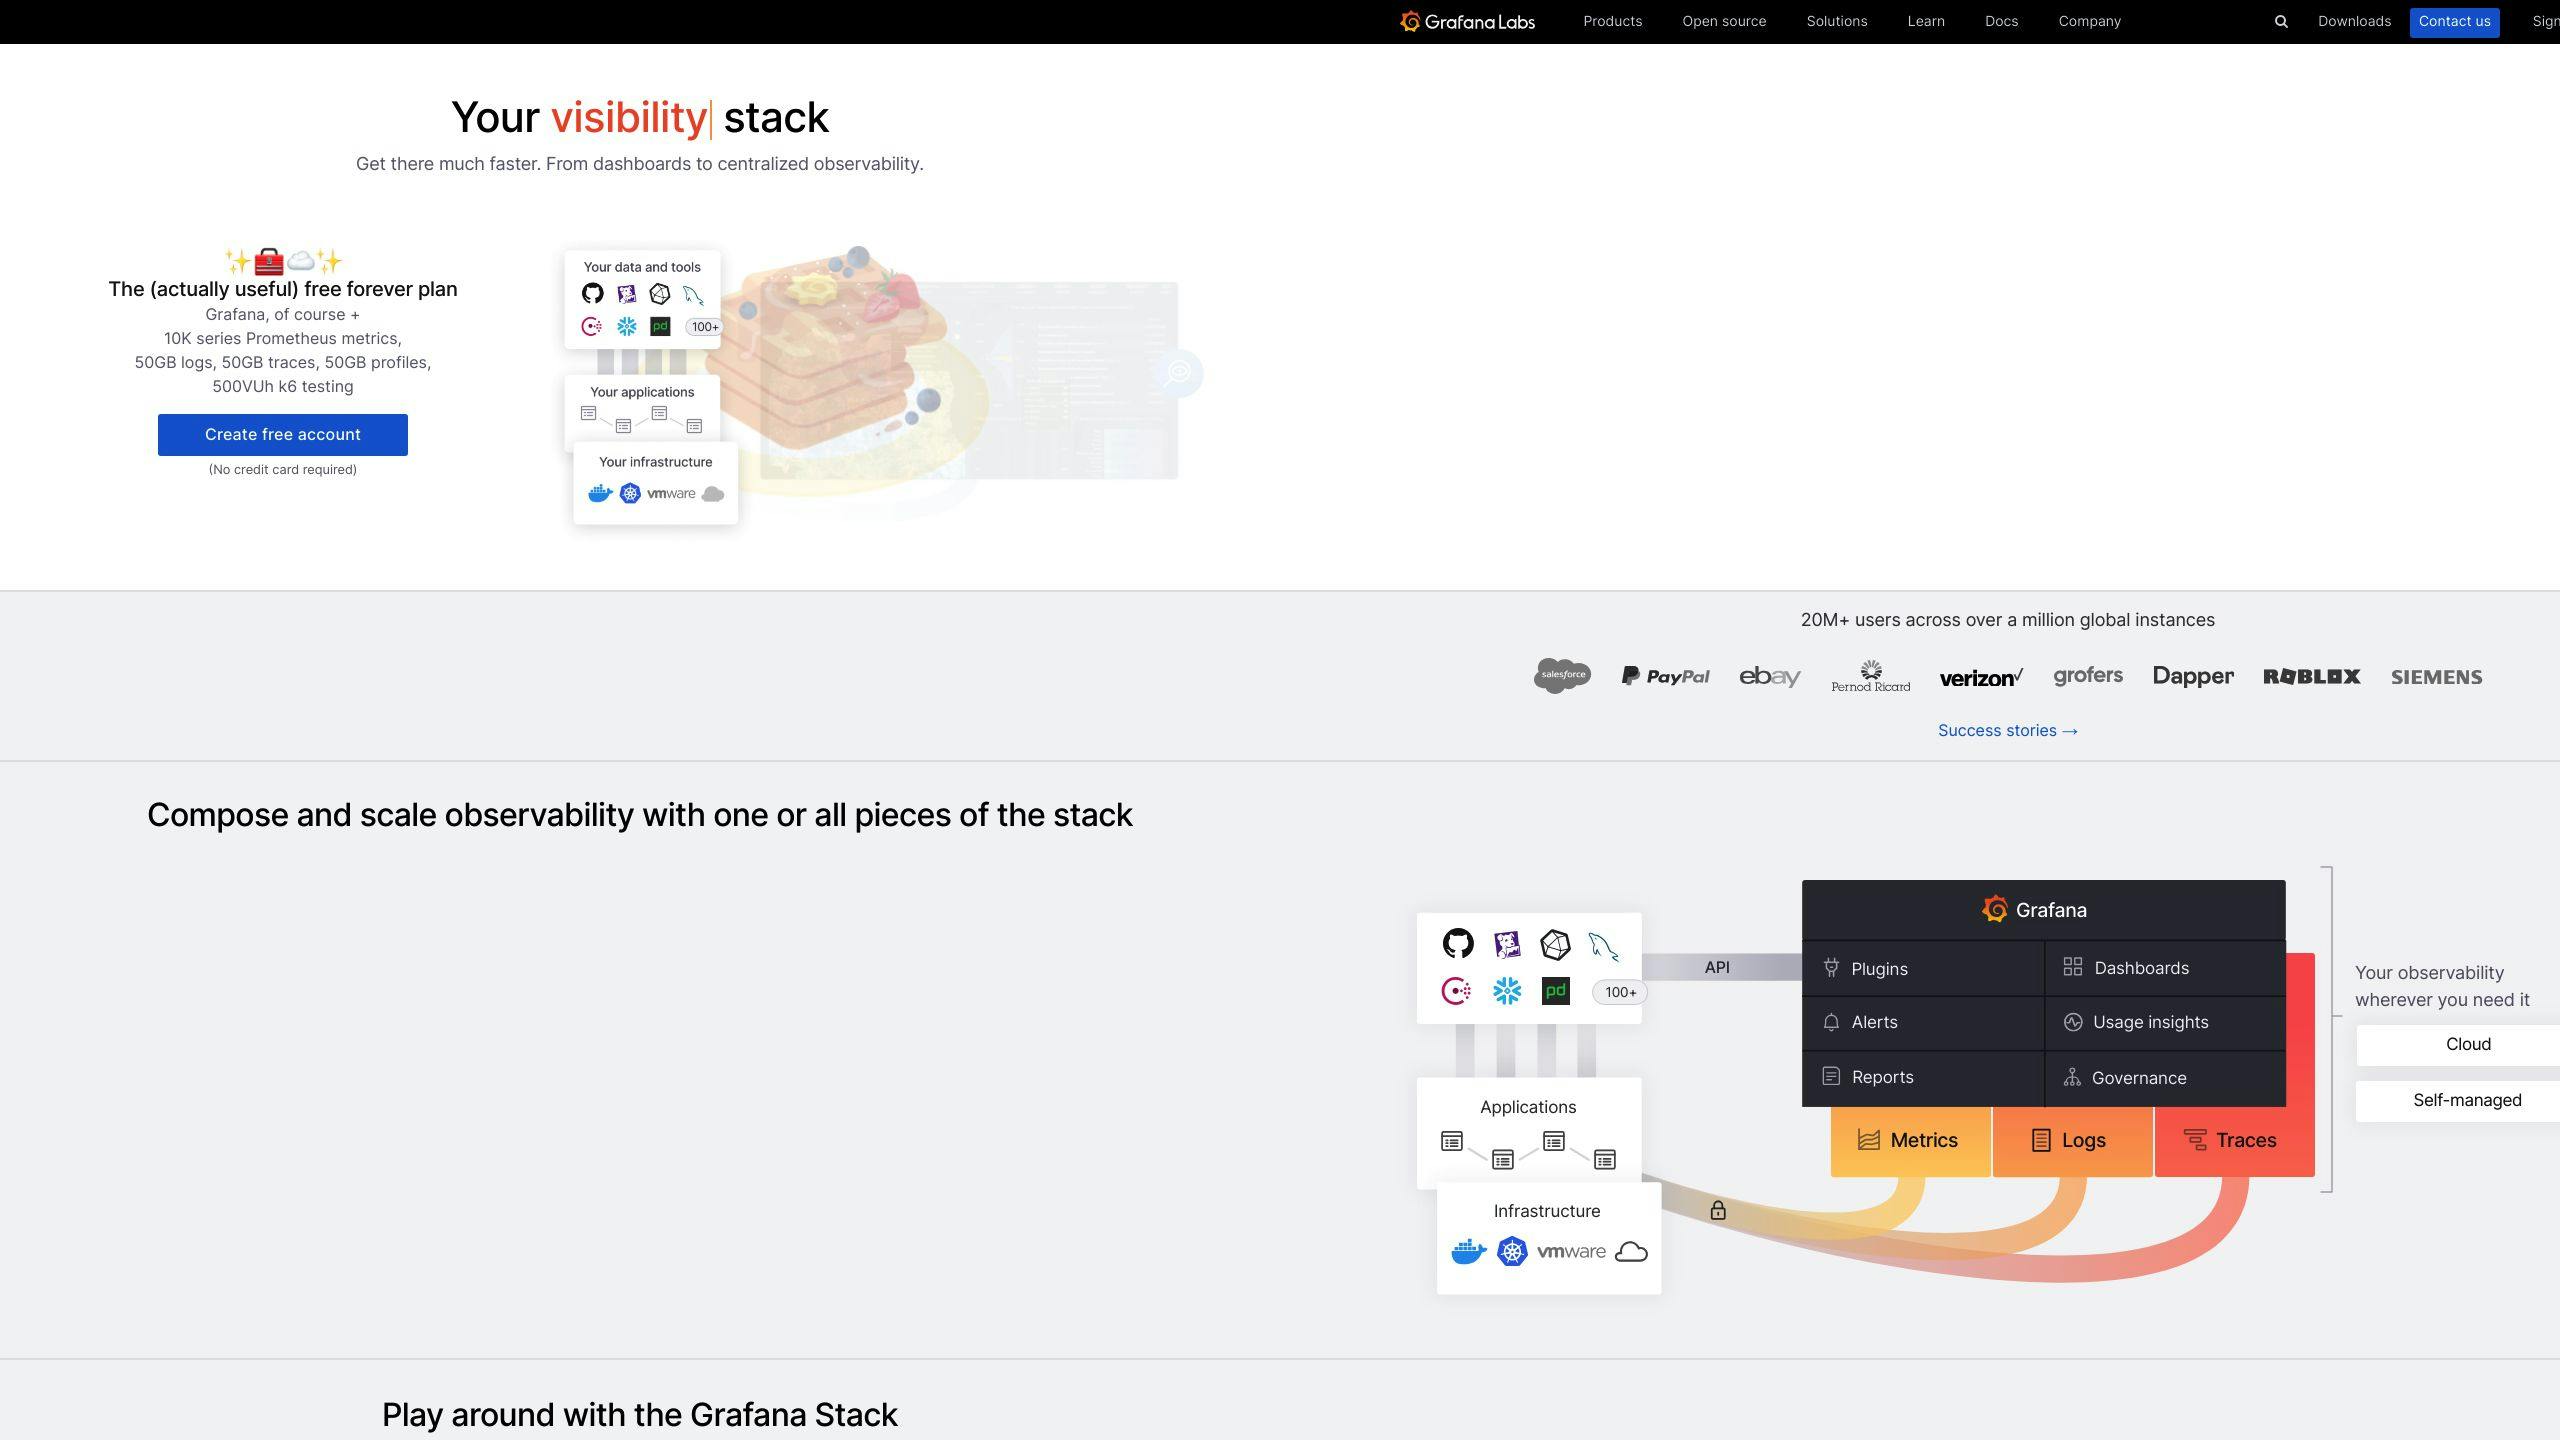
Grafana is a powerful open-source platform for data visualization and monitoring. It's a popular choice for gaining insights from time-series data.
Key features:
- Connects to over 150 data sources
- Rich, customizable visualizations
- Alerting system
- Open-source flexibility
Grafana's user base includes major players like Oracle, Citigroup, and JPMorgan Chase.
Comparing Grafana to Splunk:
| Feature | Grafana | Splunk |
|---|---|---|
| Data Sources | Wide range, including databases and APIs | Extensive support for logs and metrics |
| Visualization | Specialized for time-series data | Broad range of charts and graphs |
| Querying | Supports various query languages (SQL, PromQL) | Uses Splunk's Search Processing Language (SPL) |
| Dashboards | Highly customizable with drag-and-drop | User-friendly with many widget options |
Grafana 11 brings new features:
- Explore Metrics: Visualize Prometheus metrics without writing queries
- Enhanced Canvas panel: New flowcharting features and infinite panning
- AI-powered summaries: Automatically generate titles and descriptions for dashboards
Tips for using Grafana:
- Use subfolders to organize dashboards
- Take advantage of the Infinity data source plugin
- Explore Grafana Live for real-time data streaming
Grafana's CEO, Raj Dutt, highlighted the platform's evolution:
"Over the past 10 years, Grafana has seen over 43,000 commits to its open-source project, showing our commitment to continuous improvement and innovation."
Grafana provides a flexible, cost-effective solution for organizations that value customization and have the technical expertise to manage an open-source platform.
sbb-itb-9890dba
3. New Relic

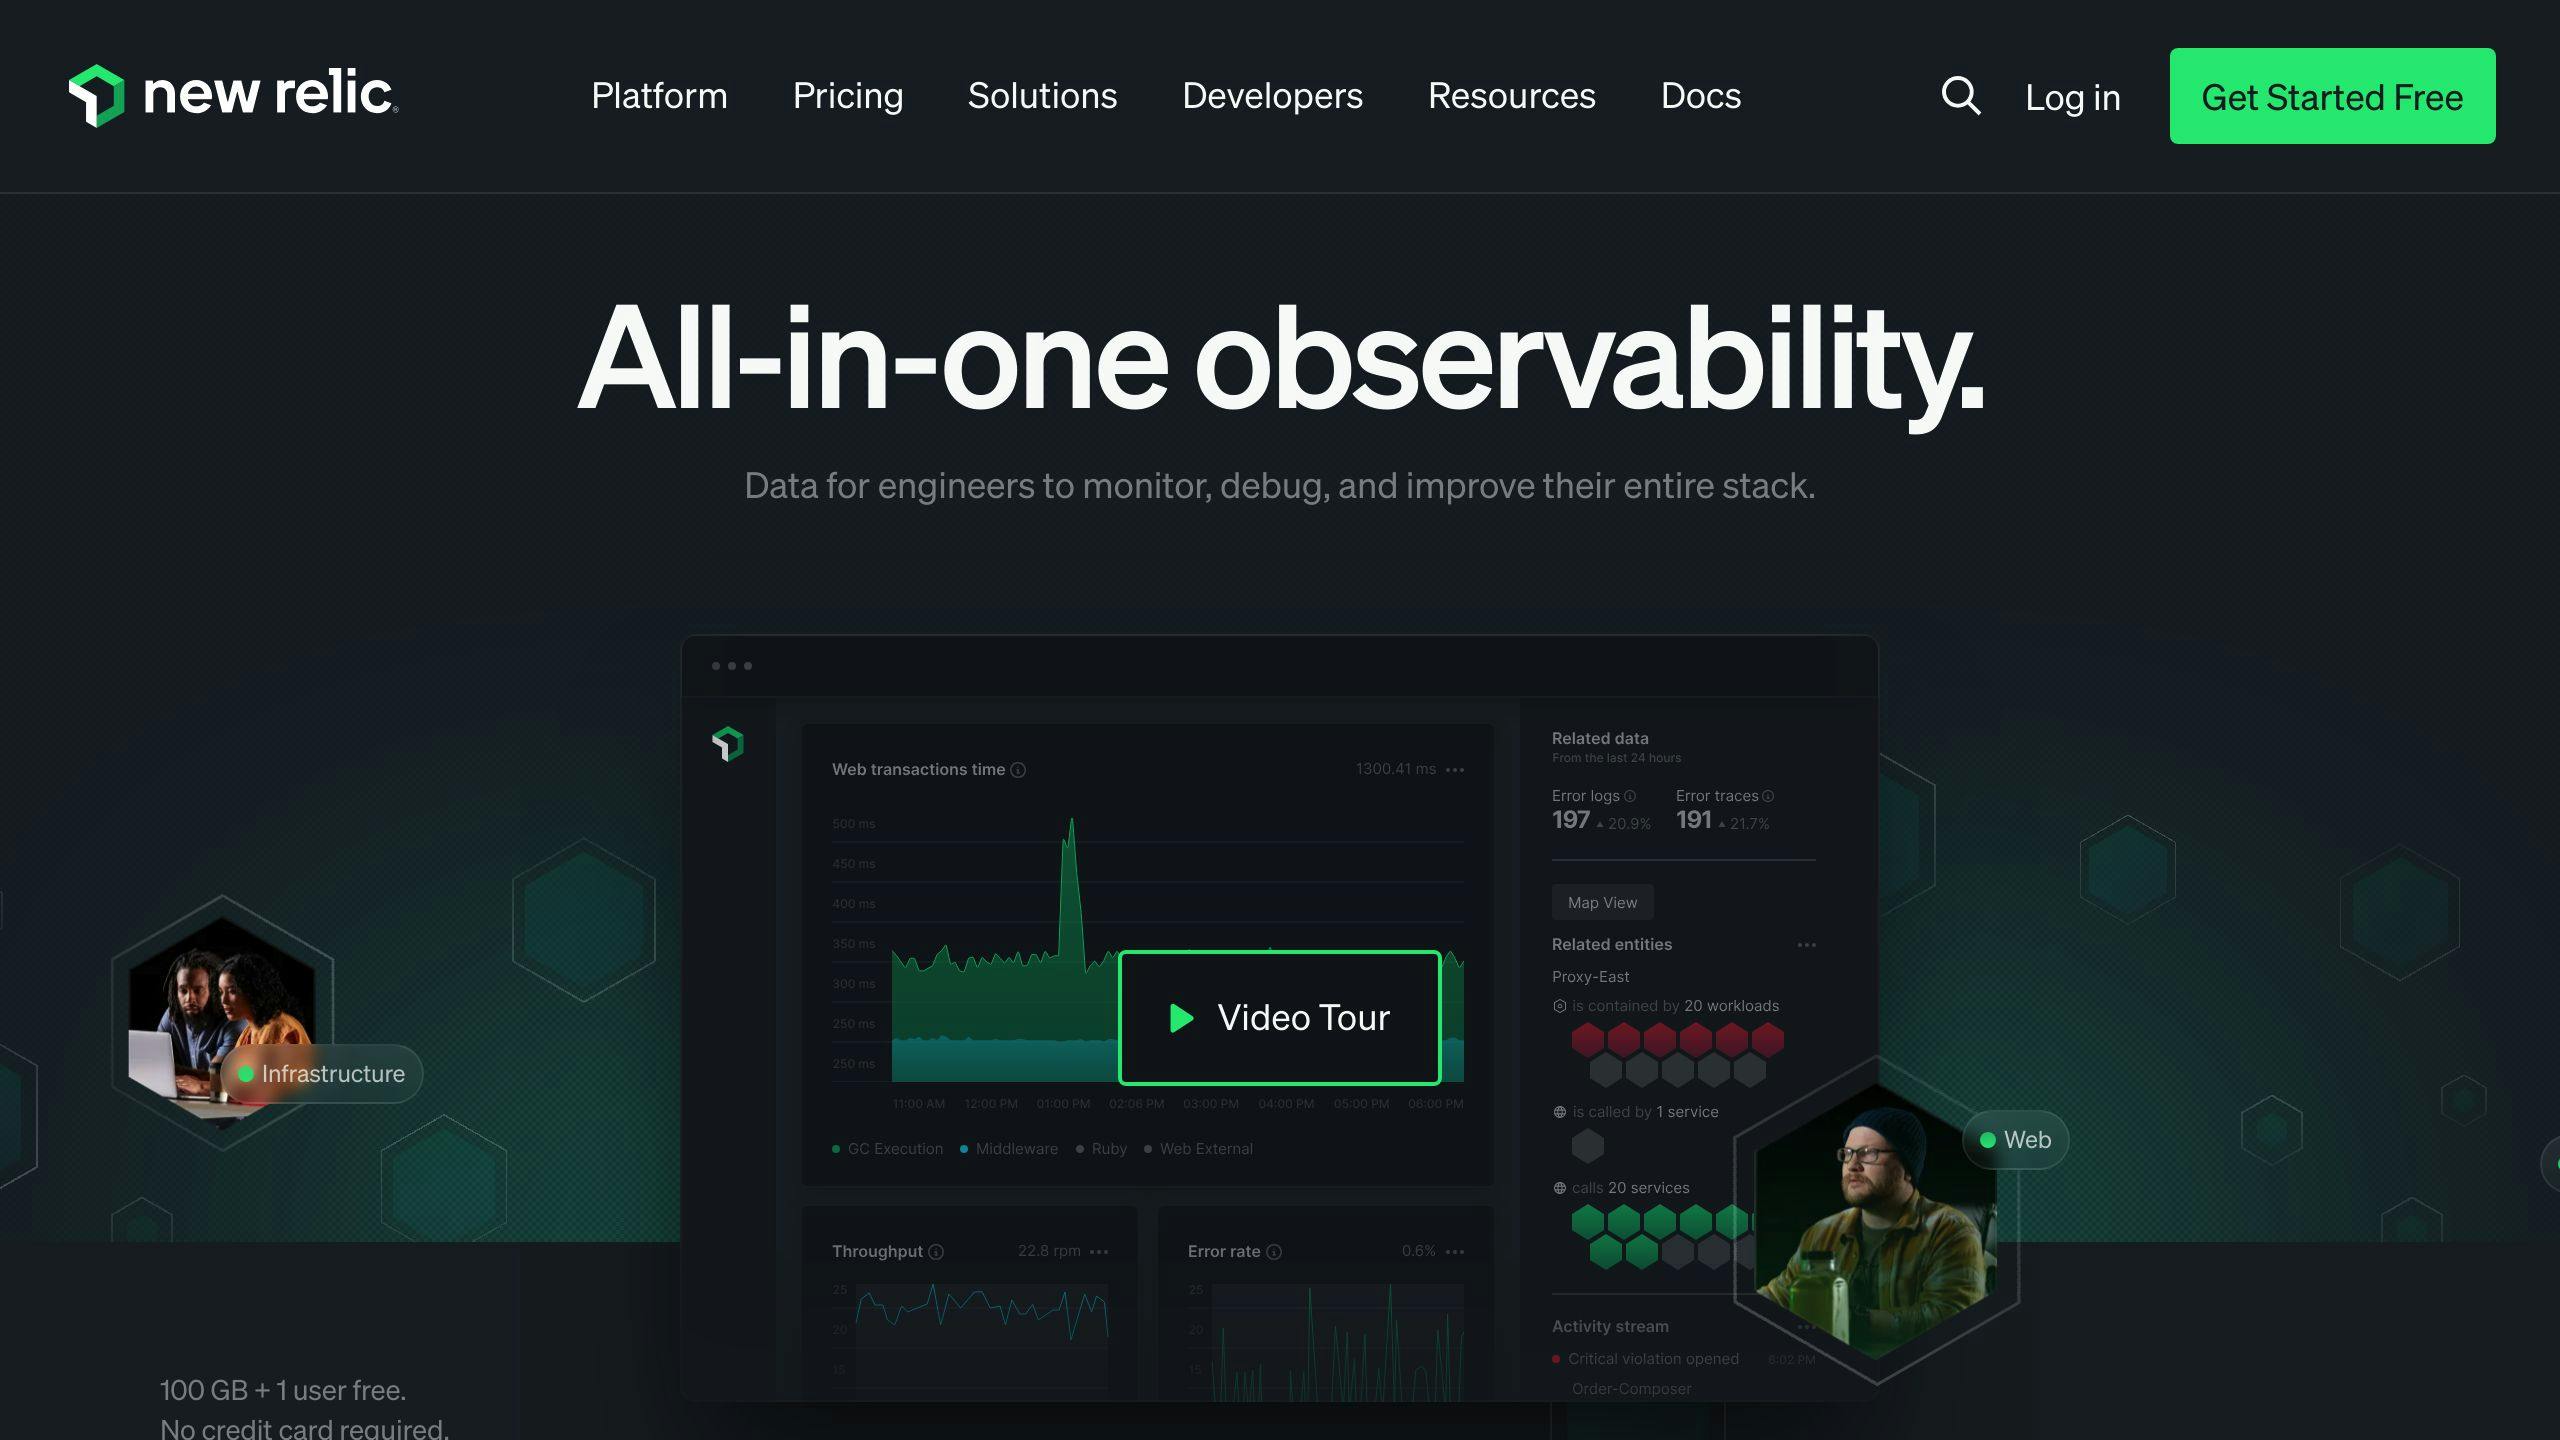
New Relic offers a full-stack observability platform covering a wide range of monitoring needs. It consolidates various monitoring aspects into a single platform, helping teams break down silos and gain a holistic view of their systems.
New Relic's platform includes:
- Application Performance Monitoring (APM)
- Infrastructure monitoring
- Log management
- Real User Monitoring (RUM)
- Synthetic monitoring
- Kubernetes monitoring
New Relic One brings together all observability data, allowing users to analyze, troubleshoot, and optimize their entire software stack from one interface.
New Relic's pricing model:
| Aspect | Details |
|---|---|
| Free Tier | 100 GB of data ingested per month |
| Standard Plan | $0.30 per GB of data ingested |
| Data Plus Plan | $0.50 per GB, with advanced features |
New Relic has stepped up its game in AI monitoring with over 60 integrations. The platform offers:
- Auto instrumentation for popular AI frameworks
- Full AI stack visibility
- Deep trace insights for every AI response
Arnie Lopez, Chief Customer Officer at New Relic, notes:
"Based on my conversations with CIOs, CTOs, and executives across our customer base, it is clear that every company is thinking about how to scale their business with AI."
New Relic's combination of features, pricing flexibility, and focus on AI monitoring makes it a strong contender in the observability space, especially for small to medium-sized businesses looking for a cost-effective, all-in-one solution.
4. Splunk

Splunk is a heavyweight in IT monitoring, offering a robust platform for data analysis and infrastructure monitoring. It's known for handling massive amounts of machine-generated data, making it a go-to choice for large enterprises.
Splunk's key features:
| Feature | Description |
|---|---|
| Data Ingestion | Can ingest and index all types of data from an entire stack |
| Real-time Processing | Offers real-time streaming analytics and instant visibility |
| Anomaly Detection | Uses advanced analytics and machine learning to spot issues |
| Customization | Provides customizable dashboards and alerting mechanisms |
| Security | Doubles as a SIEM solution, often used for compliance and auditing |
Splunk's Infrastructure Monitoring (IM) supports over 300 out-of-the-box integrations with popular open-source tools, cloud infrastructure, and services.
For complex environments, Splunk offers:
- A Kubernetes navigator for monitoring containerized applications
- Dynamic cluster maps for visualizing performance across systems
- Metrics pipeline management to control data volume and costs
However, Splunk has drawbacks:
- Steep learning curve
- High costs, especially as data volumes grow
The Uptime Institute's 2023 survey found that while outage rates are falling, their cost impact is rising, with over two-thirds of outages costing more than $100,000. This underscores the importance of robust monitoring tools like Splunk, but also the need to weigh costs carefully.
Splunk is best suited for large enterprises with complex IT environments. Smaller businesses or those with simpler needs might find Splunk's complexity and cost prohibitive.
5. Dynatrace

Dynatrace offers a robust end-to-end observability platform designed for modern infrastructures, focusing on distributed applications, user experience, and business intelligence.
Key features:
| Feature | Description |
|---|---|
| AI-Powered Analytics | Automatically detects anomalies and provides root cause analysis |
| OneAgent Technology | Scans and captures data from most infrastructure automatically |
| Cloud-Native Support | Designed for complex cloud environments including AWS, Azure, and Google Cloud |
| AIOps Capabilities | Helps IT teams manage multicloud and hybrid cloud environments |
Dynatrace's AI-driven approach adapts to dynamic environments and adjusts to application demands without manual intervention. It claims to cut mean time to resolution (MTTR) by up to 90%.
However, users often point out:
- A steeper learning curve compared to Datadog
- A more complex user interface
- Minimal out-of-the-box alerting and incident management features
Dynatrace uses a consumption-based pricing model. Full-stack monitoring starts at $74 per 8GB per host, with additional costs for tools like Application Security.
Dynatrace has earned industry recognition. In the 2024 Gartner Magic Quadrant for Observability Platforms, it was positioned highest for Ability to Execute and furthest for Completeness of Vision among 17 vendors.
For teams managing complex, cloud-native environments, Dynatrace's AI-powered automation and ecosystem compatibility make it a strong contender. But for those prioritizing ease of use or needing strong out-of-the-box alerting, other alternatives might be a better fit.
Wrap-up
Choosing the right monitoring tool is crucial for operational efficiency. Consider these factors:
- Know your needs (infrastructure size, tech stack complexity, budget)
- Consider the learning curve
- Look at integration capabilities
- Evaluate pricing models
- Test before you invest
- Consider open-source options
- Don't forget about support
Remember, the "best" tool depends on your specific requirements. Whether you choose Prometheus for its Kubernetes integration, Grafana for data visualization, or Dynatrace for AI-powered automation, focus on finding the perfect fit for your organization's unique needs and technical capabilities.


