Datadog's popular, but it's not the only game in town. Here's what you need to know about scaling observability:
Related video from YouTube
Key Alternatives
- ChaosSearch
- Checkly
- Prometheus
Why look elsewhere? High costs, complex billing, and custom metrics pricing challenges with Datadog. Plus, 94% of cloud decision-makers report rising storage costs.
Quick comparison:
| Tool | Best For | Key Advantage | Main Limitation |
|---|---|---|---|
| ChaosSearch | Log analytics | Direct S3 integration | Limited metrics monitoring |
| Checkly | API/E2E monitoring | Code-first approach | Narrow focus on synthetic monitoring |
| Prometheus | Metrics collection | Open-source, cost-effective | Long-term storage challenges |
1. ChaosSearch

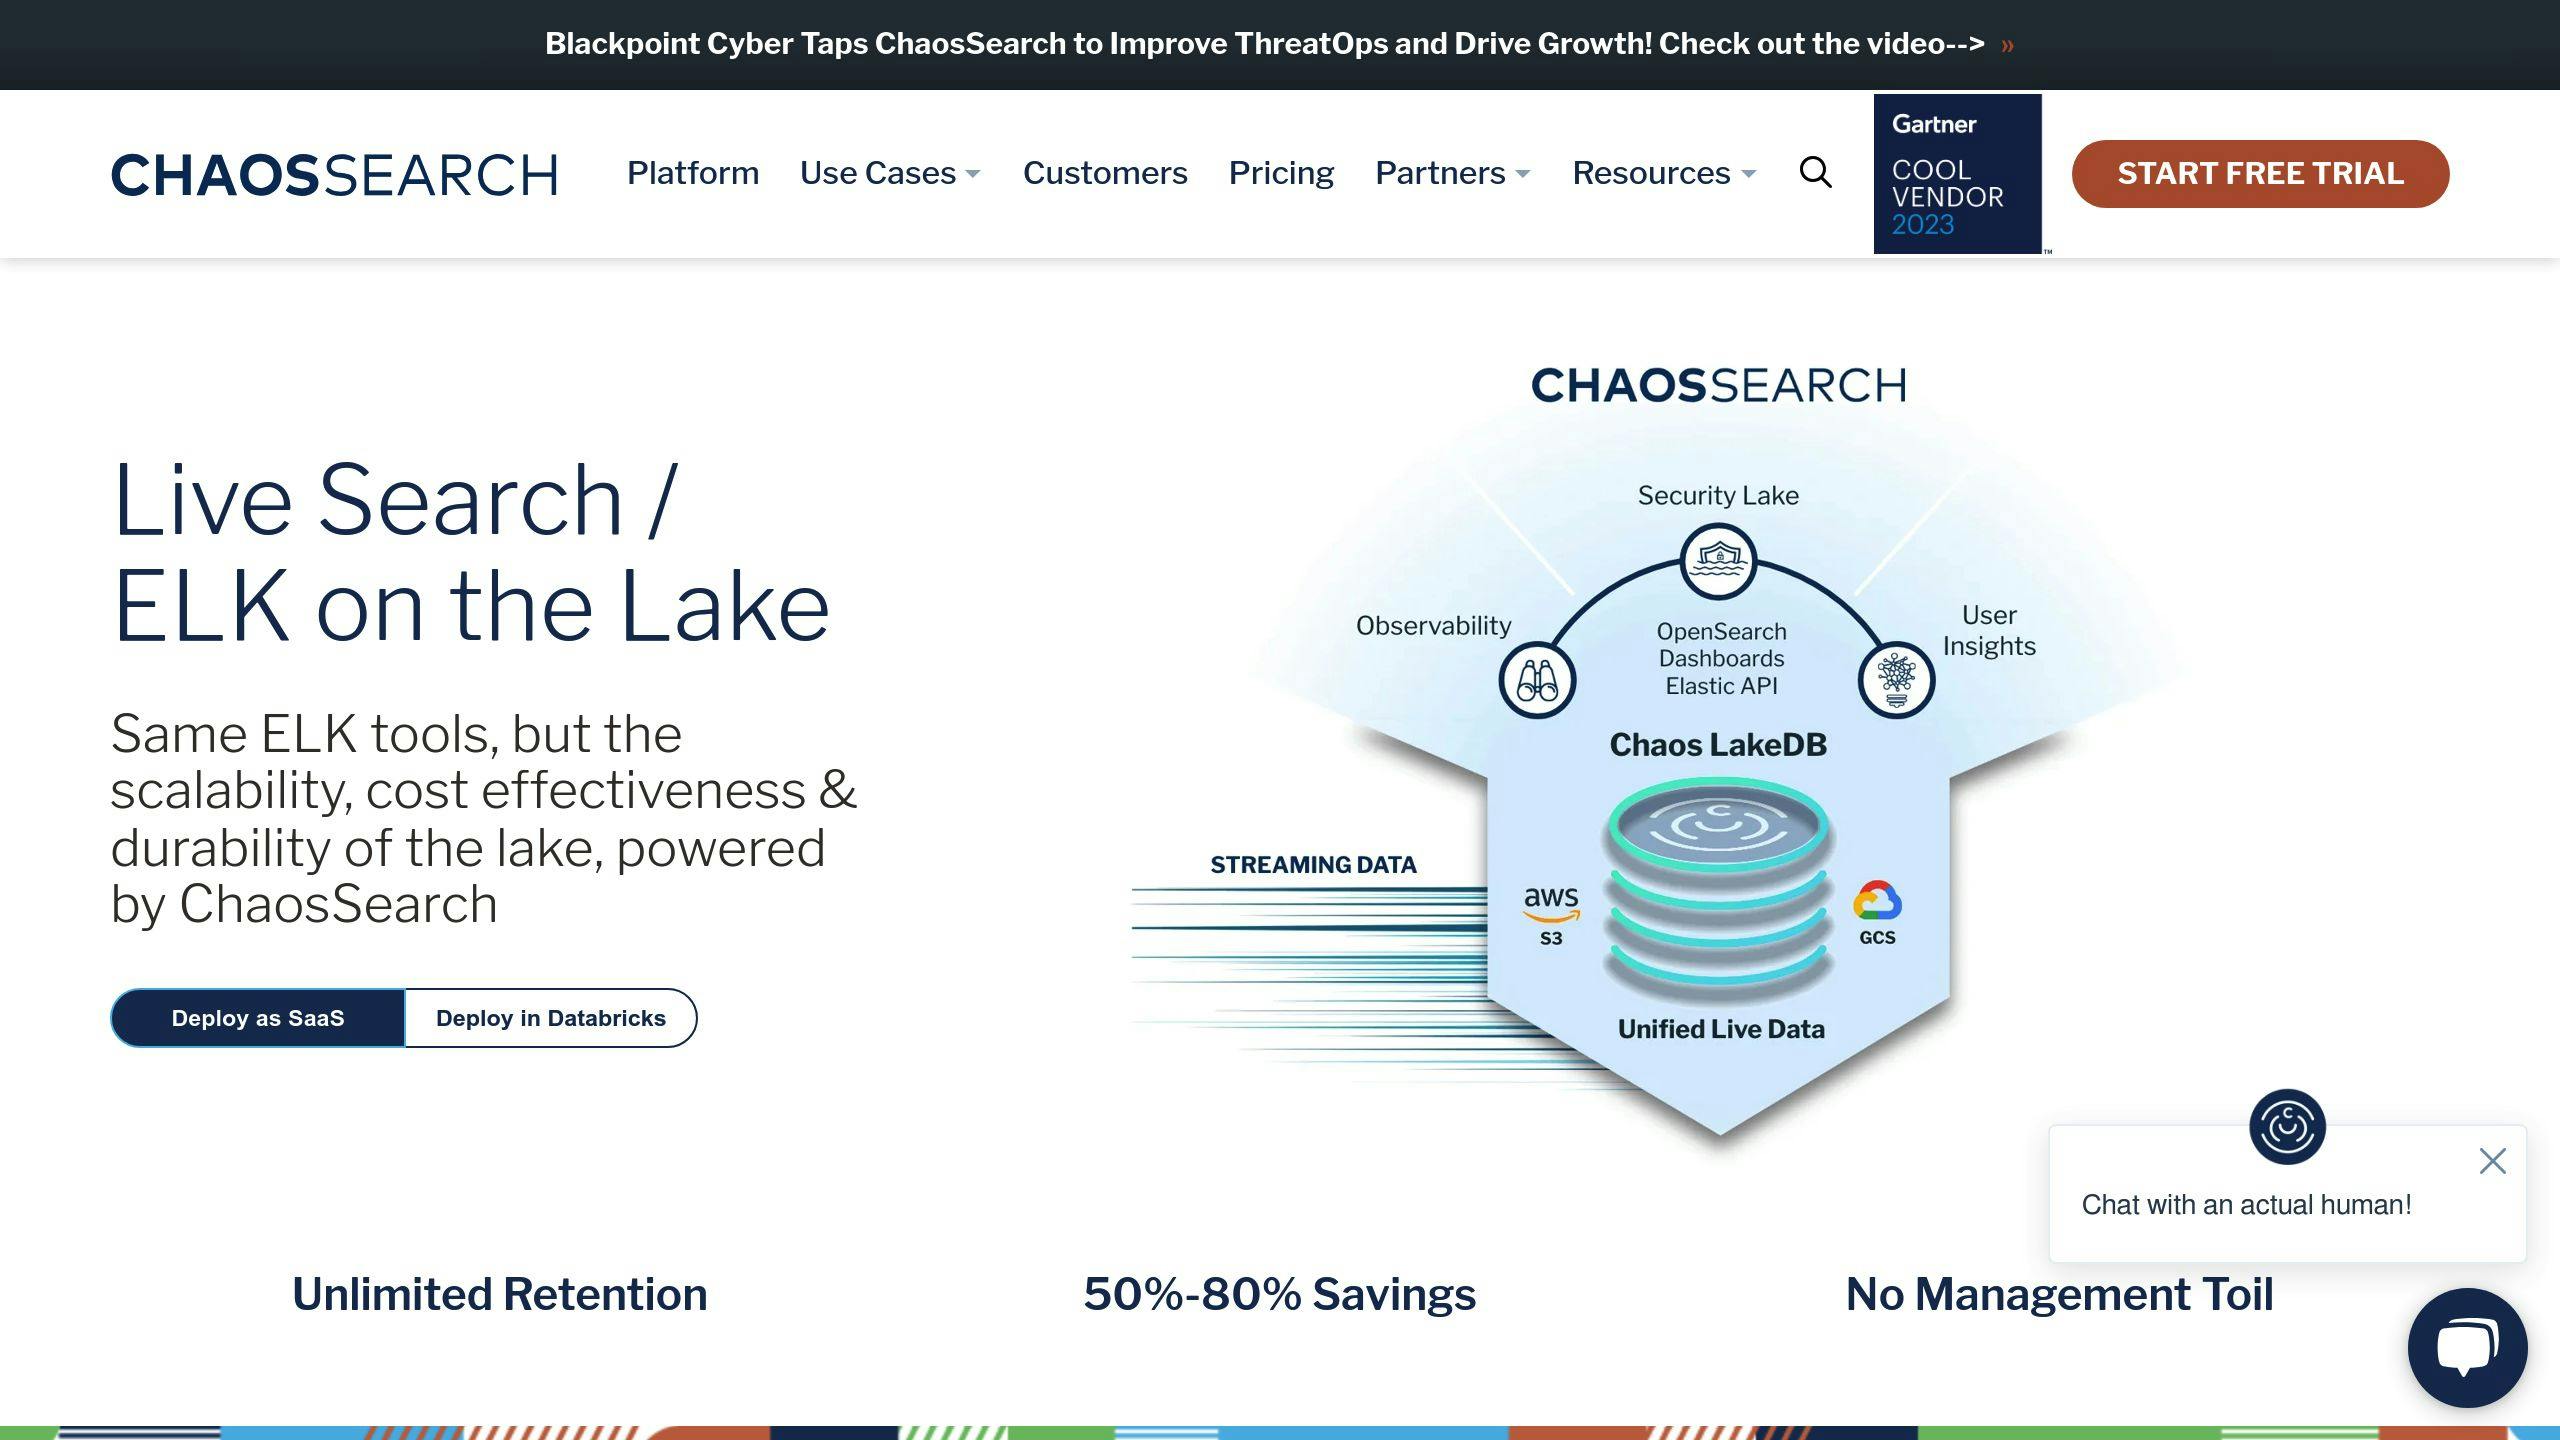
ChaosSearch transforms log analytics:
- Indexes data directly in Amazon S3
- Supports full text search, SQL, and machine learning
- Cost-effective data retention
Pricing starts at $750/month. It's efficient too - transformations that used to take weeks now take minutes.
"ChaosSearch has transformed how we think about log analytics", says Adam Dutko, VP of Cloud Engineering at Sixth Street.
In 2023, they launched Chaos LakeDB for generative AI, SQL, and Live Search.
2. Checkly

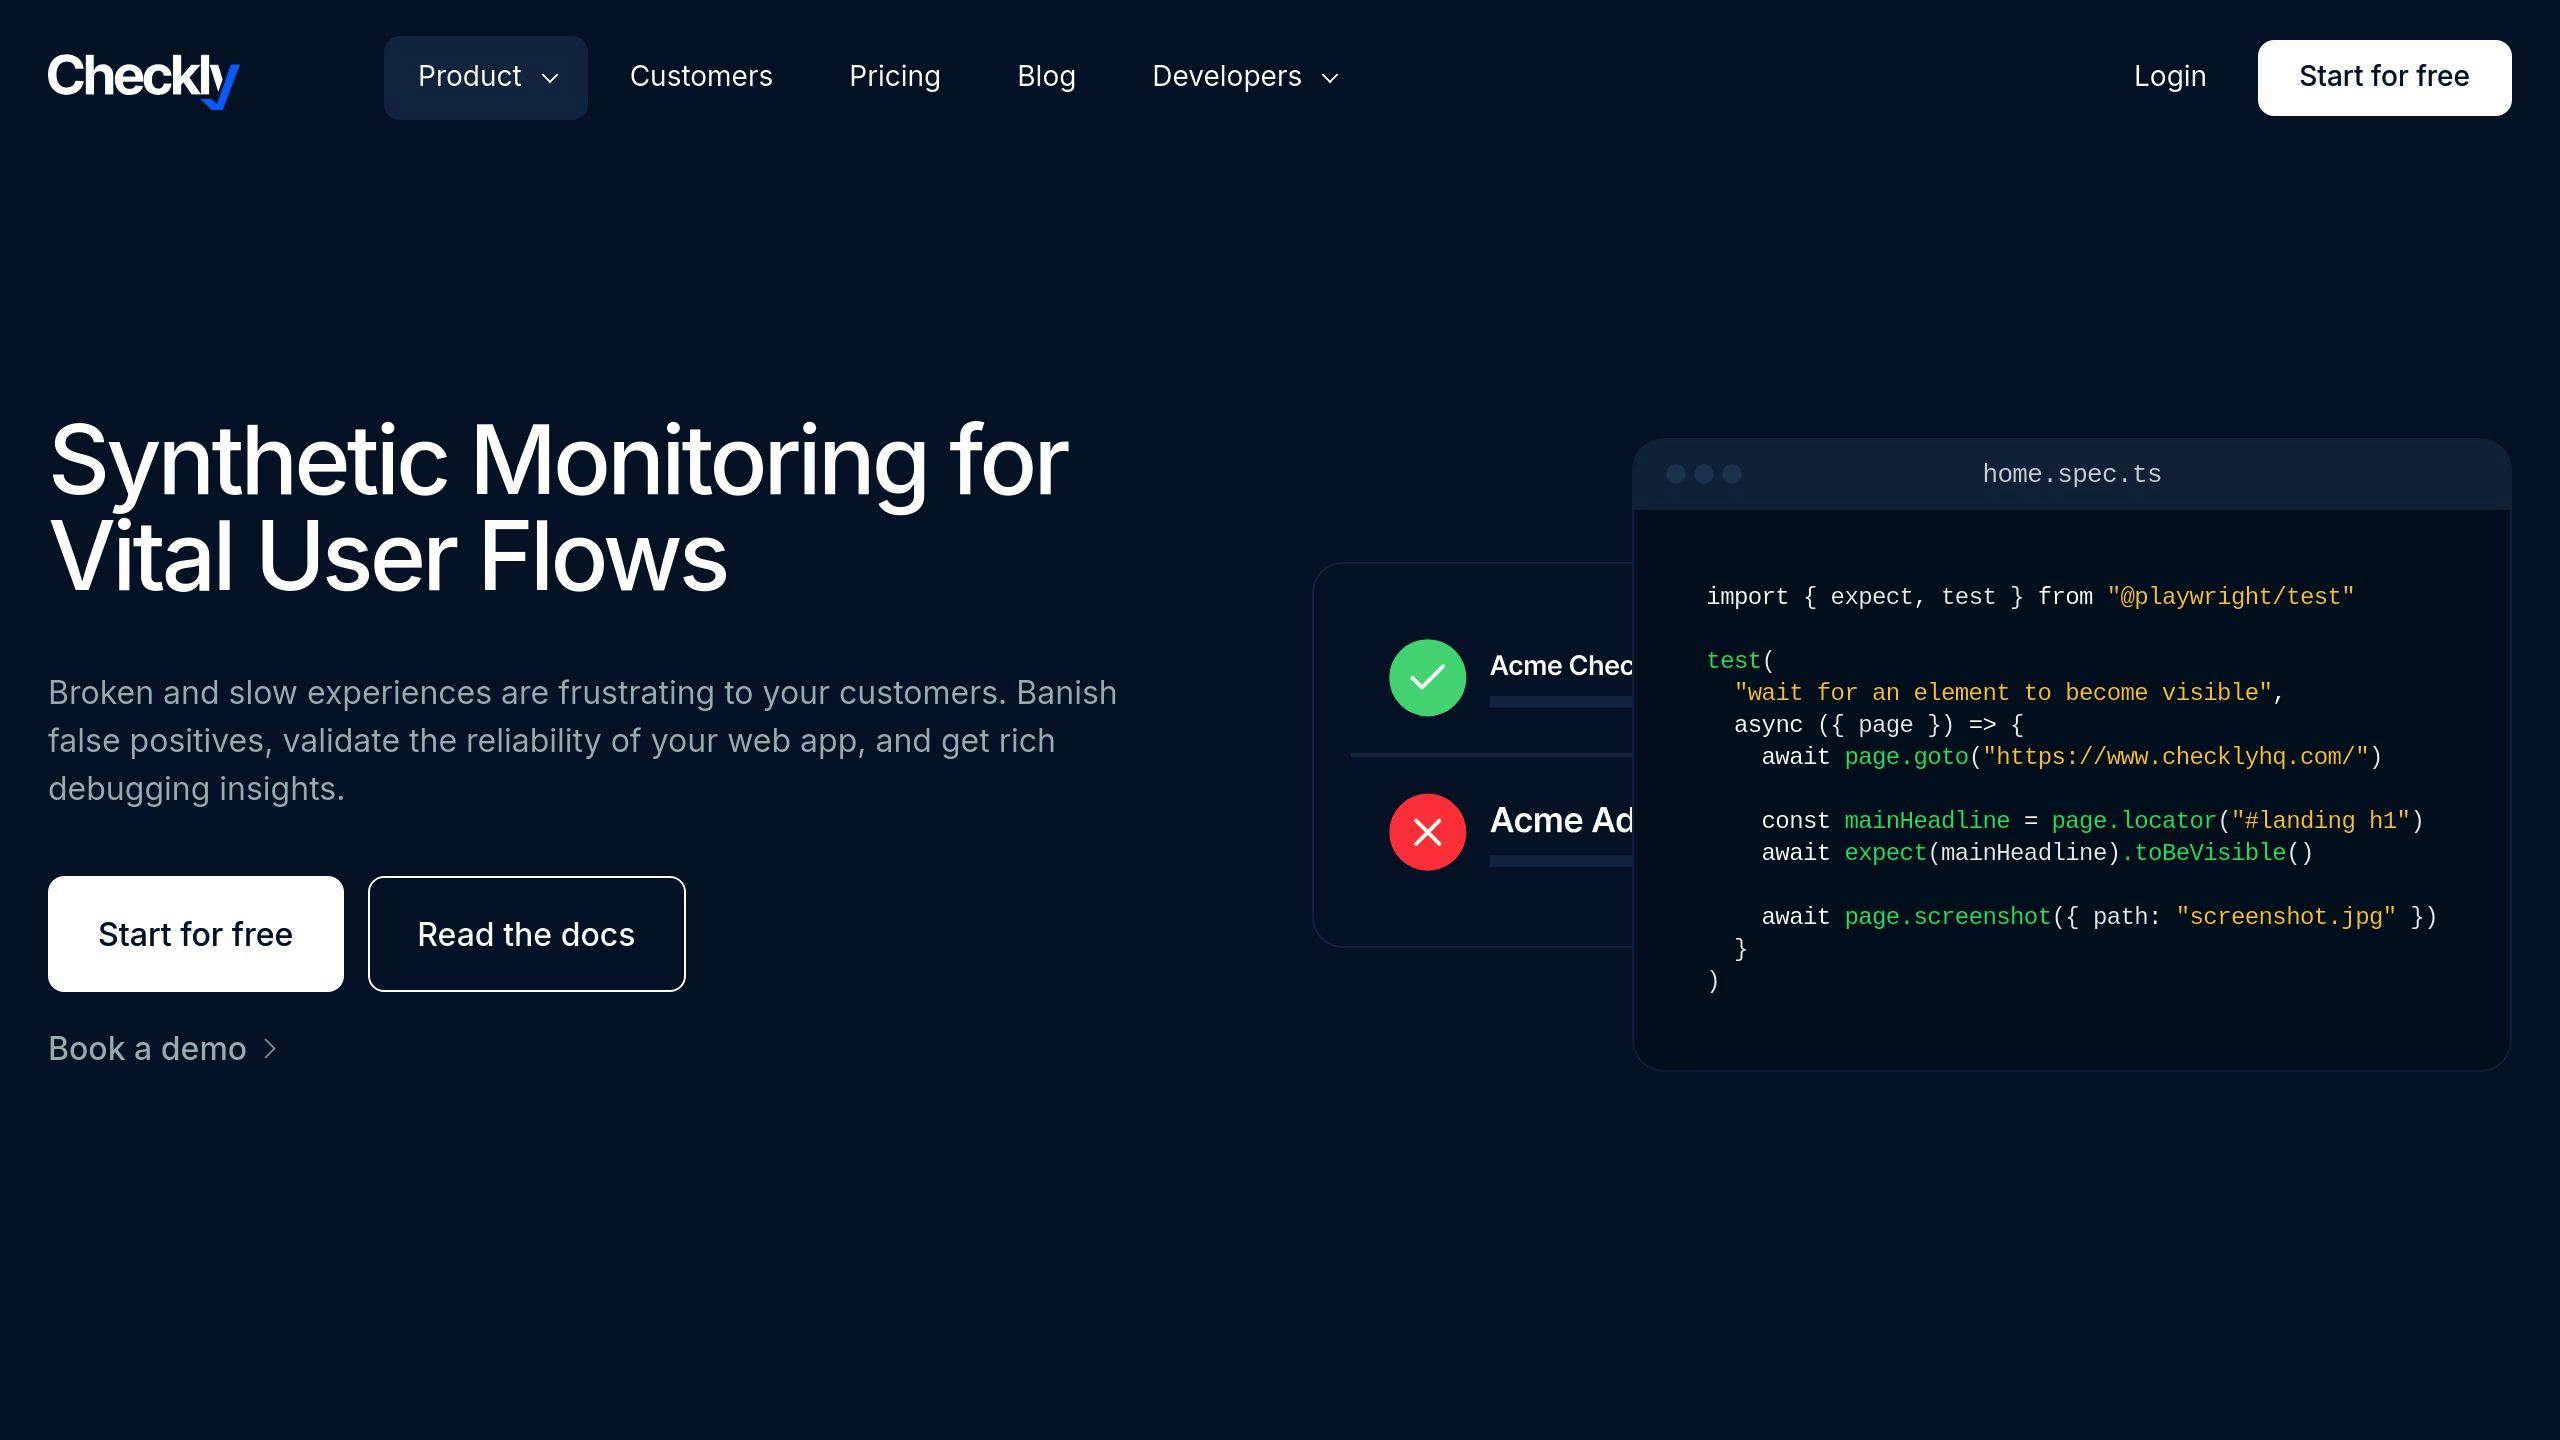
Checkly offers code-first synthetic monitoring:
- API and E2E monitoring in real Chrome browsers
- Global coverage from 20+ locations
- Up to 80% cost savings vs. legacy providers
Pricing comparison:
| Service | Checkly | Datadog |
|---|---|---|
| 10,000 API runs | $2 | $7 |
| 1,000 Browser runs | $5 | $18 |
It integrates smoothly with development workflows.
"Checkly gives us real-time feedback on what is and isn't working", says Thomas Reither from Solutia.
sbb-itb-9890dba
3. Prometheus

Prometheus is an open-source monitoring powerhouse:
- Pull-based model
- Time series database
- PromQL query language
- Dynamic service discovery
Comparison with Datadog:
| Aspect | Prometheus | Datadog |
|---|---|---|
| Collection Model | Pull-based | Push-based |
| Query Language | PromQL | Custom |
| Visualization | Basic UI, often with Grafana | Built-in dashboards |
| Scalability | Horizontal scaling possible | Built-in scalability |
Prometheus supports four metric types: counters, gauges, histograms, and summaries.
Example PromQL query:
increase(http_requests_total{job="api-server"}[5m])
Strengths and Weaknesses
| Tool | Strengths | Weaknesses |
|---|---|---|
| ChaosSearch | Efficient log management, scalable | Limited metrics monitoring |
| Checkly | Strong API/website monitoring | Narrow focus on synthetic monitoring |
| Prometheus | Powerful metrics collection, open-source | Limited built-in visualization |
Wrap-up
Open-source options:
| Tool | Key Features | Best For |
|---|---|---|
| Prometheus | Metrics collection, querying | Cloud-native environments |
| Grafana | Data visualization | Flexible dashboards |
| OpenTelemetry | Telemetry data collection | Comprehensive observability |
Commercial alternatives:
| Tool | Strengths | Considerations |
|---|---|---|
| Dynatrace | AI-powered insights | Higher cost, slower ROI |
| New Relic | User-friendly interface | Can be expensive at scale |
| ChaosSearch | Efficient log management | Limited metrics monitoring |
Choose based on your needs, budget, scalability requirements, and existing tech stack.
FAQs
What is observability Datadog?

Datadog Observability Pipelines collects, processes, and routes logs. It's popular, but not the only option.
- Gojek switched to Cortex for massive scale monitoring.
- A crypto company got hit with a $65 million Datadog bill.
The best solution depends on your infrastructure, budget, feature needs, and tech stack.


