Datadog's popular, but other options might suit you better. Here's why:
- Datadog can get pricey and unpredictable
- Some alternatives offer clearer, cheaper pricing
- Other tools may have features you need
- Open-source options give more flexibility
Top Datadog alternatives:
Quick comparison:
| Alternative | Strength | Potential Drawback |
|---|---|---|
| AWS CloudWatch | AWS integration | AWS-focused |
| LogicMonitor | AIOps | Weaker network monitoring |
| IBM Instana | Full-stack observability | Pricing not public |
| New Relic | Strong APM | User-based pricing can add up |
| Splunk | Enterprise security | Costly for small teams |
| Dynatrace | AI-powered insights | Steeper learning curve |
| AppDynamics | Code-level diagnostics | Complex setup |
| Sumo Logic | AI-driven analytics | Smaller market share |
Consider your needs, budget, and team's skills. Try free trials to find the best fit.
Related video from YouTube
1. Amazon Web Services (AWS) CloudWatch
AWS CloudWatch monitors AWS resources and on-premises systems since 2009. Key features:
- Infrastructure monitoring
- Log management
- Basic APM
- ML-powered anomaly detection
CloudWatch shines with AWS integration, auto-collecting metrics from EC2, RDS, and Lambda.
| Feature | Details |
|---|---|
| Metrics Collection | Auto for AWS, custom available |
| Log Management | Aggregation, search, monitoring |
| Anomaly Detection | ML-powered historical analysis |
| Alerting | Configurable metric/anomaly alarms |
Pay-as-you-go pricing can be cost-effective for small setups, but watch out for larger deployments:
- EC2 Detailed Monitoring: $2.10/instance/month (7 metrics)
- Log data: $0.50/GB after first 5 GB (free)
CloudWatch fits AWS-focused businesses, solo engineers, and small startups. But it has limits:
- Basic APM compared to specialized tools
- Limited multi-cloud support
Support tiers:
- Basic: Included
- Developer: From $29/month, business hours
- Enterprise: From $15,000/month, 15-min critical response
Weigh these factors against your needs when considering CloudWatch.
2. LogicMonitor
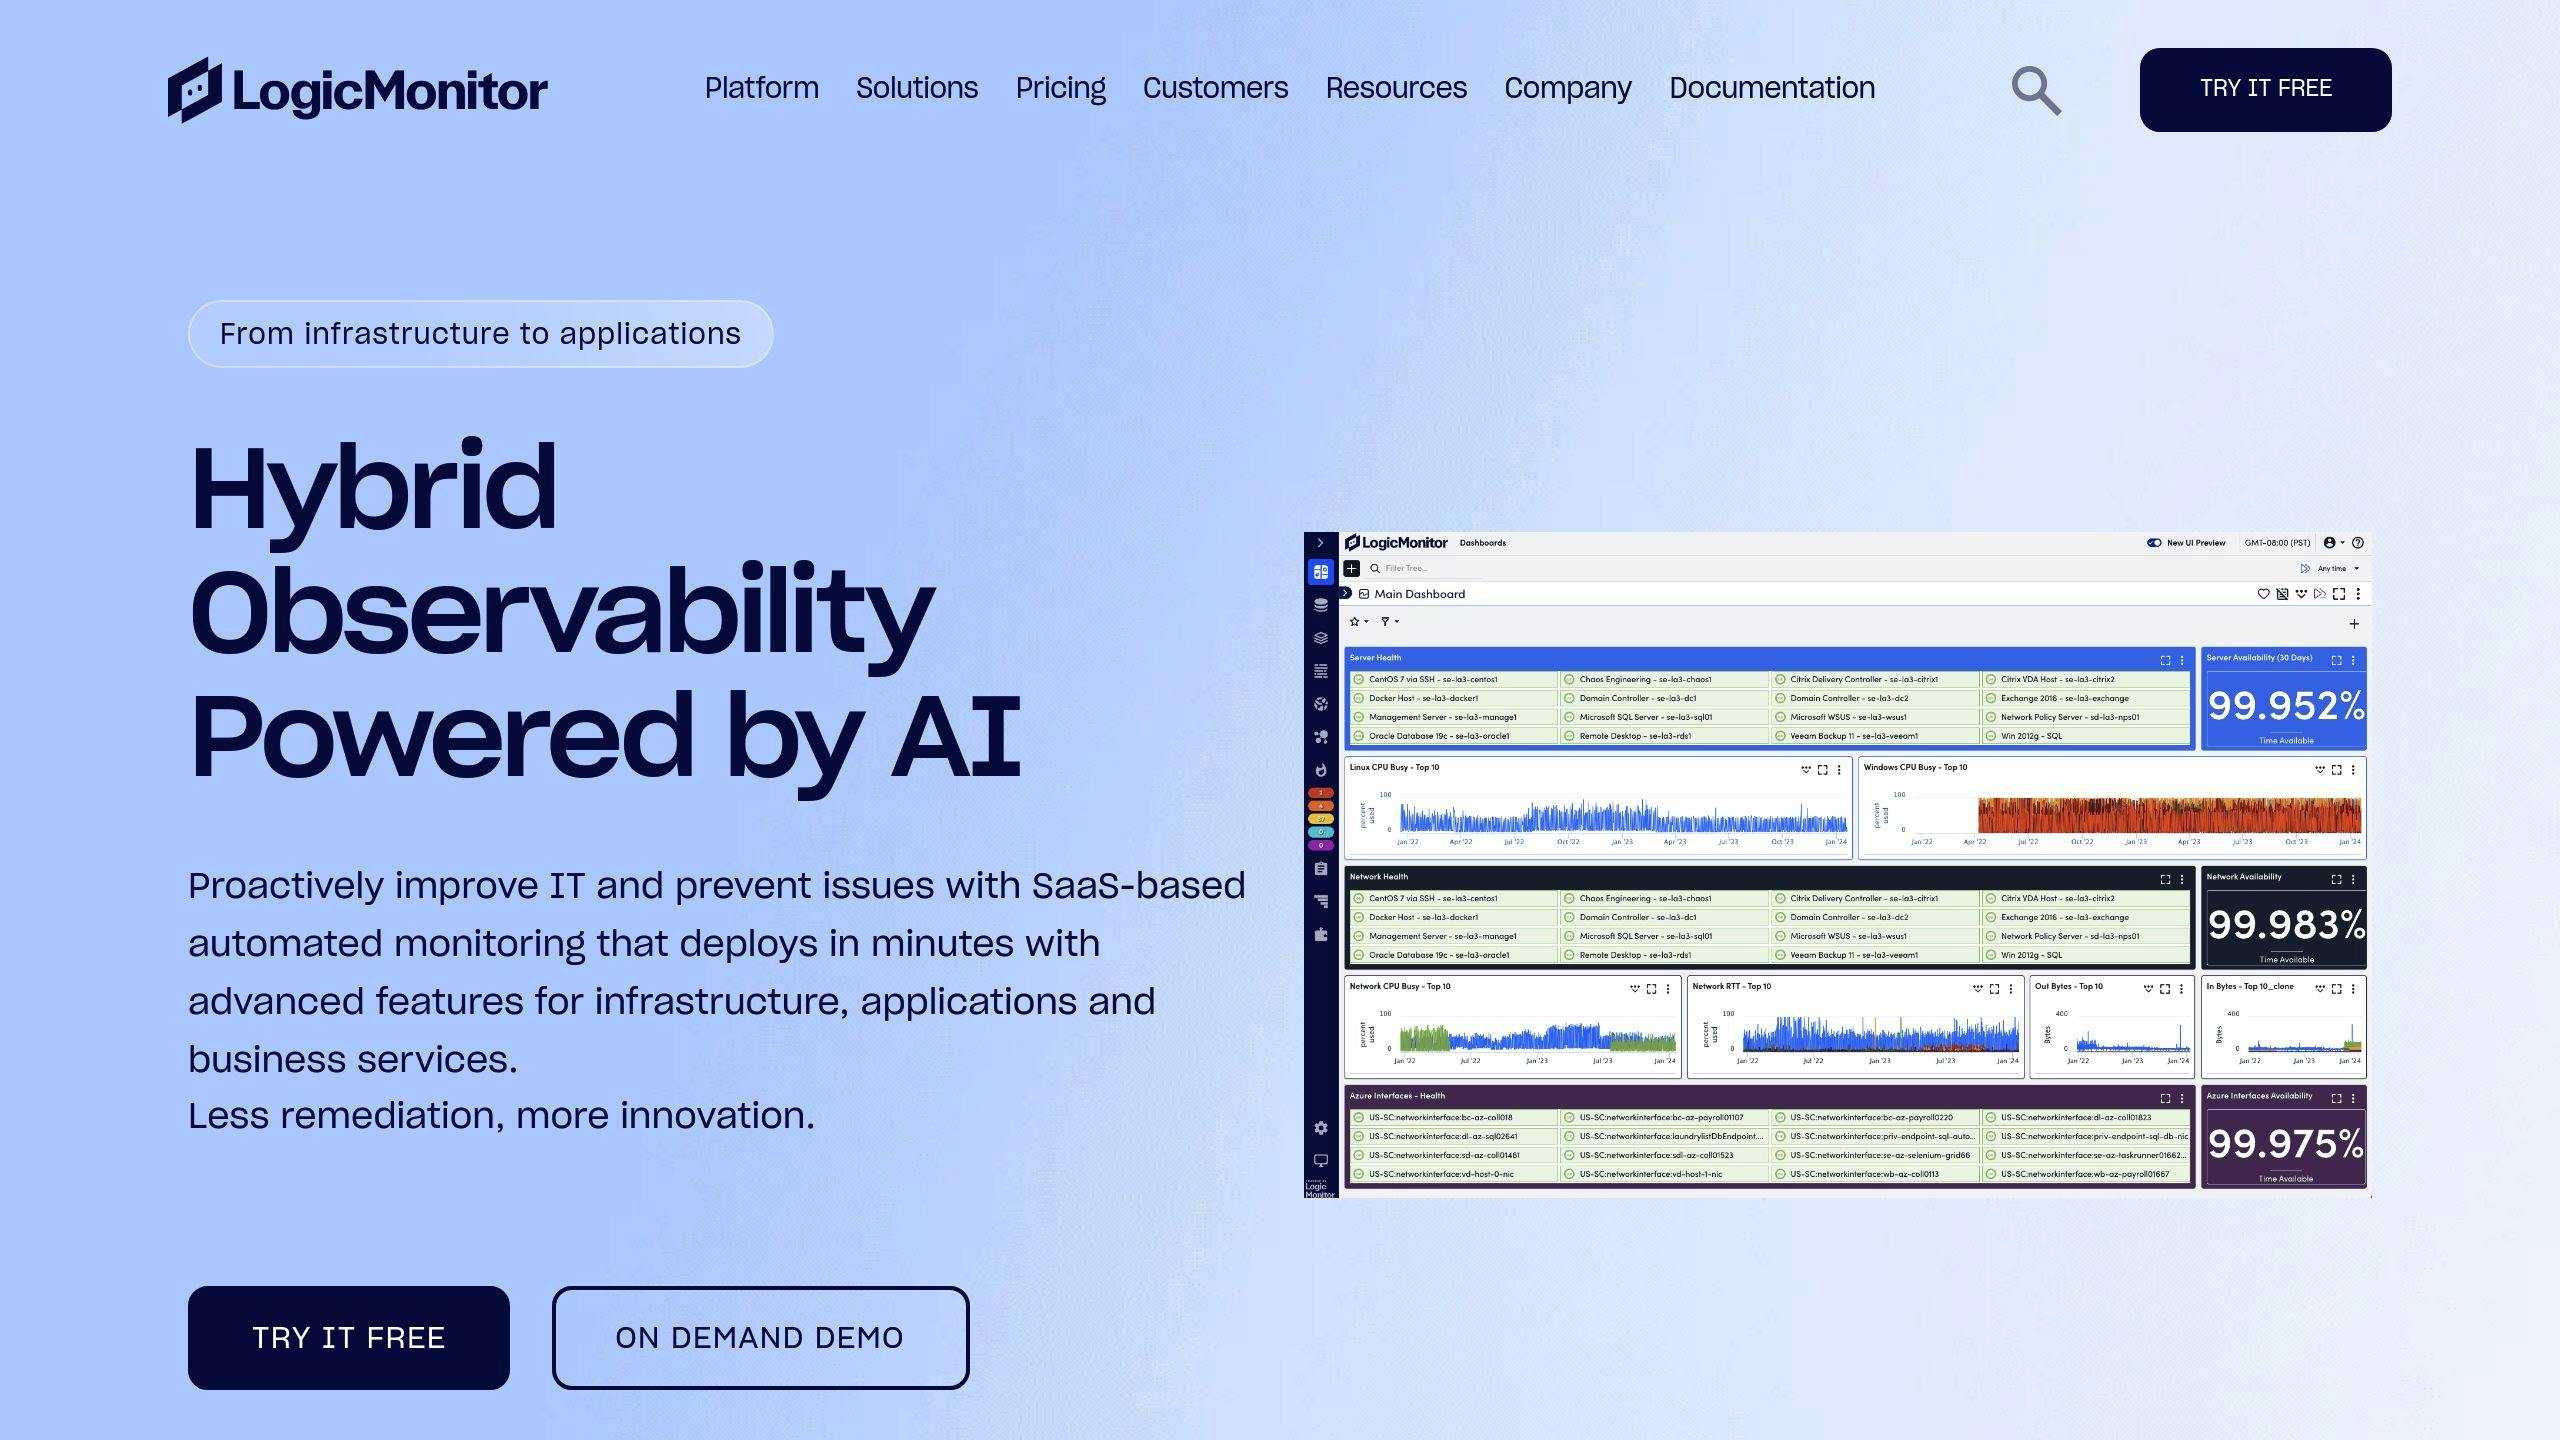
LogicMonitor is a SaaS platform for IT infrastructure monitoring. It works with cloud, on-premises, and hybrid setups.
Key features:
- Auto monitoring and device discovery
- Custom dashboards
- Alerting
- AIOps
- 2000+ pre-configured integrations
LogicMonitor's AI capabilities stand out. In 2023, they launched Dexda for Hybrid Observability, using ML and NLP for automated insights.
"Being on the bleeding edge of technology requires shifting the organizational mindset from reactive responses to proactive insights." - Christina Kosmowski, CEO, LogicMonitor.
This AI approach helps identify and solve problems faster.
Pricing is consumption-based, focusing on data ingested. Two main plans:
| Plan | Key Features |
|---|---|
| Pro | Infrastructure monitoring, alerting, reporting, role-based access, 24/7 support |
| Enterprise | Pro features + advanced forecasting, anomaly detection, log analysis |
LogicMonitor excels for enterprises and MSPs managing complex, hybrid environments. But watch out for increasing costs with usage.
One user noted: "LogicMonitor is three times more expensive than our previous solution, and it gets more expensive every year."
Another praised its value: "LogicMonitor offers real-time alerting and it's cheap quickly deployed and integrated into any of the systems."
Request a detailed quote and use the 14-day trial to test LogicMonitor in your environment before deciding.
3. IBM Instana
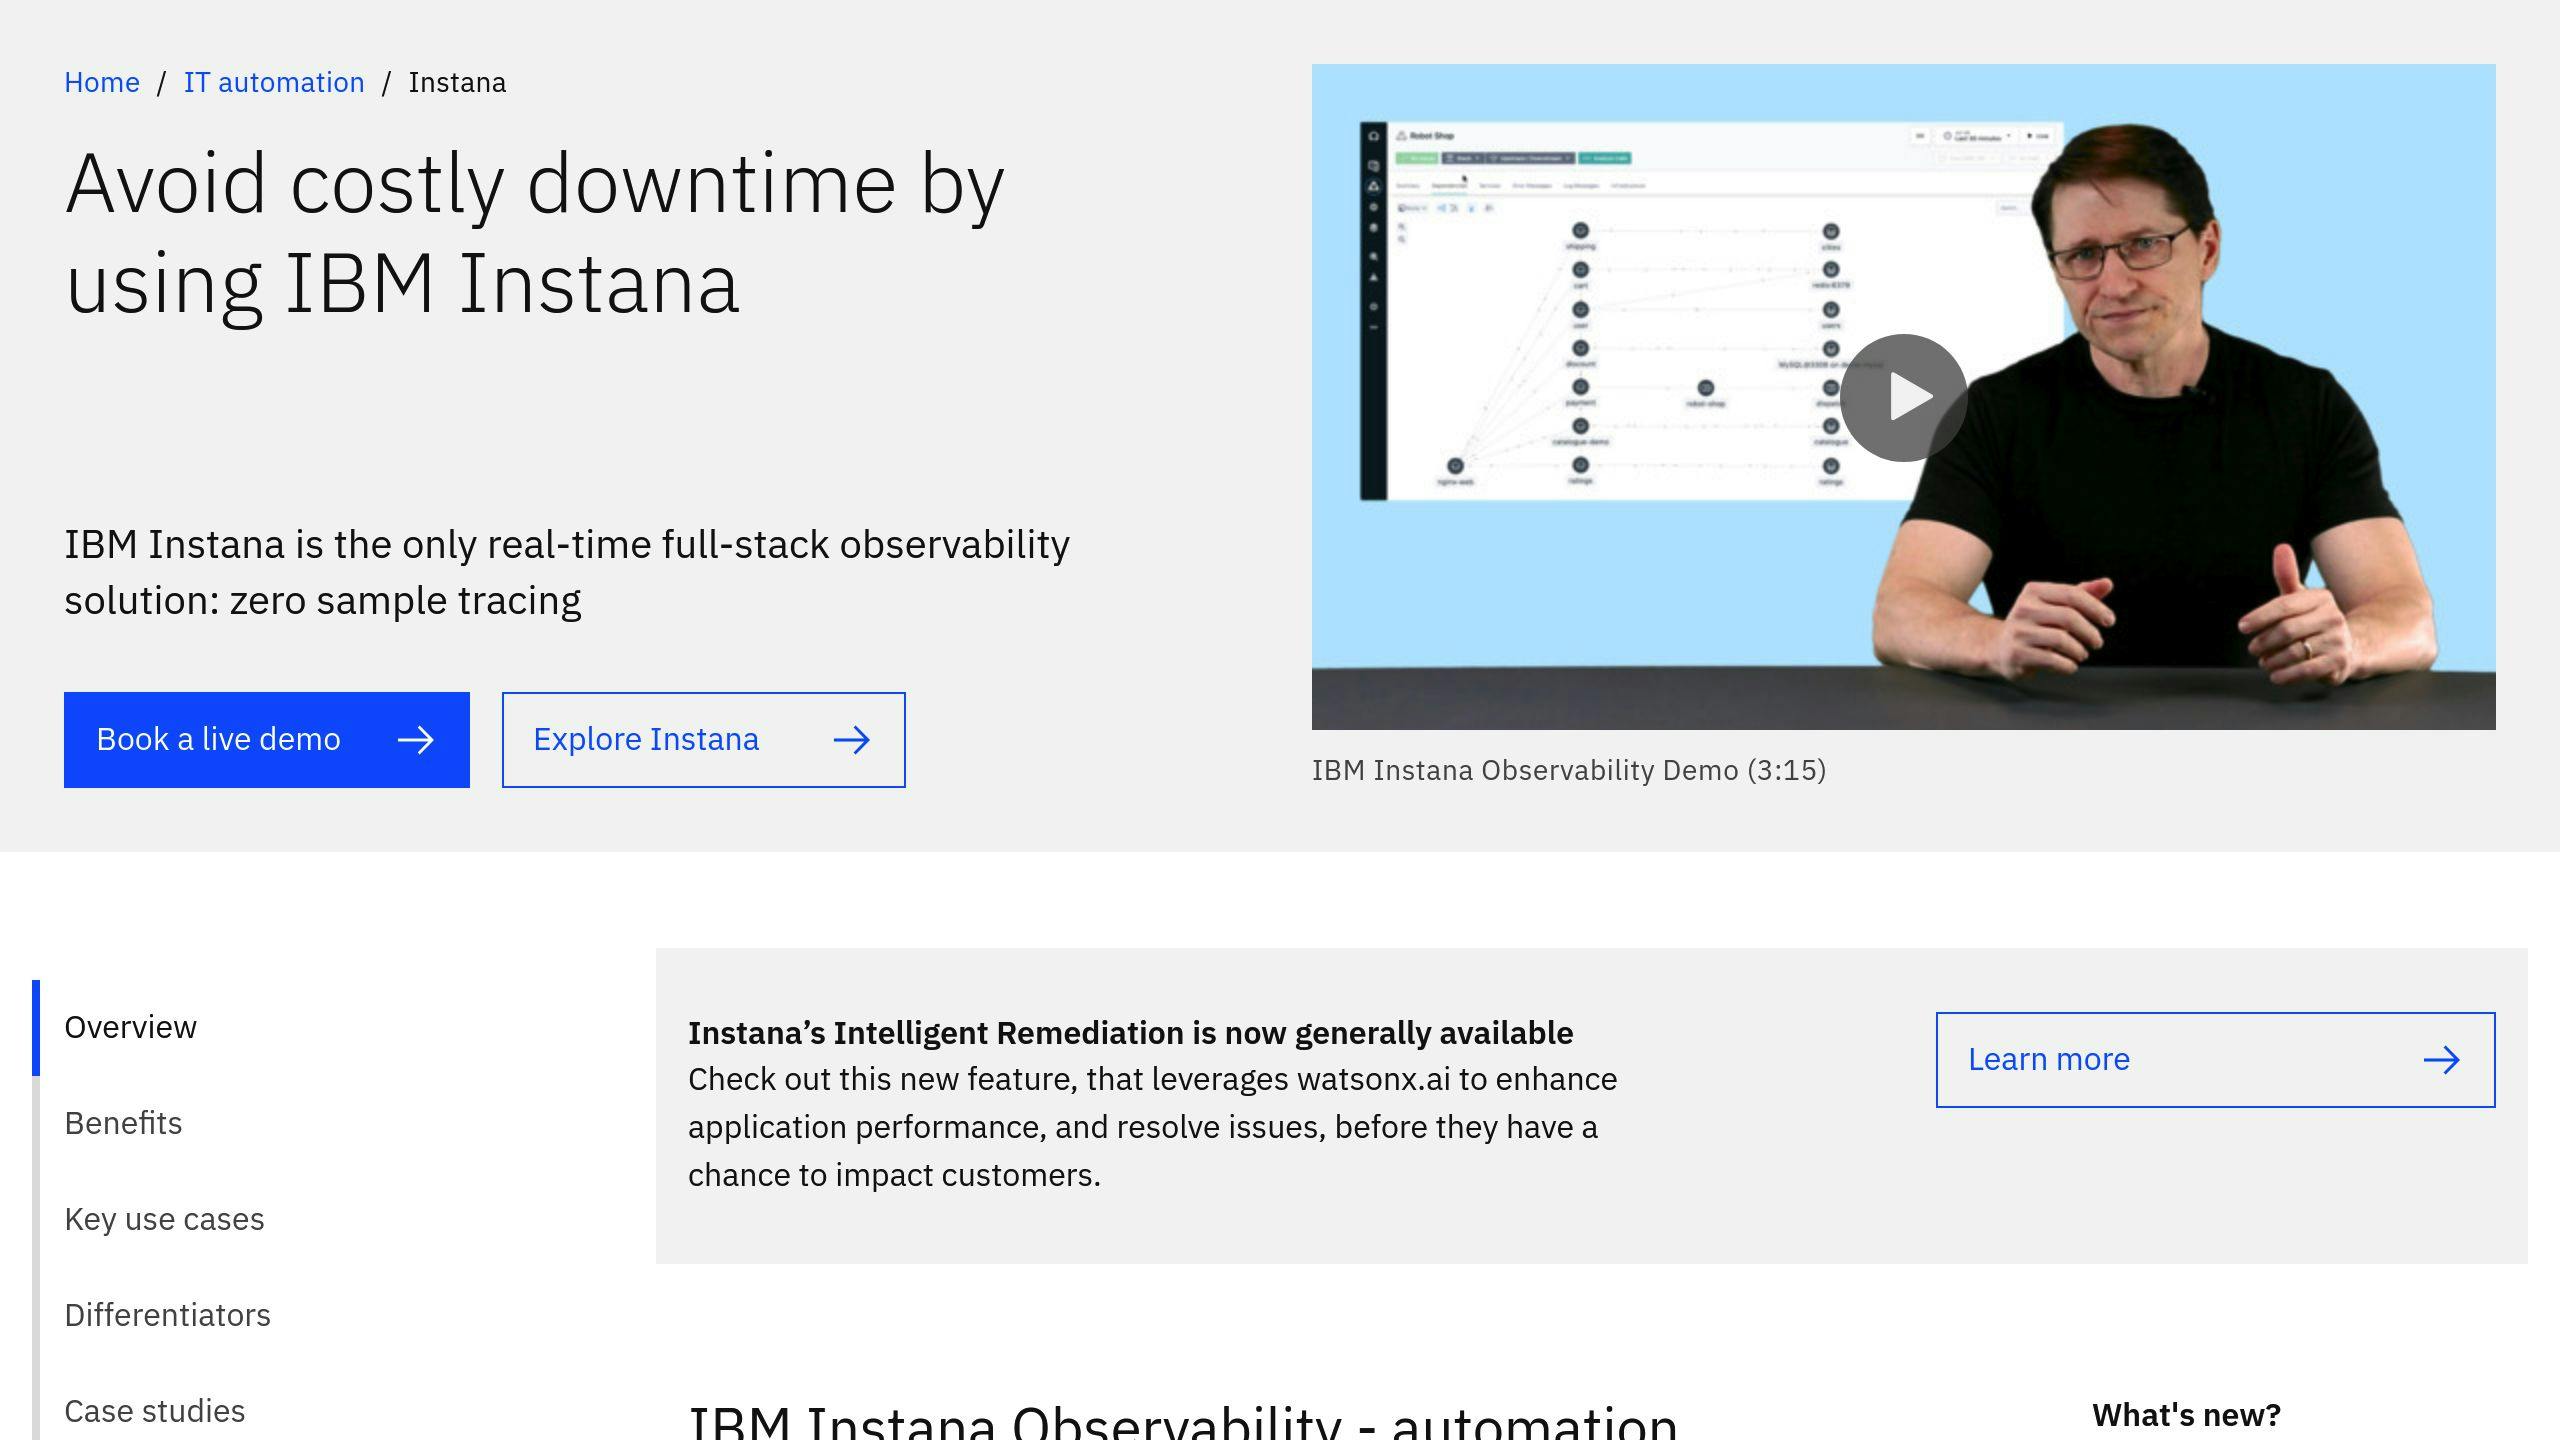
IBM Instana offers enterprise-grade full-stack observability for DevOps, SREs, and developers monitoring cloud-native and various tech platforms.
Key features:
- Auto full-stack visibility
- 1-second granularity, 3-second notifications
- Real-time stability monitoring
- AI-powered anomaly detection
- Custom Application Perspectives
Instana's auto discovery and mapping stand out, capturing all services and dependencies in real-time.
A large enterprise user shared:
"The real-time insights, automated root cause analysis, and seamless integration with Instana have completely changed the way we monitor performance and observability."
Comparing Instana to Datadog APM:
| Metric | IBM Instana | Datadog APM |
|---|---|---|
| Market Share | 0.51% | 0.17% |
| Customer Base | 1,845 | 621 |
| Ranking | 8th | 13th |
Pricing is node-based, not pod-based. Consider the annual model for cost forecasts.
For large-scale Instana deployment:
1. Use Ansible for agent deployment across clusters and VMs.
2. Implement GitOps for efficient Day 2 operations.
3. Integrate with Ansible for auto-remediation.
Drawbacks include high CPU use during debugging and slow support response times.
Despite challenges, many find Instana's monitoring superior to alternatives.
4. New Relic
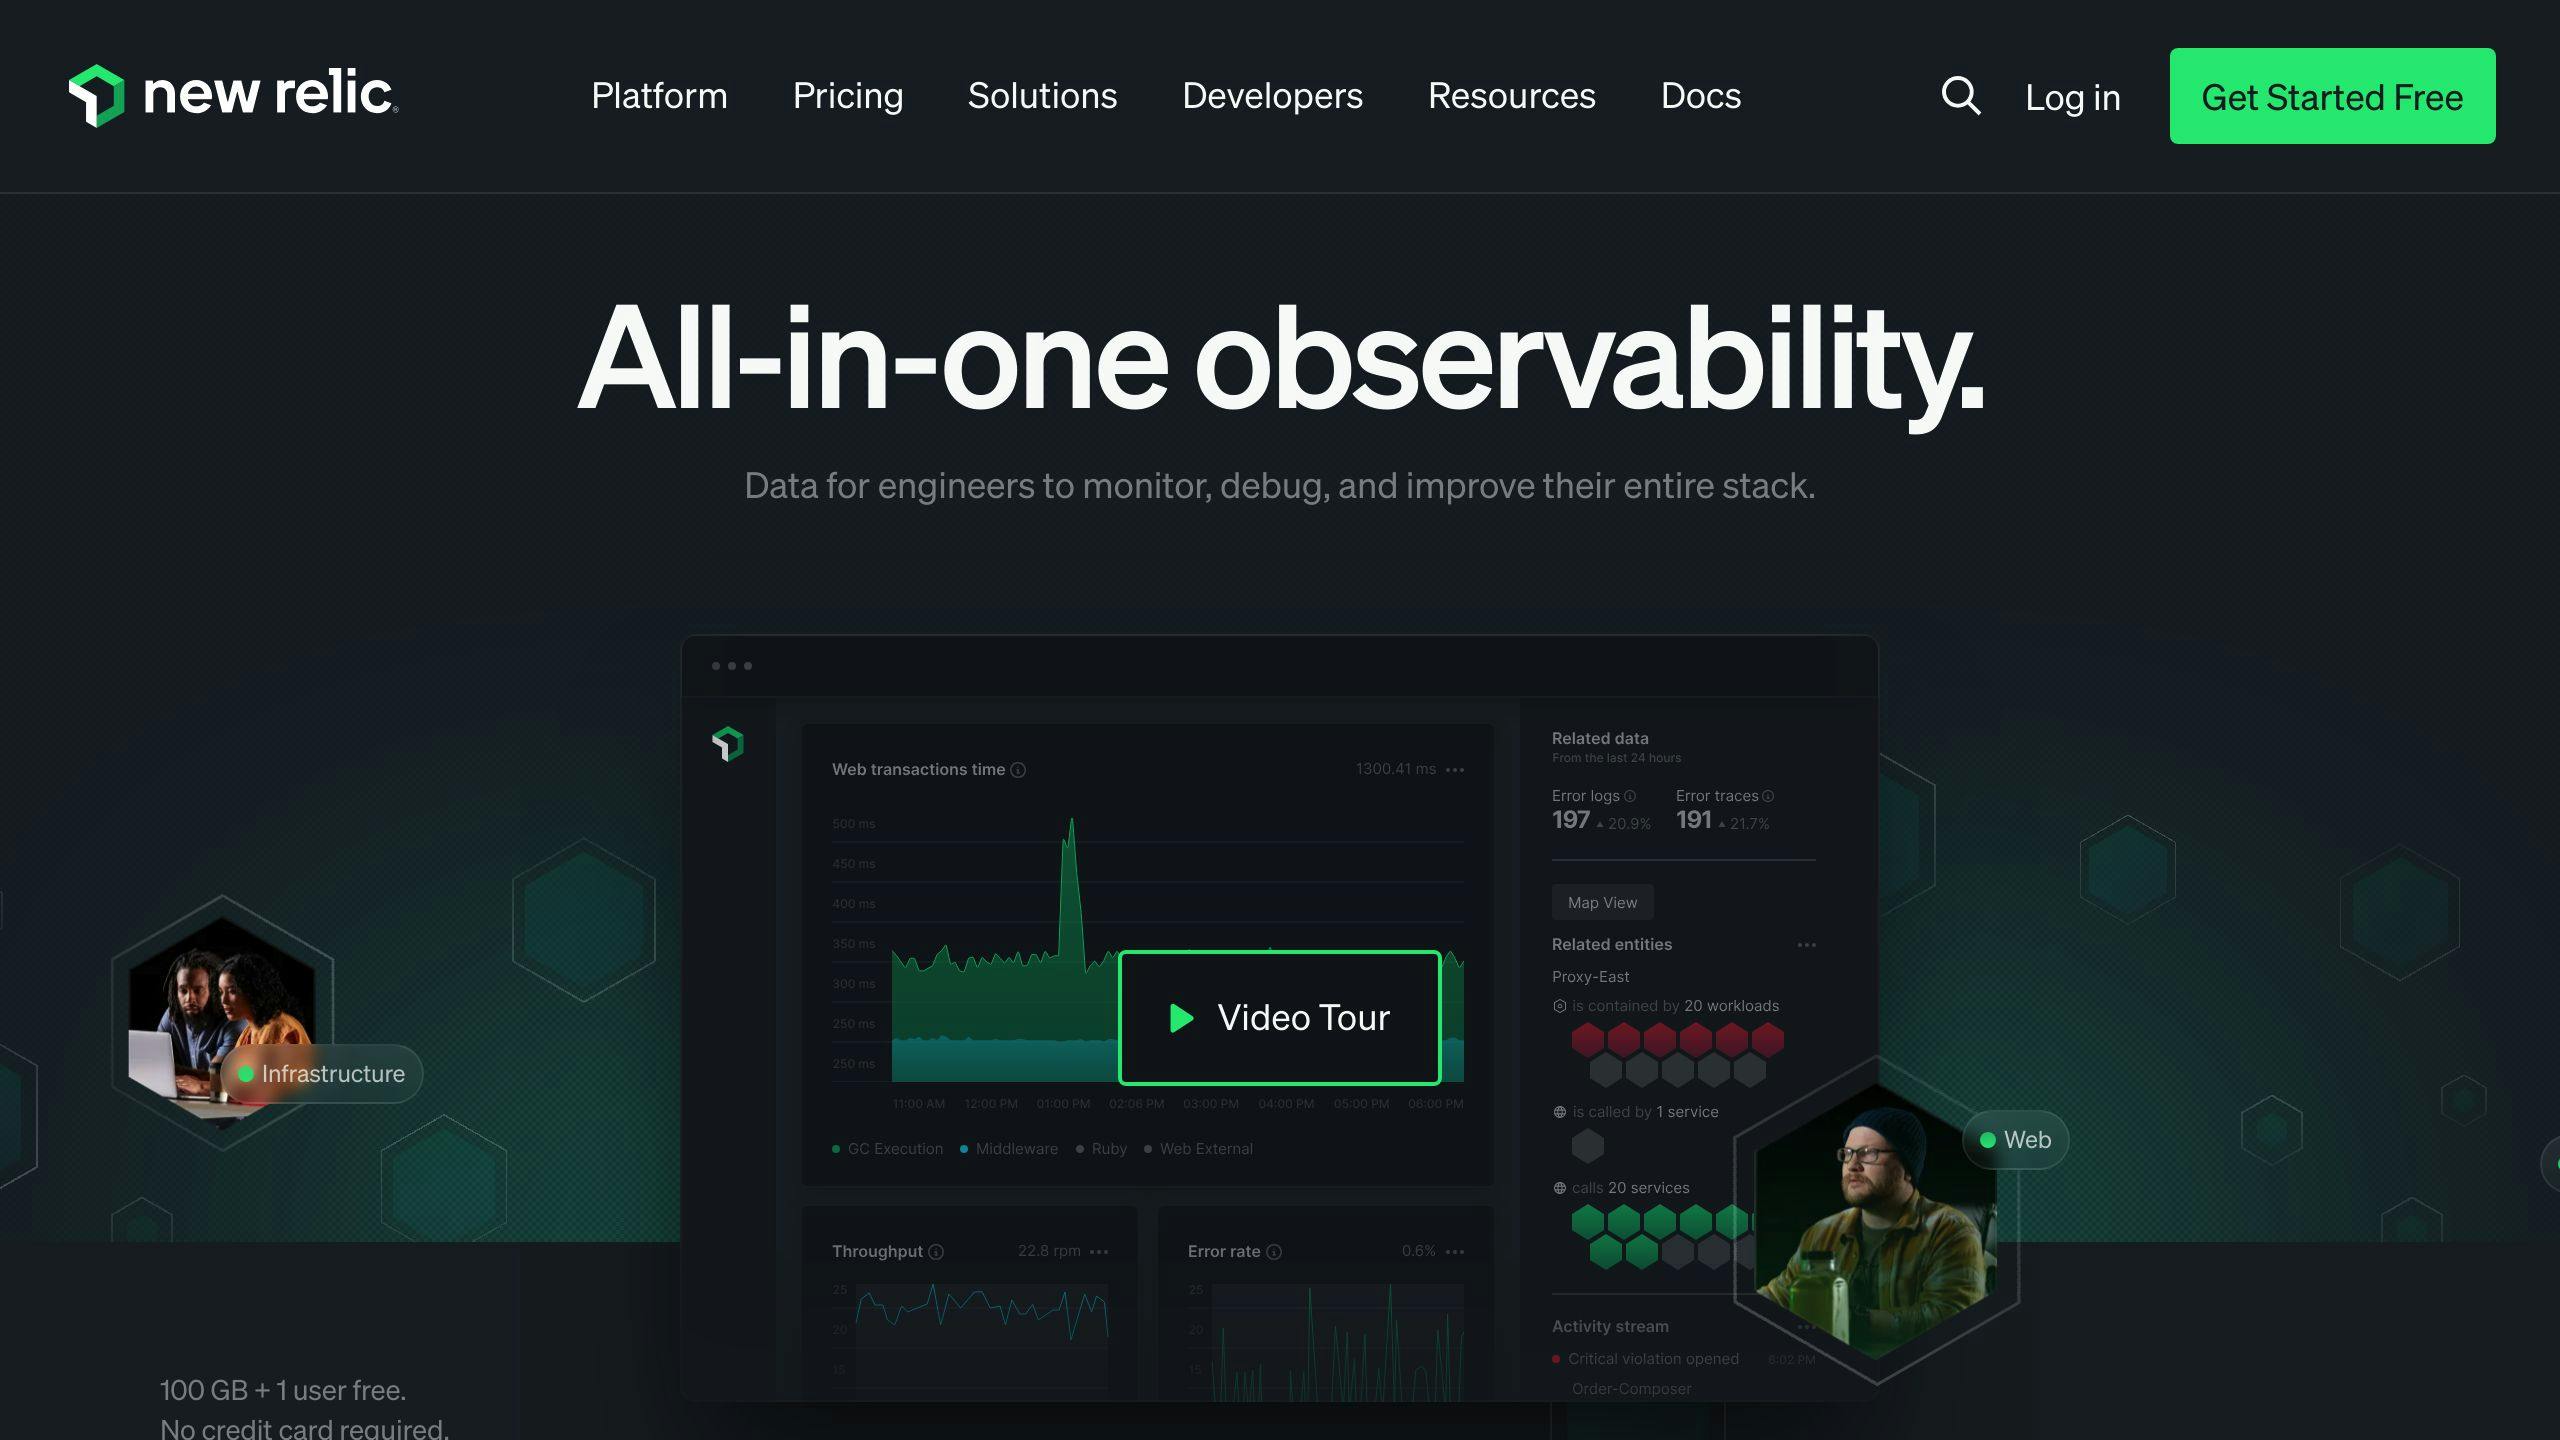
New Relic offers full-stack monitoring for apps, infrastructure, and user experiences. It helps engineers quickly detect and fix issues.
Key features:
- APM
- Infrastructure monitoring
- Log management
- AI-driven analytics and alerting
- Mobile and browser monitoring
New Relic's usage-based pricing can be cost-effective:
- 100 GB free data ingestion monthly
- $0.30 per GB extra ($0.35 for EU)
- User pricing: Basic (free), Core ($49/month), Full Platform ($99/month)
| Plan | Data | Users |
|---|---|---|
| Free | 100 GB/month | Unlimited Basic, 1 Full Platform |
| Paid | $0.30/GB | Core: $49/month, Full Platform: $99/month |
AI features like recommended alerts help teams quickly spot issues and fix alert gaps.
"We designed New Relic recommended alerts to remove those barriers, so teams have the alerts they need to proactively monitor their stack, diagnose incidents and prioritize them for immediate action before it impacts their customers, business, and bottom line." - Manav Khurana, CPO, New Relic
Drawbacks:
- Complex interface for new users
- Occasional data display issues
Companies like adidas Runtastic, American Red Cross, and Ryanair use New Relic to boost uptime and efficiency.
Consider your monitoring needs, budget, and team skills when evaluating New Relic as a Datadog alternative.
5. Splunk
Splunk unifies security and observability, analyzing data and logs for real-time monitoring and visualization. It's built to handle large volumes of machine-generated data.
Key features:
- Unified security and observability
- Data collection and indexing
- Search and analysis
- Alerting and reporting
- APM
- Network infrastructure monitoring
Splunk offers Cloud and Enterprise platforms, plus add-ons like Enterprise Security and IT Service Intelligence.
Pricing models:
| Model | Description | Best For |
|---|---|---|
| Ingest | Volume-based (GB/day) | Stable volume needs |
| Workload | Value-based, tied to search activity | Large upfront data ingest |
Both available for Enterprise and Cloud, with term licenses (on-premises) or annual subscriptions (cloud).
AIOps features include:
- ML-powered predictive analytics
- Anomaly detection for security threats
- Automated incident response
- ML-based root cause analysis
- Automated remediation
These streamline IT ops by predicting issues, spotting anomalies, and automating responses.
Splunk users report:
- 70% faster mean time to repair
- 64% less downtime
But Splunk can be costly to set up and maintain. It's best for large datasets, which may not suit smaller orgs or those with limited tech expertise.
When considering Splunk vs Datadog, weigh your needs, resources, and goals. Splunk excels with large machine-generated datasets and advanced analytics. But if you're cost-conscious or have limited tech resources, explore other options with similar features at lower prices or easier implementation.
sbb-itb-9890dba
6. Dynatrace

Dynatrace offers end-to-end observability for modern infrastructures, distributed apps, user experience, and business intelligence. It's enterprise-focused, covering cloud, on-premise, hybrid, and SaaS environments.
Key features:
- AI-powered observability
- APM
- Infrastructure monitoring
- Digital experience monitoring
- Cloud security
Dynatrace's OneAgent tech stands out, auto-scanning and capturing data from most infrastructure. This beats Datadog's manual config file setup.
Pricing is consumption-based, starting at $74 per 8GB per host. While pricey, many find it worth it:
"Great value. Somewhat expensive to bootstrap. Steep learning curve." - Verified User, Engineering Contributor, Financial Services (10,001+ employees)
Dynatrace vs Datadog:
| Feature | Datadog | Dynatrace |
|---|---|---|
| Focus | Cloud infrastructure and security | AI-powered app performance and security observability |
| Infrastructure agent | Manual config | Auto scanning and data capture |
| Incident Management | Nearly complete | Basic problem/incident management |
| Log management | Manual config | UI-enabled |
| OpenTelemetry | Limited | Full support |
| On-premise | Not available | Available |
Dynatrace's AI-powered APM features are more advanced than Datadog's. But it's pricier:
"Dynatrace is much more expensive than Pingdom, but it does a better job of synthetic monitors." - Verified User, IT Manager, Education Management (501-1000 employees)
Dynatrace has a steeper learning curve and less intuitive UI than Datadog. Users report needing multiple docs for setup.
It handles large data volumes and complex workloads well, suiting enterprise-level ops. It integrates with major cloud platforms and DevOps tools.
When weighing Dynatrace vs Datadog, consider its advanced AI features and auto infrastructure scanning against higher costs and complexity. Your choice depends on your needs, budget, and tech skills.
7. AppDynamics

AppDynamics offers robust APM for real-time app and IT infrastructure monitoring. It's built for enterprises with complex hybrid setups and large IT support teams.
Key features:
- Comprehensive observability (metrics, logs, tracing)
- AI-powered root cause analysis
- Code-level diagnostics and transaction tracing
- Support for specialized tech (e.g., mainframes, SAP)
AppDynamics vs Datadog:
| Feature | AppDynamics | Datadog |
|---|---|---|
| Installation | More involved | Lightweight, agentless |
| Tech support | Better for specialized/legacy | Modern-focused |
| Analytics | Advanced, code-level insights | Basic |
| Pricing | Data ingestion-based | Flexible (hosts/metrics) |
AppDynamics pricing tiers:
- Infrastructure Monitoring: $6 per CPU core/month
- Premium: $33 per CPU core/month
- Enterprise: $50 per CPU core/month
- Enterprise for SAP: $95 per CPU core/month
AppDynamics offers powerful features but has a steeper learning curve. For complex apps, the deep insights can justify the investment.
Its automated problem resolution can cut mean time to resolution (MTTR), crucial for large-scale ops needing quick issue fixes.
When considering AppDynamics vs Datadog, weigh its advanced features against higher costs and complex setup. Your choice depends on your needs, budget, and tech skills.
8. Sumo Logic
Sumo Logic offers cloud-based log management and analytics, focusing on monitoring, troubleshooting, and securing AWS environments. It stands out with AI-driven analytics and comprehensive observability tools.
Key features:
- AWS Log Analytics: Auto-collects from 12 core AWS services
- AI-Driven Alerting: Cuts noise, highlights critical issues
- Cloud SIEM: Insights on active threats and non-compliant security
- Copilot: Simplifies log analysis with natural language processing
Pricing tiers:
| Plan | Price/Credit | Features |
|---|---|---|
| Free | $0 | Up to 500MB/day log analytics, 7-day retention |
| Sumo Logic | $0.13 | 10 GB/day limit, log analytics and monitoring |
| Enterprise Operations | $0.23 | Advanced observability, 24/7 support |
| Enterprise Security | $0.23 | Advanced Cloud SIEM, threat analytics |
| Enterprise Suite | $0.25 | Advanced operational and security intelligence |
Sumo Logic's new Flex Licensing offers free, unlimited log data ingest, charging only for storage and analytics.
Sumo Logic vs Datadog:
| Aspect | Sumo Logic | Datadog |
|---|---|---|
| Focus | Enterprise Observability and Security | Cloud infrastructure and security monitoring |
| UI | More complex, needs research | User-friendly, guided setup |
| Incident Management | Custom alerting, various tool integrations | User-friendly incident response |
| Log Management market share | 1.62% | 62.46% |
Sumo Logic CEO Joe Kim states: "Every organization across every industry is transforming, relying on digital and cloud to accelerate innovation, develop a competitive edge and help service their customers better."
When considering Sumo Logic vs Datadog, weigh its AI-driven analytics and AWS monitoring strengths against its complex UI and smaller market share. Your choice depends on your needs, tech skills, and budget.
Comparing Pros and Cons
Here's a quick comparison of the main Datadog alternatives:
| Alternative | Pros | Cons |
|---|---|---|
| AWS CloudWatch | Free basic plan, AWS integration | AWS-focused, less user-friendly |
| LogicMonitor | AIOps, APM, dynamic mapping | Pricey, weak network monitoring |
| IBM Instana | Full-stack observability, easy map | Hidden pricing, may lack features |
| New Relic | Free <100GB/month, strong APM | User pricing adds up, weak containers |
| Splunk | All-in-one security/monitoring | Starts at $15/host/month, manual viz |
| Sumo Logic | AI analytics, customizable | Complex setup, small market share |
| Dynatrace | AI problem ID, strong logs/cloud | Pricier, poor docs |
| AppDynamics | Full-stack, strong APM | Starts at $60/CPU core/month, complex |
Remember, Datadog's pricing can surprise. A crypto company faced a $65M bill from Datadog.
New Relic's CEO Bill Staples said: "We believe the days of charging based on hosts, agents, or data volume are over." This shows a shift to clearer pricing.
Each tool has strengths. Dynatrace's Davis AI might offer deeper insights. Splunk suits large enterprises needing comprehensive security and monitoring.
But they have drawbacks too. New Relic's costs can jump 66% at scale. Dynatrace often costs more than Datadog.
Open-source options like SigNoz are gaining traction, offering logs, metrics, and traces in one interface.
Choose based on your needs, budget, and tech skills. CloudWatch might work for AWS-centric ops. Splunk or Dynatrace could fit enterprises needing comprehensive monitoring. Smaller companies might prefer Better Stack or Sumo Logic.
Wrap-up
Exploring Datadog alternatives isn't just about saving money—it's about finding the right fit for your monitoring needs. The market offers many options, each with unique features and pricing.
Key takeaways:
1. Know your needs: Before switching, assess what you really need. Full-stack observability? Focused APM? Let your use case guide you.
2. Watch your budget: Datadog's pricing can surprise. A crypto company once faced a $65M bill. Look for clearer pricing models if cost control matters.
3. Compare features: Each tool shines differently:
- New Relic: Free <100GB/month, strong APM
- Dynatrace: AI-powered problem spotting
- Splunk: Excels in enterprise security and monitoring
4. Consider open-source: Options like SigNoz offer predictable pricing and avoid vendor lock-in.
5. Check integrations: Ensure the tool fits your systems. AWS-heavy? CloudWatch might work. Others may need broader solutions.
Remember, there's no one-size-fits-all. Your best choice depends on your needs, budget, and tech skills. Evaluate options, run trials, and get team feedback before deciding.
FAQs
Is Prometheus better than Datadog?
It depends on your needs:
- Datadog: SaaS, easier setup, less control
- Prometheus: Self-hosted, more setup, more control and flexibility
Choose based on your team's skills and customization needs.
Is Dynatrace better than Datadog?
Dynatrace offers some advantages, especially in AI features and APM. It focuses on:
- Modern infrastructure monitoring
- Distributed apps
- User experience
- Business intelligence
Dynatrace's AI might offer deeper insights for complex systems.
What's the difference between Datadog and AppDynamics?
The main difference is setup:
| Feature | Datadog | AppDynamics |
|---|---|---|
| Setup | Agentless | Needs agents |
| Ease of use | Quicker start | More complex setup |
Datadog's agentless approach is often easier to implement.
Who's Datadog's biggest competitor?
There's no single "biggest" competitor, but several stand out:
- Dynatrace
- New Relic
- LogicMonitor
- IBM Instana
- Checkmk
Each offers unique features that might better suit specific needs.
What's the equivalent of Datadog?
New Relic is often seen as the closest to Datadog. It offers similar features:
- Application monitoring
- Infrastructure monitoring
- Charting and dashboards
- Alerting
- Log management
But each tool has strengths, so evaluate based on your specific needs.