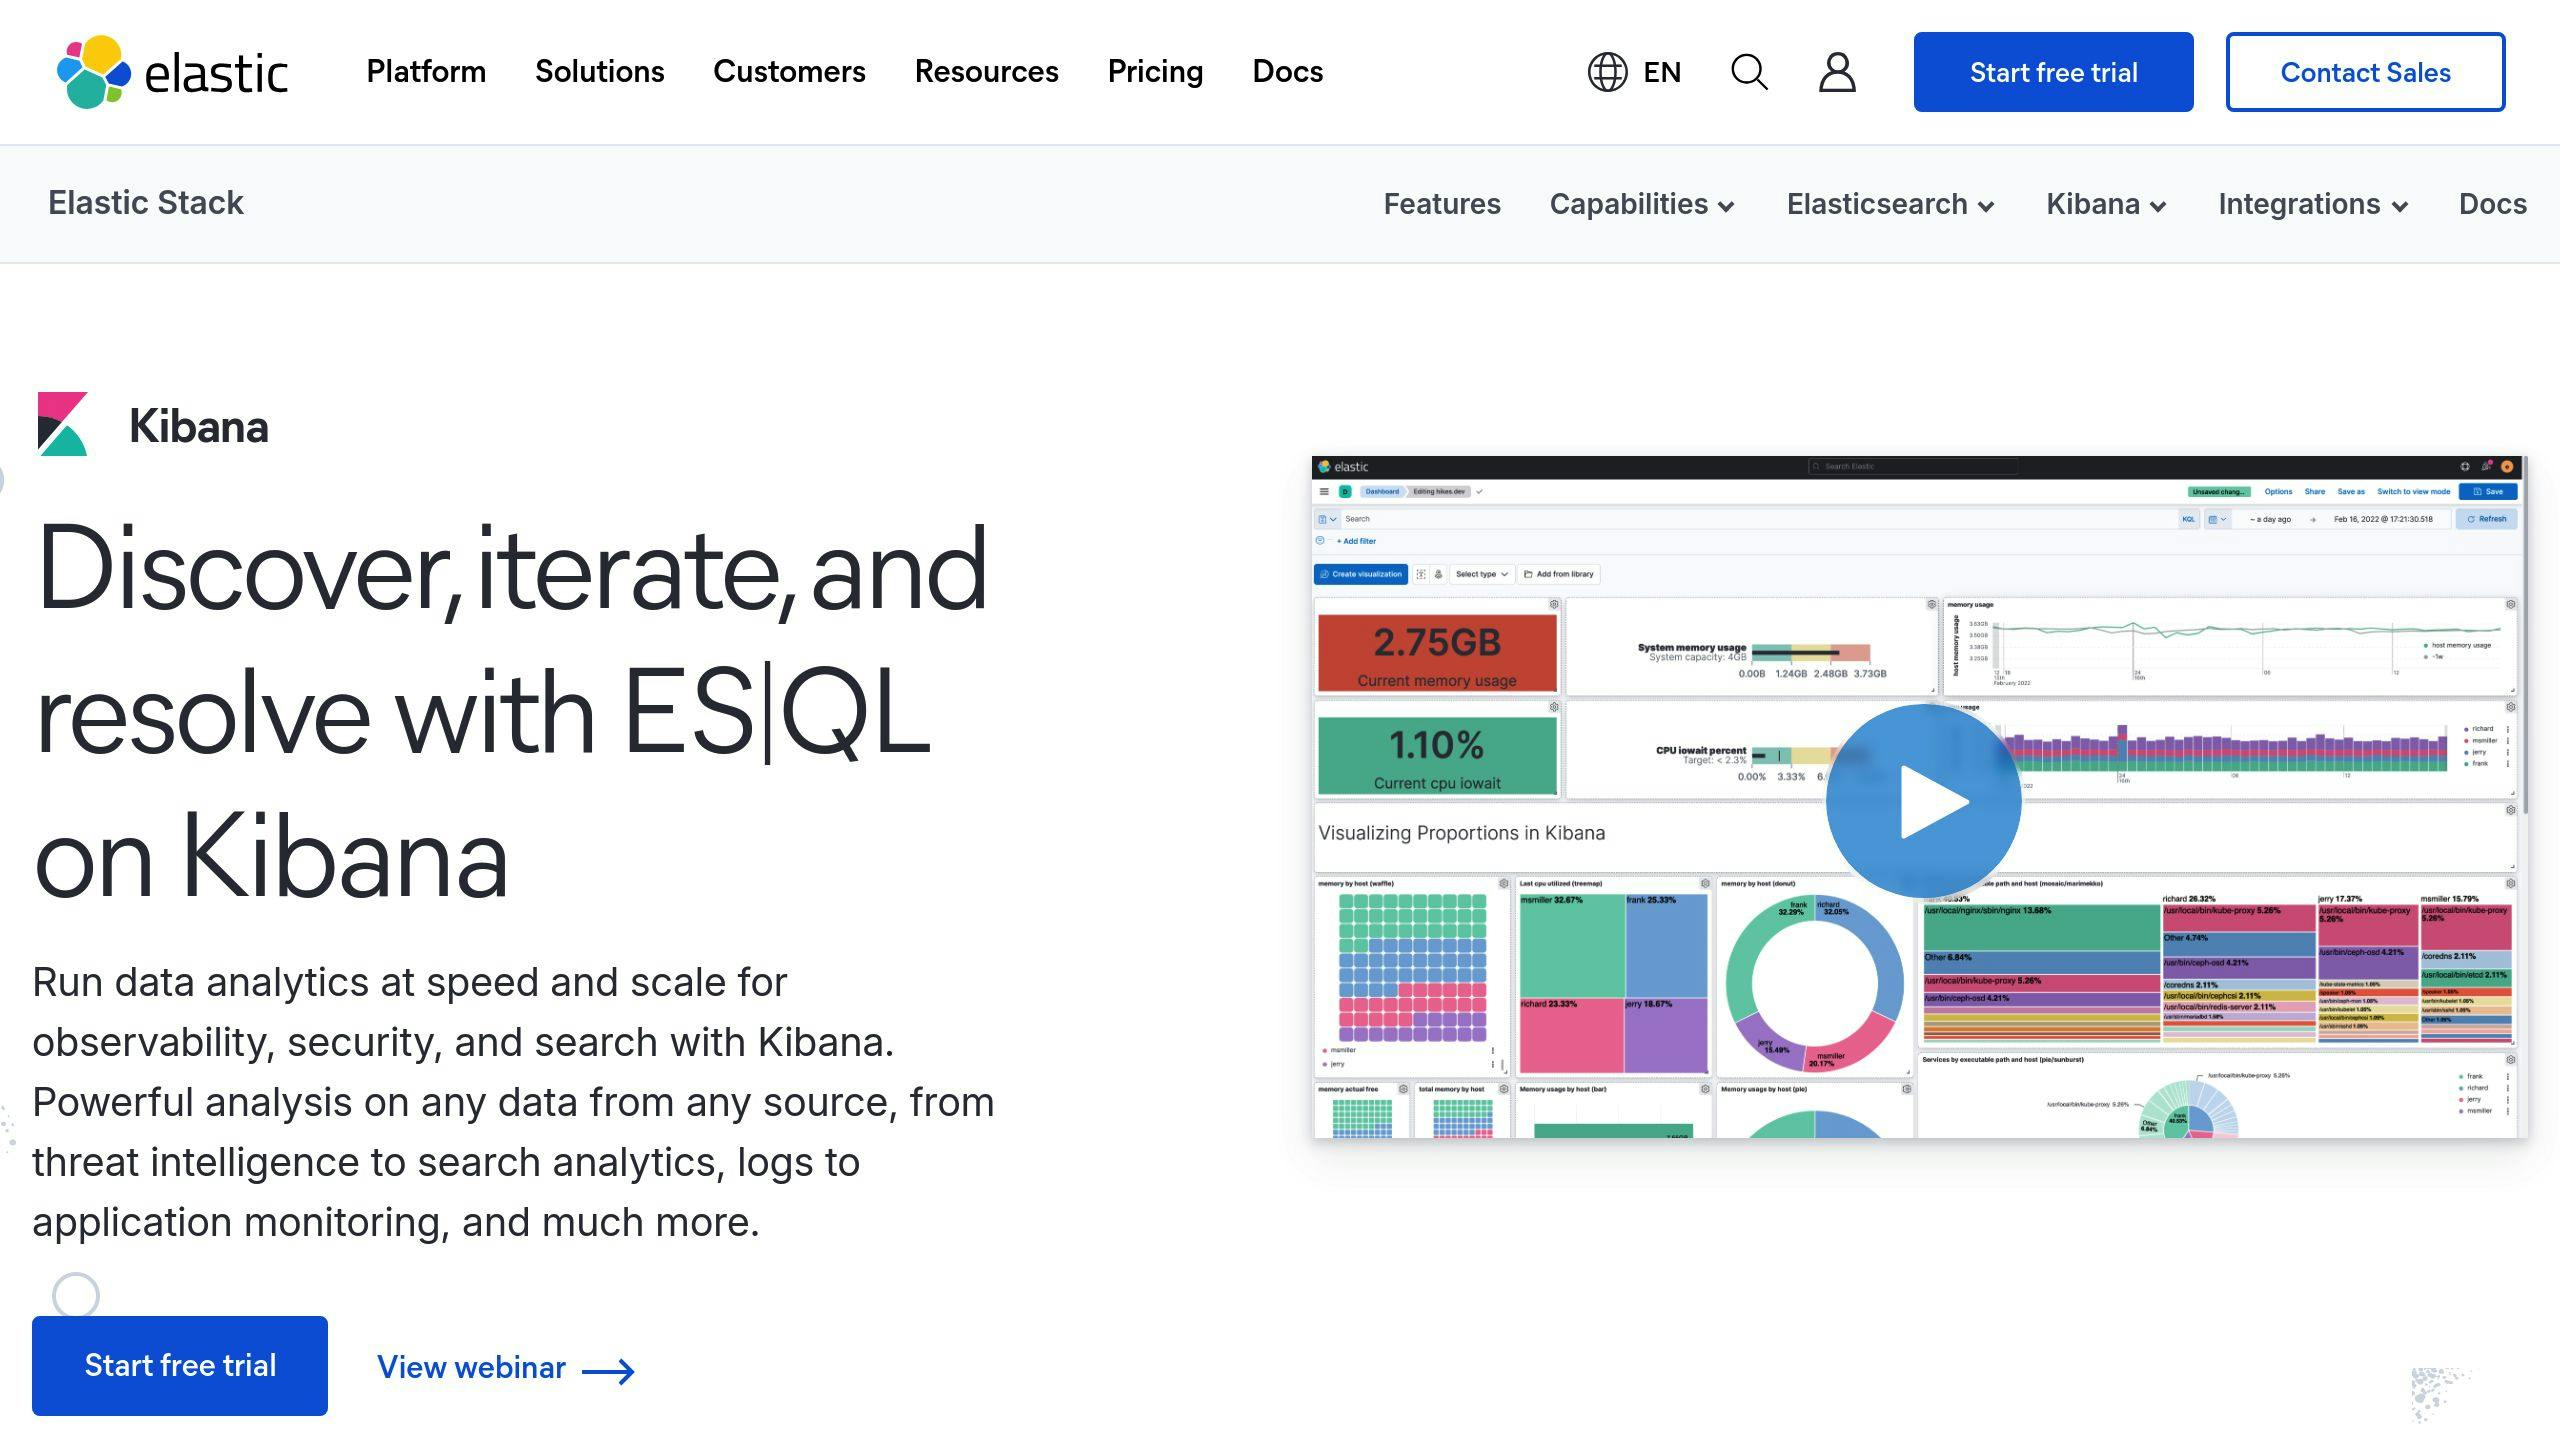
Detect IT issues before they escalate. This guide explains how to use the ELK Stack (Elasticsearch, Logstash, and Kibana) for anomaly detection, helping you spot unusual patterns in your data quickly. Learn to set up detection jobs, analyze results, and integrate insights into your workflows.
Key Takeaways:
- Set Up Detection Jobs: Use Kibana’s Machine Learning interface to monitor performance metrics.
- Analyze Anomalies: Interpret results using tools like the Anomaly Explorer and Single Metric Viewer.
- Optimize Accuracy: Clean your data, fine-tune detection rules, and adjust thresholds.
- Integrate Tools: Extend functionality with platforms like Grafana or ITSM systems.
Start small by identifying critical metrics, then scale as you refine your anomaly detection setup.
Steps to Set Up Anomaly Detection in the ELK Stack

Tools and Requirements
Before you dive into setting up anomaly detection in the ELK Stack, make sure you have everything you need:
- An Elasticsearch license that supports machine learning features
- Elasticsearch and Kibana with the Machine Learning plugin installed and running
- Proper security settings and user permissions in place
- Browser access to fully utilize Kibana's features [3]
Once these components are in place, you're ready to configure anomaly detection jobs in Kibana.
How to Configure Anomaly Detection in Kibana

Getting anomaly detection up and running in Kibana involves a series of steps within the Machine Learning interface.
- Access the Machine Learning Interface
Log in to Kibana and head to the Machine Learning section. Check that your account permissions allow you to create and manage anomaly detection jobs [3].
- Create a New Detection Job
Go to the Job Management area to set up your anomaly detection job. You'll need to define:
- The data source and index patterns
- The time field for analysis
- Detection intervals
- Metrics to monitor
- Fine-Tune Detection Parameters
Leverage tools like the Anomaly Explorer and Single Metric Viewer to adjust:
Once your detection job is configured, you’ll want to ensure your data sources are properly linked to the ELK Stack.
Connecting Data Sources to the ELK Stack
Accurate anomaly detection depends on clean and properly integrated data. The ELK Stack supports a range of time series data sources [3].
Here’s how to integrate your data:
- Prepare and configure your data for real-time ingestion into Elasticsearch.
- Test the data flow and confirm proper indexing.
- Monitor data quality to reduce false positives [1][4].
Consistent data formatting and a reliable connection between your sources and the ELK Stack will help ensure accurate results.
Machine Learning Tutorial - Creating a Single Metric Job
How to Manage and Analyze Anomaly Detection Jobs
Once you've set up anomaly detection jobs in Kibana, the real work begins - managing and analyzing them effectively to uncover actionable insights.
Picking the Right Anomaly Detection Job
The ELK Stack offers two main types of jobs:
- Single Metric Jobs: These focus on monitoring one data stream at a time, making them perfect for straightforward tasks like tracking ingest rates. They’re simple to configure and great for those just starting out.
- Multi-Metric Jobs: These handle multiple metrics at once, such as CPU usage, memory, and network traffic. They’re ideal for identifying more complex patterns in your data.
Interpreting Anomaly Detection Results
The Anomaly Explorer in Kibana is your go-to tool for understanding results:
- Check the timeline to spot anomalies based on their severity and timing.
- Focus on anomalies with high scores (75 or above) for deeper investigation.
- Use the Single Metric Viewer to add annotations that explain events like scheduled maintenance or system upgrades. This adds important context to your data [1].
After reviewing your results, it’s time to fine-tune your detection jobs for better accuracy.
Optimizing Detection Jobs
To improve the precision of your anomaly detection jobs, consider these steps:
Enhancing Data Quality
- Use clean, well-structured data to minimize false positives.
- Address any missing values to ensure consistent analysis.
Adjusting Job Configurations
- Modify memory limits for jobs that handle large datasets.
- Tweak detection rules using Kibana’s settings for better alignment with your use case.
- Create custom calendars to factor in predictable changes, like maintenance periods or holidays [1][4].
sbb-itb-9890dba
Advanced Tips and Best Practices for Anomaly Detection
Preparing Data for Accurate Detection
Start by improving data quality. Normalize timestamps, address missing values, and use tools like the Logstash aggregate filter to group events effectively. For time-series data, ensure consistent sampling by organizing data points into fixed time intervals.
Once your data is in good shape, focus on customizing anomaly detection rules to fit your specific operational requirements.
Crafting Custom Detection Rules
Kibana allows you to create rules tailored to your environment. Navigate to the Settings pane to set up rules that reflect your operational patterns.
Define rules by selecting appropriate time windows, setting thresholds based on historical trends, and using machine learning features to adjust thresholds automatically. These configurations help align anomaly detection with your organization's needs.
In addition to custom rules, integrating the ELK Stack with other tools can significantly expand your detection capabilities.
Extending ELK with Additional Tools
Take your anomaly detection to the next level by integrating ELK with other platforms. For example:
- Grafana: Offers advanced visualization options.
- ITSM Platforms: Automates incident management processes.
- AI Tools like Eyer.ai: Provides predictive analysis for proactive insights.
To set up these integrations:
- Configure Elasticsearch as a data source.
- Set up alerts triggered by anomaly detection results.
- Use Kibana's Webhook output to automate incident creation.
These integrations not only improve visualization and incident management but also create a more comprehensive and efficient anomaly detection process [1][4].
Summary and Next Steps
Key Takeaways from the Guide
This guide walked through the process of preparing data, setting up detection jobs, analyzing results, and connecting ELK with other tools to improve monitoring and decision-making. Together, these steps create a strong framework for detecting anomalies in IT systems.
Here’s what we covered:
- Data preparation and normalization to ensure clean, usable inputs
- Configuring detection jobs in Kibana with step-by-step instructions
- Analyzing results using advanced tools for deeper insights
- Integrating with external platforms to extend monitoring capabilities
These elements serve as a solid starting point for enhancing IT monitoring through anomaly detection.
Getting Started with Anomaly Detection
Now that you have the knowledge, it’s time to apply it. Begin by identifying key use cases where anomaly detection can make a difference, focusing on metrics tied to system performance and security [3].
Start small - pick one use case to test and refine your approach. Use Elastic's documentation, community forums, and other resources to improve your setup over time. Expand your efforts gradually as you gather insights and measure results.
FAQs
How do I enable machine learning in Kibana?
To enable machine learning in Kibana, follow these steps:
- Set up security privileges: Ensure Elasticsearch security privileges are properly configured.
- Assign roles: Provide users with the
machine_learning_adminormachine_learning_userrole as needed. - Test access: Use Kibana's Dev Tools to confirm that machine learning APIs are accessible.
Make sure Elasticsearch security features are active before starting the machine learning setup [1].
What are the key configuration steps?
Go to the Machine Learning page in Kibana to set up a detection job. Select your data source and adjust the job settings as needed. The Job Management pane, mentioned earlier, helps you monitor and make changes efficiently [1].
For step-by-step guidance, check out the "How to Configure Anomaly Detection in Kibana" section above.
How can I improve detection accuracy?
To get better detection results:
- Clean your data: Ensure the data is well-structured and consistent.
- Fine-tune aggregation: Focus on key metrics and use aggregation methods that align with your monitoring goals [4].
Leverage tools like the Anomaly Explorer and Single Metric Viewer to adjust detection settings. For more tips, see the "Optimizing Detection Jobs" section [1].
These FAQs offer quick solutions to common issues, helping you make the most of anomaly detection in the ELK Stack.
Related posts
- Unveiling the Power of Anomaly Detection in the ELK Stack: A Comprehensive Guide
- Enhancing Your ELK Stack with Anomaly Detection: Strategies for Success
- Anomaly Detection in the ELK Stack: Tools and Techniques for Effective Monitoring
- Anomaly Detection for the ELK Stack: Optimizing Performance and Security


